Predictive Presymptomatic Testing Market Analysis North America, Europe, Asia, Rest of World (ROW) - US, Germany, Japan, UK, France - Size and Forecast 2024-2028

Predictive Presymptomatic Testing Market Analysis North America, Europe, Asia, Rest of World (ROW) - US, Germany, Japan, UK, France - Size and Forecast 2024-2028

Published: Jul 2024 136 Pages SKU: IRTNTR73137

Market Overview at a Glance

$2.59 B
Market Opportunity
10.03%
CAGR
8.88
YoY growth 2023-2024(%)

Predictive Presymptomatic Testing Market Size 2024-2028 

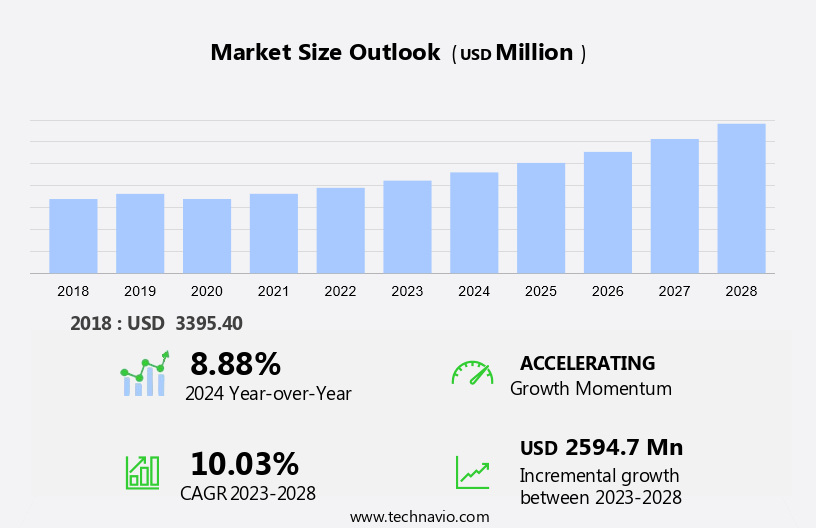
The predictive presymptomatic testing market size is forecast to increase by USD 2.59 billion, at a CAGR of 10.03% between 2023 and 2028. The global Predictive Presymptomatic Testing market is experiencing significant growth due to several key factors. Firstly, the increasing healthcare spending worldwide is driving demand for advanced diagnostic tools and genetic testing. Secondly, the rise in awareness toward early screening of genetic disorders has led to an increasing demand for predictive presymptomatic testing. This testing allows individuals with a family history of certain genetic disorders to identify their risk and take preventative measures before symptoms appear. Genetic counseling plays a crucial role in this process, providing essential information and support to individuals and families. As a result, the market for predictive presymptomatic testing is expected to grow steadily in the coming years.

What will be the Size of the Market During the Forecast Period?

Predictive Presymptomatic Testing Market Size

For More Highlights About this Report, Request Free Sample

Market Dynamic

In the realm of wearable technology, wrist watches and jewelry have evolved beyond mere accessories into functional devices that monitor health risks and track sleep patterns. Innovations like augmented reality and virtual reality are reshaping how we interact with information and environments, enhancing experiences through speech recognition and immersive visuals. Devices such as Google Glass integrate seamlessly into daily life, offering real-time data and enhancing safety with features like camera integration for recording events. For active lifestyles, wearables like heart rate monitors and shoes equipped with sensors provide insights into exercise intensity and performance. The development of coexistence testing ensures these technologies work harmoniously without interference, akin to how pigeons navigate without colliding in crowded skies. From tracking steps to enhancing productivity, wearable technology continues to blur the lines between fashion and functionality, promising a future where innovation meets everyday convenience.

Key Market Driver

The increasing healthcare spending worldwide is one of the key drivers supporting the predictive presymptomatic testing market growth. The governments of developed nations such as the US, Germany, and others have increased their healthcare expenditure in recent years. Through the support of the governments and a surge in healthcare expenditures, global private and public healthcare facilities and not-for-profit organizations (NPOs) are able to provide their services to patients. According to The World Health Organization (WHO), global spending on healthcare continually rose between 2000 and 2018 and reached USD 8.3 trillion or 10% of global GDP. Thus, the increasing expenditure in the global healthcare sector and the increase in government aid to healthcare providers will boost the growth of the global predictive presymptomatic testing market during the forecast period.

Significant Market Trends

The growing prevalence of genetic diseases is one of the key predictive presymptomatic testing market trends that is contributing to the market growth. According to the Centers for Disease Control and Prevention (CDC), in the US, more than 1.6 million patients are getting diagnosed with cancer every year, with almost 600,000 fatalities. The incidence of genetic disorders is gradually increasing. Moreover, the increasing incidence of chronic diseases and genetic disorders leads researchers and scientists to opt for predictive presymptomatic testing for diagnosing and treating patients. Researchers are increasingly focusing on predictive presymptomatic testing due to its high impact on diagnosing and treating diseases using gene therapy and recombinant vaccines. Hence, an increase in the prevalence of genetic disorders is expected to drive the growth of the global predictive presymptomatic testing market during the forecast period.

Major Market Challenge

The high cost of tests is one of the factors hindering the predictive presymptomatic testing market growth. For instance, in 2019, the per capita healthcare expenditure was USD 7,138 in Switzerland, USD 6,748 in Norway, and USD 6,731 in Germany. Additionally, in developing countries such as India, China, and others, due to a lack of resources and low per capita income, patients are unable to avail themselves of predictive presymptomatic test kits. The absence of proper healthcare infrastructure and less amount of government aid received in the form of medical expense reimbursement further acts as a challenge for the patients in these countries. Thus, the global per capita healthcare cost is expected to increase during the forecast period. This will negatively affect the growth of the global predictive presymptomatic testing market during the forecast period.

Exclusive Customer Landscape

The market forecasting report includes the adoption lifecycle of the market, covering from the innovator’s stage to the laggard’s stage. It focuses on adoption rates in different regions based on penetration. Furthermore, the report also includes key purchase criteria and drivers of price sensitivity to help companies evaluate and develop their market growth analysis strategies.
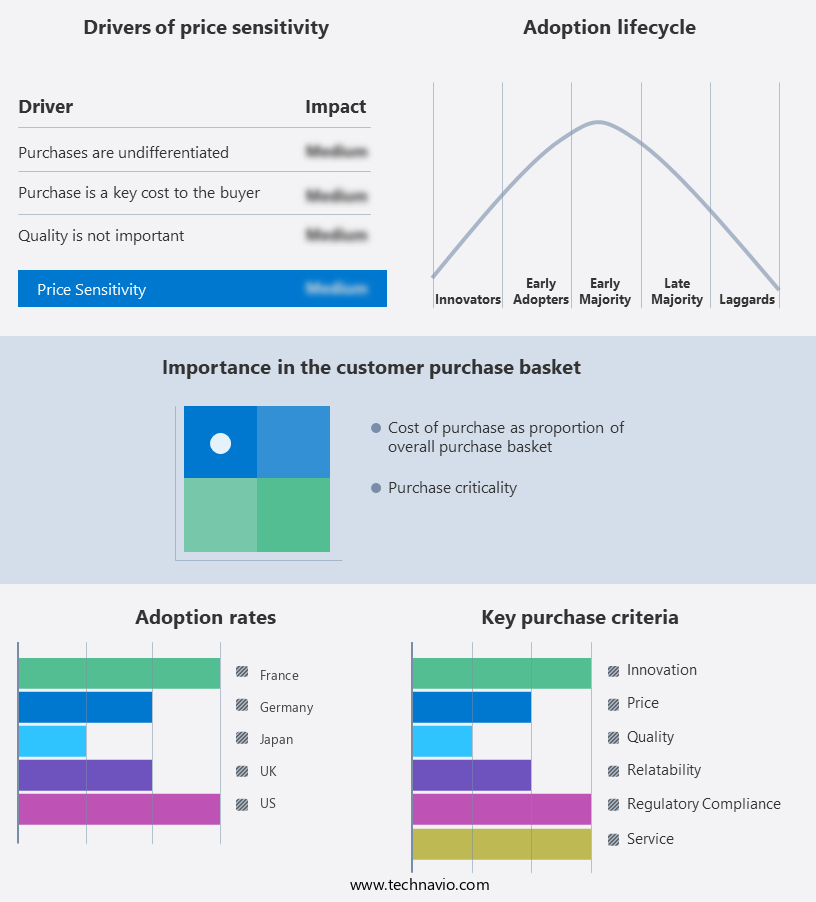
Predictive Presymptomatic Testing Market Share by Geography

 Customer Landscape

Key Companies & Market Insights

Companies are implementing various strategies, such as strategic alliances, partnerships, mergers and acquisitions, geographical expansion, and product/service launches, to enhance their presence in the market.

23andMe Holding Co. - The company offers predictive presymptomatic testing such as BRCA1 and BRCA2 which helps in repairing DNA breaks that can lead to cancer.

The market research and growth report also includes detailed analyses of the competitive landscape of the market and information about key companies, including:

  • Abbott Laboratories
  • Amgen Inc.
  • BioAxis DNA Research Centre P Ltd.
  • Color Health Inc.
  • Deep Genomics Inc.
  • Direct Laboratory Services LLC
  • DNA and U
  • Editas Medicine Inc.
  • Healius Ltd.
  • Illumina Inc.
  • International Business Machines Corp.
  • Mapmygenome India Ltd.
  • myDNA Life Ltd.
  • Myriad Genetics Inc.
  • NeoGenomics Laboratories Inc.
  • Quest Diagnostics Inc.
  • Sysmex Corp.
  • Veritas Genetics Inc.

Qualitative and quantitative analysis of companies has been conducted to help clients understand the wider business environment as well as the strengths and weaknesses of key market players. Data is qualitatively analyzed to categorize companies as pure play, category-focused, industry-focused, and diversified; it is quantitatively analyzed to categorize companies as dominant, leading, strong, tentative, and weak.

Market Segmentation

By Application 

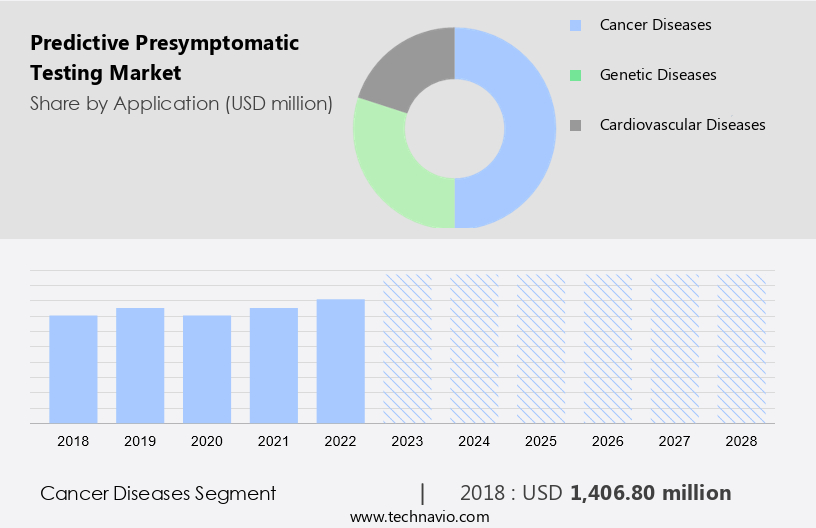
The cancer diseases segments is estimated to witness significant growth during the forecast period. Cancer is usually not considered a genetic disorder. However, certain types of cancers, such as breast, ovarian, prostate, and colorectal cancer, are strongly influenced by genes. These types of cancers are passed on to the next generation. Thus, predictive and presymptomatic testing is used for the diagnosis of hereditary-based cancers such as breast and ovarian cancer.

Predictive Presymptomatic Testing Market Size

Get a glance at the market share of various regions Download the PDF Sample

The cancer diseases segments accounted for USD 1.40 billion in 2018 and showed a gradual increase during the forecast period. Healthy female mutation carriers of BReast CAncer (BRCA) genes have a high risk of acquiring breast cancer and ovarian cancer. However, BRCA genes are not the only genes that are associated with breast and ovarian cancer. Various research studies have identified approximately more than 100 new gene variants which can be associated with an increased risk of cancer, such as breast, ovarian, and prostate cancer. These new gene variants only slightly increase the risk of cancer individually. However, a combination of these genes can increase the overall risk of developing cancer.

Regional Analysis

Predictive Presymptomatic Testing Market Share by Geography

For more insights on the market share of various regions Download PDF Sample now!

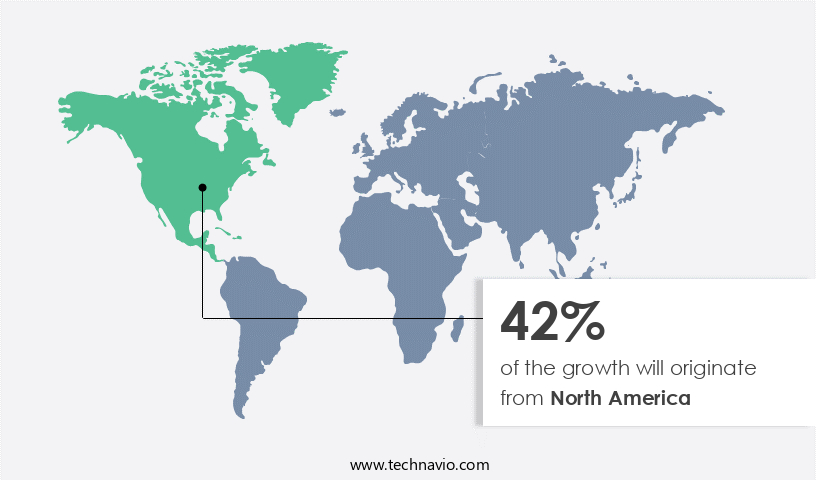
North America is estimated to contribute 42% to the growth of the global market during the forecast period. Technavio’s analysts have elaborately explained the regional trends and drivers that shape the market during the forecast period. North America accounts for the largest revenue share of the global predictive presymptomatic testing market. The US and Canada account for the highest market shares in the region. The presence of many vendors that offer predictive presymptomatic test kits in the US is a significant factor that drives the growth of the regional market. Furthermore, the high healthcare spending in the US and Canada and the presence of well-established healthcare infrastructure are also fueling the growth of the regional market to a great extent. The increasing prevalence of multiple types of cancer is driving the predictive presymptomatic testing market in the US. In the US, the prevalence of cancer has been increasing in recent years.

Segment Overview

The market research report provides comprehensive data (region-wise segment analysis), with forecasts and estimates in "USD billion " for the period 2024-2028, as well as historical data from 2018-2022 for the following segments.

  • Application Outlook
    • Cancer diseases
    • Genetic diseases
    • Cardiovascular diseases
  • Region Outlook
    • North America
      • The U.S.
      • Canada
    • Europe
      • U.K.
      • Germany
      • France
      • Rest of Europe
    • APAC
      • China
      • India
    • South America
      • Chile
      • Argentina
      • Brazil
    • Middle East & Africa
      • Saudi Arabia
      • South Africa
      • Rest of the Middle East & Africa

You may also interested in below market reports:

1. Predictive Analytics Market Analysis North America, Europe, APAC, South America, Middle East and Africa - US, China, Japan, Germany, UK - Size and Forecast

2. Predictive Maintenance (PdM) Market Analysis North America, Europe, APAC, South America, Middle East and Africa - US, Canada, China, UK, Germany - Size and Forecast

3. Industrial Predictive Maintenance Market in APAC in APAC by End-user, Deployment, and Geography - Forecast and Analysis

Market Analyst Overview

The integration of wearable technology continues to expand from devices worn on the neck like lanyards and necklaces, to those on the head, such as smart glasses and headphones. Innovations extend to shoes with embedded sensors for tracking fitness metrics, and bags equipped with charging ports for smartphones. This evolution enhances human-computer interaction by seamlessly integrating technology into everyday clothing and accessories like watches and eyeglasses, minimizing concerns over weight and bulkiness. Safety measures against fire hazards and heat are paramount, influencing the design of devices like calculator watches, portable radios, and body cameras used in military and policing applications. GPS technology aids in navigation for personal tasks and managing daily workloads, while augmented memory technology enhances VR and AR experiences. Sound shirts and vibrating bracelets cater to individuals needing portable translators for enhanced independence. Cameras in wearables ensure comprehensive security and efficient data capture in diverse settings.

Market Scope

Report Coverage

Details

Page number

136

Base year

2023

Historic period

2018-2022

Forecast period

2024-2028

Growth momentum & CAGR

Accelerate at a CAGR of 10.03%

Market growth 2024-2028

USD 2.59 billion

Market structure

Fragmented

YoY growth 2023-2024(%)

8.88

Regional analysis

North America, Europe, Asia, and Rest of World (ROW)

Performing market contribution

North America at 42%

Key countries

US, Germany, Japan, UK, and France

Competitive landscape

Leading Companies, Market Positioning of Companies, Competitive Strategies, and Industry Risks

Key companies profiled

23andMe Holding Co., Abbott Laboratories, Amgen Inc., BioAxis DNA Research Centre P Ltd., Color Health Inc., Deep Genomics Inc., Direct Laboratory Services LLC, DNA and U, Editas Medicine Inc., Healius Ltd., Illumina Inc., International Business Machines Corp., Mapmygenome India Ltd., myDNA Life Ltd., Myriad Genetics Inc., NeoGenomics Laboratories Inc., Quest Diagnostics Inc., Sysmex Corp., and Veritas Genetics Inc.

Market dynamics

Parent market analysis, Market forecasting growth inducers and obstacles, Fast-growing and slow-growing segment analysis, COVID-19 impact and recovery analysis and future consumer dynamics, Market condition analysis for forecast period

Customization purview

If our market report has not included the data that you are looking for, you can reach out to our analysts and get segments customized.

Download PDF Sample

What are the Key Data Covered in this Market Forecast Report?

  • CAGR of the market during the forecast period
  • Detailed information on factors that will drive the market growth and forecasting of the market between 2024 and 2028
  • Precise estimation of the market size and its contribution to the parent market
  • Accurate predictions about upcoming market trends and analysis and changes in consumer behavior
  • Growth of the market across Europe, North America, APAC, South America, and Middle East and Africa
  • Thorough market growth analysis of the market’s competitive landscape and detailed information about companies
  • Comprehensive market analysis and report on the factors that will challenge the market research and growth of market companies

1 Executive Summary

  • 1.1 Market overview
    • Executive Summary - Chart on Market Overview
    • Executive Summary - Data Table on Market Overview
    • Executive Summary - Chart on Global Market Characteristics
    • Executive Summary - Chart on Market by Geography
    • Executive Summary - Chart on Market Segmentation by Application
    • Executive Summary - Chart on Incremental Growth
    • Executive Summary - Data Table on Incremental Growth
    • Executive Summary - Chart on Company Market Positioning

2 Market Landscape

  • 2.1 Market ecosystem
    • Parent Market
    • Data Table on - Parent Market
  • 2.2 Market characteristics
    • Market characteristics analysis
  • 2.3 Value chain analysis
    • Value Chain Analysis

3 Market Sizing

  • 3.1 Market definition
    • Offerings of companies included in the market definition
  • 3.2 Market segment analysis
    • Market segments
  • 3.3 Market size 2023
    • 3.4 Market outlook: Forecast for 2023-2028
      • Chart on Global - Market size and forecast 2023-2028 ($ million)
      • Data Table on Global - Market size and forecast 2023-2028 ($ million)
      • Chart on Global Market: Year-over-year growth 2023-2028 (%)
      • Data Table on Global Market: Year-over-year growth 2023-2028 (%)

    4 Historic Market Size

    • 4.1 Global Predictive Presymptomatic Testing Market 2018 - 2022
      • Historic Market Size - Data Table on Global Predictive Presymptomatic Testing Market 2018 - 2022 ($ million)
    • 4.2 Application segment analysis 2018 - 2022
      • Historic Market Size - Application Segment 2018 - 2022 ($ million)
    • 4.3 Geography segment analysis 2018 - 2022
      • Historic Market Size - Geography Segment 2018 - 2022 ($ million)
    • 4.4 Country segment analysis 2018 - 2022
      • Historic Market Size - Country Segment 2018 - 2022 ($ million)

    5 Five Forces Analysis

    • 5.1 Five forces summary
      • Five forces analysis - Comparison between 2023 and 2028
    • 5.2 Bargaining power of buyers
      • Bargaining power of buyers - Impact of key factors 2023 and 2028
    • 5.3 Bargaining power of suppliers
      • Bargaining power of suppliers - Impact of key factors in 2023 and 2028
    • 5.4 Threat of new entrants
      • Threat of new entrants - Impact of key factors in 2023 and 2028
    • 5.5 Threat of substitutes
      • Threat of substitutes - Impact of key factors in 2023 and 2028
    • 5.6 Threat of rivalry
      • Threat of rivalry - Impact of key factors in 2023 and 2028
    • 5.7 Market condition
      • Chart on Market condition - Five forces 2023 and 2028

    6 Market Segmentation by Application

    • 6.1 Market segments
      • Chart on Application - Market share 2023-2028 (%)
      • Data Table on Application - Market share 2023-2028 (%)
    • 6.2 Comparison by Application
      • Chart on Comparison by Application
      • Data Table on Comparison by Application
    • 6.3 Cancer diseases - Market size and forecast 2023-2028
      • Chart on Cancer diseases - Market size and forecast 2023-2028 ($ million)
      • Data Table on Cancer diseases - Market size and forecast 2023-2028 ($ million)
      • Chart on Cancer diseases - Year-over-year growth 2023-2028 (%)
      • Data Table on Cancer diseases - Year-over-year growth 2023-2028 (%)
    • 6.4 Genetic diseases - Market size and forecast 2023-2028
      • Chart on Genetic diseases - Market size and forecast 2023-2028 ($ million)
      • Data Table on Genetic diseases - Market size and forecast 2023-2028 ($ million)
      • Chart on Genetic diseases - Year-over-year growth 2023-2028 (%)
      • Data Table on Genetic diseases - Year-over-year growth 2023-2028 (%)
    • 6.5 Cardiovascular diseases - Market size and forecast 2023-2028
      • Chart on Cardiovascular diseases - Market size and forecast 2023-2028 ($ million)
      • Data Table on Cardiovascular diseases - Market size and forecast 2023-2028 ($ million)
      • Chart on Cardiovascular diseases - Year-over-year growth 2023-2028 (%)
      • Data Table on Cardiovascular diseases - Year-over-year growth 2023-2028 (%)
    • 6.6 Market opportunity by Application
      • Market opportunity by Application ($ million)
      • Data Table on Market opportunity by Application ($ million)

    7 Customer Landscape

    • 7.1 Customer landscape overview
      • Analysis of price sensitivity, lifecycle, customer purchase basket, adoption rates, and purchase criteria

    8 Geographic Landscape

    • 8.1 Geographic segmentation
      • Chart on Market share by geography 2023-2028 (%)
      • Data Table on Market share by geography 2023-2028 (%)
    • 8.2 Geographic comparison
      • Chart on Geographic comparison
      • Data Table on Geographic comparison
    • 8.3 North America - Market size and forecast 2023-2028
      • Chart on North America - Market size and forecast 2023-2028 ($ million)
      • Data Table on North America - Market size and forecast 2023-2028 ($ million)
      • Chart on North America - Year-over-year growth 2023-2028 (%)
      • Data Table on North America - Year-over-year growth 2023-2028 (%)
    • 8.4 Europe - Market size and forecast 2023-2028
      • Chart on Europe - Market size and forecast 2023-2028 ($ million)
      • Data Table on Europe - Market size and forecast 2023-2028 ($ million)
      • Chart on Europe - Year-over-year growth 2023-2028 (%)
      • Data Table on Europe - Year-over-year growth 2023-2028 (%)
    • 8.5 Asia - Market size and forecast 2023-2028
      • Chart on Asia - Market size and forecast 2023-2028 ($ million)
      • Data Table on Asia - Market size and forecast 2023-2028 ($ million)
      • Chart on Asia - Year-over-year growth 2023-2028 (%)
      • Data Table on Asia - Year-over-year growth 2023-2028 (%)
    • 8.6 Rest of World (ROW) - Market size and forecast 2023-2028
      • Chart on Rest of World (ROW) - Market size and forecast 2023-2028 ($ million)
      • Data Table on Rest of World (ROW) - Market size and forecast 2023-2028 ($ million)
      • Chart on Rest of World (ROW) - Year-over-year growth 2023-2028 (%)
      • Data Table on Rest of World (ROW) - Year-over-year growth 2023-2028 (%)
    • 8.7 US - Market size and forecast 2023-2028
      • Chart on US - Market size and forecast 2023-2028 ($ million)
      • Data Table on US - Market size and forecast 2023-2028 ($ million)
      • Chart on US - Year-over-year growth 2023-2028 (%)
      • Data Table on US - Year-over-year growth 2023-2028 (%)
    • 8.8 Germany - Market size and forecast 2023-2028
      • Chart on Germany - Market size and forecast 2023-2028 ($ million)
      • Data Table on Germany - Market size and forecast 2023-2028 ($ million)
      • Chart on Germany - Year-over-year growth 2023-2028 (%)
      • Data Table on Germany - Year-over-year growth 2023-2028 (%)
    • 8.9 Japan - Market size and forecast 2023-2028
      • Chart on Japan - Market size and forecast 2023-2028 ($ million)
      • Data Table on Japan - Market size and forecast 2023-2028 ($ million)
      • Chart on Japan - Year-over-year growth 2023-2028 (%)
      • Data Table on Japan - Year-over-year growth 2023-2028 (%)
    • 8.10 UK - Market size and forecast 2023-2028
      • Chart on UK - Market size and forecast 2023-2028 ($ million)
      • Data Table on UK - Market size and forecast 2023-2028 ($ million)
      • Chart on UK - Year-over-year growth 2023-2028 (%)
      • Data Table on UK - Year-over-year growth 2023-2028 (%)
    • 8.11 France - Market size and forecast 2023-2028
      • Chart on France - Market size and forecast 2023-2028 ($ million)
      • Data Table on France - Market size and forecast 2023-2028 ($ million)
      • Chart on France - Year-over-year growth 2023-2028 (%)
      • Data Table on France - Year-over-year growth 2023-2028 (%)
    • 8.12 Market opportunity by geography
      • Market opportunity by geography ($ million)
      • Data Tables on Market opportunity by geography ($ million)

    9 Drivers, Challenges, and Opportunity/Restraints

    • 9.1 Market drivers
      • 9.2 Market challenges
        • 9.3 Impact of drivers and challenges
          • Impact of drivers and challenges in 2023 and 2028
        • 9.4 Market opportunities/restraints

          10 Competitive Landscape

          • 10.1 Overview
            • 10.2 Competitive Landscape
              • Overview on criticality of inputs and factors of differentiation
            • 10.3 Landscape disruption
              • Overview on factors of disruption
            • 10.4 Industry risks
              • Impact of key risks on business

            11 Competitive Analysis

            • 11.1 Companies profiled
              • Companies covered
            • 11.2 Market positioning of companies
              • Matrix on companies position and classification
            • 23andMe Holding Co.
              • 23andMe Holding Co. - Overview
              • 23andMe Holding Co. - Business segments
              • 23andMe Holding Co. - Key offerings
              • 23andMe Holding Co. - Segment focus
            • 11.4 Abbott Laboratories
              • Abbott Laboratories - Overview
              • Abbott Laboratories - Business segments
              • Abbott Laboratories - Key news
              • Abbott Laboratories - Key offerings
              • Abbott Laboratories - Segment focus
            • 11.5 Color Health Inc.
              • Color Health Inc. - Overview
              • Color Health Inc. - Product / Service
              • Color Health Inc. - Key offerings
            • 11.6 Direct Laboratory Services LLC
              • Direct Laboratory Services LLC - Overview
              • Direct Laboratory Services LLC - Product / Service
              • Direct Laboratory Services LLC - Key offerings
            • 11.7 Healius Ltd.
              • Healius Ltd. - Overview
              • Healius Ltd. - Product / Service
              • Healius Ltd. - Key offerings
            • 11.8 Mapmygenome India Ltd.
              • Mapmygenome India Ltd. - Overview
              • Mapmygenome India Ltd. - Product / Service
              • Mapmygenome India Ltd. - Key offerings
            • 11.9 myDNA Life Ltd.
              • myDNA Life Ltd. - Overview
              • myDNA Life Ltd. - Product / Service
              • myDNA Life Ltd. - Key offerings
            • 11.10 Myriad Genetics Inc.
              • Myriad Genetics Inc. - Overview
              • Myriad Genetics Inc. - Product / Service
              • Myriad Genetics Inc. - Key news
              • Myriad Genetics Inc. - Key offerings
            • 11.11 Quest Diagnostics Inc.
              • Quest Diagnostics Inc. - Overview
              • Quest Diagnostics Inc. - Business segments
              • Quest Diagnostics Inc. - Key offerings
              • Quest Diagnostics Inc. - Segment focus
            • 11.12 Sysmex Corp.
              • Sysmex Corp. - Overview
              • Sysmex Corp. - Business segments
              • Sysmex Corp. - Key offerings
              • Sysmex Corp. - Segment focus

            12 Appendix

            • 12.1 Scope of the report
              • 12.2 Inclusions and exclusions checklist
                • Inclusions checklist
                • Exclusions checklist
              • 12.3 Currency conversion rates for US$
                • Currency conversion rates for US$
              • 12.4 Research methodology
                • Research methodology
              • 12.5 Data procurement
                • Information sources
              • 12.6 Data validation
                • Data validation
              • 12.7 Validation techniques employed for market sizing
                • Validation techniques employed for market sizing
              • 12.8 Data synthesis
                • Data synthesis
              • 12.9 360 degree market analysis
                • 360 degree market analysis
              • 12.10 List of abbreviations
                • List of abbreviations

              Research Methodology

              Technavio presents a detailed picture of the market by way of study, synthesis, and summation of data from multiple sources. The analysts have presented the various facets of the market with a particular focus on identifying the key industry influencers. The data thus presented is comprehensive, reliable, and the result of extensive research, both primary and secondary.

              INFORMATION SOURCES

              Primary sources

              • Manufacturers and suppliers
              • Channel partners
              • Industry experts
              • Strategic decision makers

              Secondary sources

              • Industry journals and periodicals
              • Government data
              • Financial reports of key industry players
              • Historical data
              • Press releases

              DATA ANALYSIS

              Data Synthesis

              • Collation of data
              • Estimation of key figures
              • Analysis of derived insights

              Data Validation

              • Triangulation with data models
              • Reference against proprietary databases
              • Corroboration with industry experts

              REPORT WRITING

              Qualitative

              • Market drivers
              • Market challenges
              • Market trends
              • Five forces analysis

              Quantitative

              • Market size and forecast
              • Market segmentation
              • Geographical insights
              • Competitive landscape

              Interested in this report?

              Get your sample now to see our research methodology and insights!

              Download Now

              Frequently Asked Questions

              Predictive Presymptomatic Testing market growth will increase by $ 2594.7 mn during 2024-2028 .

              The Predictive Presymptomatic Testing market is expected to grow at a CAGR of 10.03% during 2024-2028 .

              Predictive Presymptomatic Testing market is segmented by Application( Cancer diseases, Genetic diseases, Cardiovascular diseases)

              23andMe Holding Co., Abbott Laboratories, Amgen Inc., BioAxis DNA Research Centre P Ltd., Color Health Inc., Deep Genomics Inc., Direct Laboratory Services LLC, DNA and U, Editas Medicine Inc., Healius Ltd., Illumina Inc., International Business Machines Corp., Mapmygenome India Ltd., myDNA Life Ltd., Myriad Genetics Inc., NeoGenomics Laboratories Inc., Quest Diagnostics Inc., Sysmex Corp., Veritas Genetics Inc. are a few of the key vendors in the Predictive Presymptomatic Testing market.

              North America will register the highest growth rate of 42% among the other regions. Therefore, the Predictive Presymptomatic Testing market in North America is expected to garner significant business opportunities for the vendors during the forecast period.

              US, Germany, Japan, UK, France

              • Increasing healthcare spending worldwideThe governments of developed nations such as the US is the driving factor this market.
              • Germany is the driving factor this market.
              • France is the driving factor this market.
              • Sweden is the driving factor this market.
              • and others have increased their healthcare expenditure in recent years. Through the support of the governments and a surge in healthcare expenditures is the driving factor this market.
              • the global private and public healthcare facilities and not-for-profit organizations (NPOs) are able to provide their services to the patients. According to The World Health Organization (WHO) is the driving factor this market.
              • global spending on healthcare continually rose between 2000 and 2018 and reached $ 8.3 trillion or 10% of global GDP. In 2020 is the driving factor this market.
              • the US spent 19.7% of its GDP on healthcare expenditure. Other European nations such as Germany is the driving factor this market.
              • France is the driving factor this market.
              • Sweden is the driving factor this market.
              • and Austria spent 11.43% is the driving factor this market.
              • 11.26% is the driving factor this market.
              • 10.90% is the driving factor this market.
              • and 10.33% is the driving factor this market.
              • respectively is the driving factor this market.
              • of their GDP on healthcare expenditure. In 2020 is the driving factor this market.
              • the healthcare expenditure in the US increased by 9.7% is the driving factor this market.
              • reaching $4.1 trillion or $12 is the driving factor this market.
              • 530 per person. The US healthcare sector is the leading healthcare sector globally. Due to these factors is the driving factor this market.
              • there is a high demand for predictive presymptomatic test kits in the country. The increasing expenditure in the global healthcare sector and the increase in government aid to healthcare providers will boost the growth of the global predictive presymptomatic testing market during the forecast period. is the driving factor this market.

              The Predictive Presymptomatic Testing market vendors should focus on grabbing business opportunities from the Cancer diseases segment as it accounted for the largest market share in the base year.