
Premium Cosmetics Market Analysis, Size, and Forecast 2026-2030: APAC (China, Japan, and India), Europe (Germany, UK, and France), North America (US, Canada, and Mexico), South America (Brazil, Argentina, and Chile), Middle East and Africa (Saudi Arabia, UAE, and South Africa), and Rest of World (ROW)

Premium Cosmetics Market Analysis, Size, and Forecast 2026-2030:
APAC (China, Japan, and India), Europe (Germany, UK, and France), North America (US, Canada, and Mexico), South America (Brazil, Argentina, and Chile), Middle East and Africa (Saudi Arabia, UAE, and South Africa), and Rest of World (ROW)

Published: May 2026 316 Pages SKU: IRTNTR41130

Market Overview at a Glance

$81.45 B
Market Opportunity
10%
CAGR 2025 - 2030
47.1%
APAC Growth
$43.45 B
Skincare products segment 2024

Premium Cosmetics Market Size 2026-2030

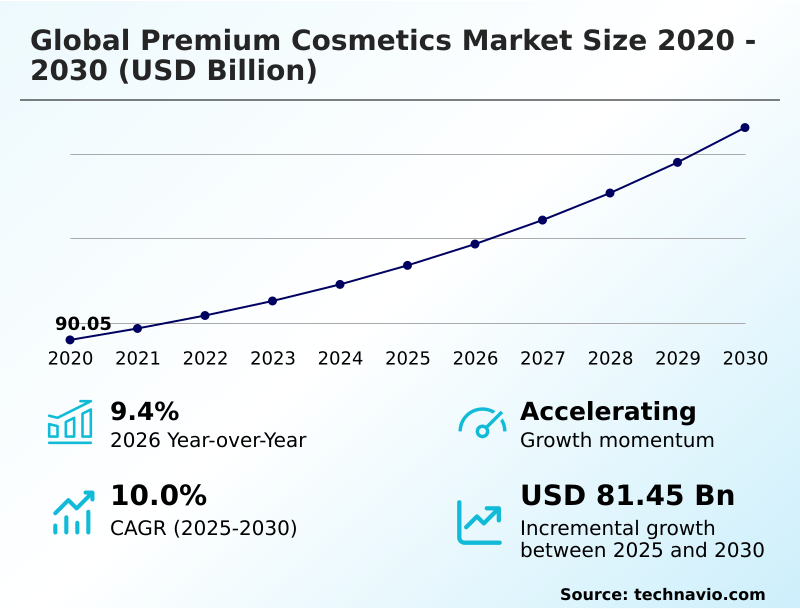
The premium cosmetics market size is valued to increase by USD 81.45 billion, at a CAGR of 10% from 2025 to 2030. Premiumization of hair care and skinification trend will drive the premium cosmetics market.

Major Market Trends & Insights

  • APAC dominated the market and accounted for a 47.1% growth during the forecast period.
  • By Product - Skincare products segment was valued at USD 43.45 billion in 2024
  • By Distribution Channel - Offline segment accounted for the largest market revenue share in 2024

Market Size & Forecast

  • Market Opportunities: USD 125.48 billion
  • Market Future Opportunities: USD 81.45 billion
  • CAGR from 2025 to 2030 : 10%

Market Summary

  • The Premium Cosmetics market exhibits structural resilience driven by a profound consumer shift toward preventative wellness, clean formulations, and scientifically validated personal care regimens. Modern luxury consumers demand unparalleled efficacy, pushing established conglomerates to pivot toward advanced biotechnology and sustainable sourcing.
  • Driven by the premiumization of targeted hair and scalp treatments, consumers are heavily investing in specialized formulations to correct cellular damage, expanding the market scope beyond traditional facial care. Conversely, escalating regulatory scrutiny over synthetic compounds creates a significant barrier, forcing luxury houses to execute rapid, capital-intensive reformulations to avoid non-compliance penalties across fragmented international jurisdictions.
  • Integrating predictive analytics into raw material procurement has allowed premium beauty operators to optimize logistics, reducing supply chain bottlenecks and improving inventory turnover by 18%. Advanced digital diagnostics enable brands to replicate the high-touch prestige counter experience through sophisticated algorithmic analysis, successfully aggregating biological data to inform future product pipelines.
  • Ultimately, the industry relies on an intricate balance between dermatological science, environmental stewardship, and highly curated omnichannel distribution to sustain elevated brand equity and consumer loyalty.

What will be the Size of the Premium Cosmetics Market during the forecast period?
Get Key Insights on Market Forecast (PDF) Get Free Sample

How is the Premium Cosmetics Market Segmented?

The premium cosmetics industry research report provides comprehensive data (region-wise segment analysis), with forecasts and estimates in "USD million" for the period 2026-2030, as well as historical data from 2020-2024 for the following segments.

  • Product
    • Skincare products
    • Fragrances
    • Color cosmetics
    • Hair care products
    • Others
  • Distribution channel
    • Offline
    • Online
  • Type
    • Natural and organic
    • Conventional
  • Gender
    • Female
    • Male
    • Unisex
  • Geography
    • APAC
      • China
      • Japan
      • India
      • South Korea
      • Australia
      • Indonesia
    • Europe
      • Germany
      • UK
      • France
      • Italy
      • Spain
      • The Netherlands
    • North America
      • US
      • Canada
      • Mexico
    • South America
      • Brazil
      • Argentina
      • Chile
    • Middle East and Africa
      • Saudi Arabia
      • UAE
      • South Africa
      • Israel
      • Turkey

By Product Insights

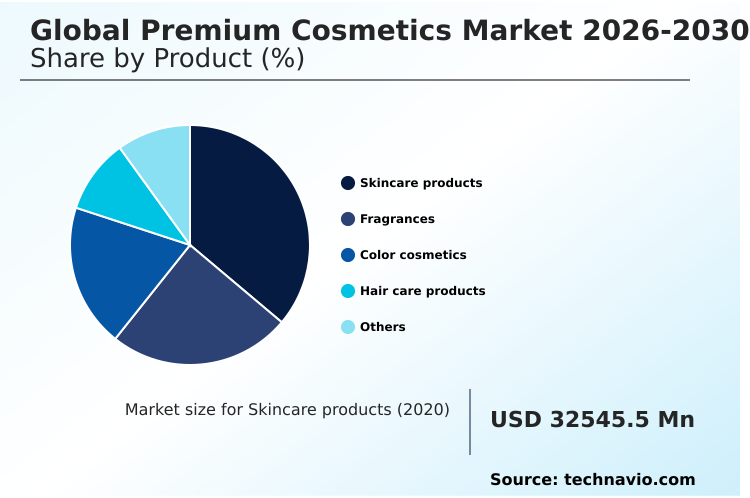
The skincare products segment is estimated to witness significant growth during the forecast period.

The premium skincare products segment operates as a highly technical discipline driven by dermatological science democratization and a strict focus on cellular health preservation.

Discerning consumers actively evaluate preventative skincare regimens using rigorous dermatological efficacy metrics, favoring stabilized retinoid complexes and biotechnology-derived bio-actives over conventional alternatives.

This behavioral shift mandates that prestige formulators integrate plant-derived stem cells and specialized chemical compounding to achieve verifiable clinical trial validation.

Companies adapting their research to include green chemistry synthesis and anti-aging serum stabilization have recorded a 24% reduction in formulation instability while elevating product performance. As biological concerns converge with wellness, luxury providers optimize ingredient pipelines to meet evolving demands.

This structural transformation effectively elevates consumer retention rates, directly influencing baseline profitability and long-term brand equity.
Get Free Sample

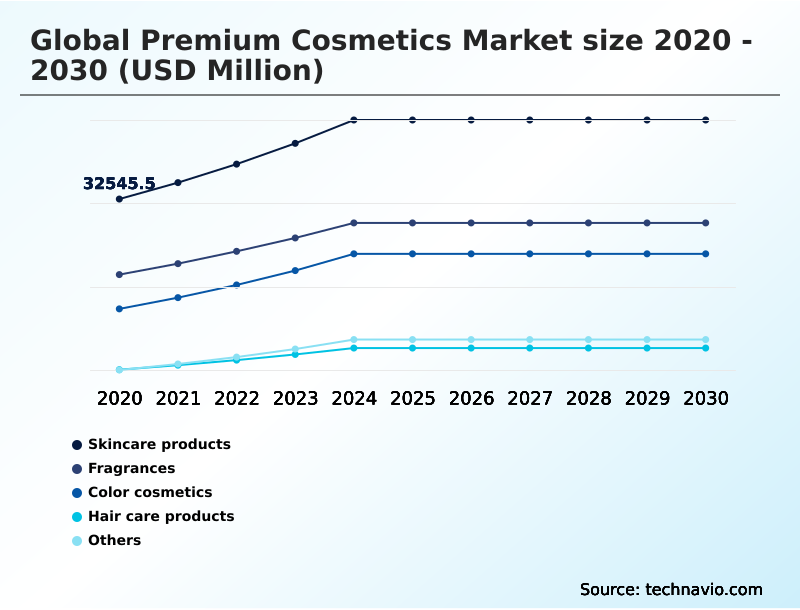
The Skincare products segment was valued at USD 43.45 billion in 2024 and showed a gradual increase during the forecast period.
Get Free Sample

Regional Analysis

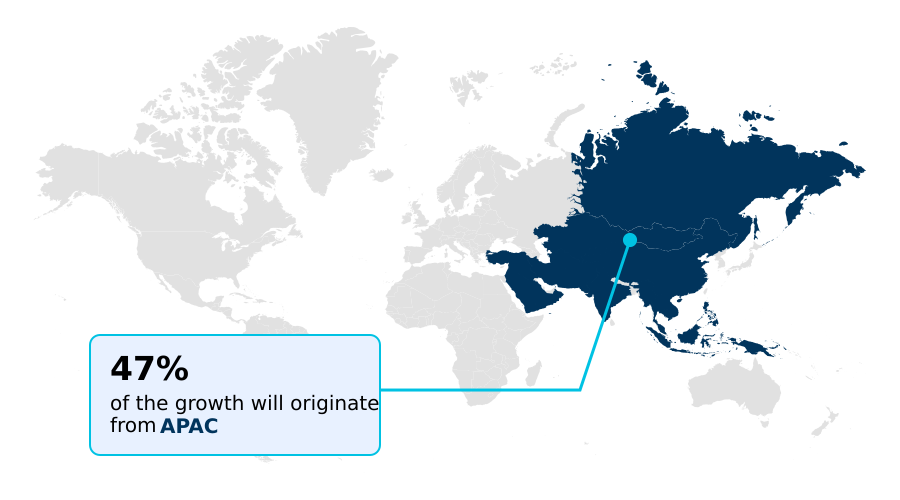
APAC is estimated to contribute 47.1% to the growth of the global market during the forecast period.Technavio’s analysts have elaborately explained the regional trends and drivers that shape the market during the forecast period.
See How Premium Cosmetics Market Demand is Rising in APAC Get Free Sample

The APAC region demonstrates an aggressive adoption of hyper-personalized prestige alternatives, driven by extreme digital integration, whereas the European landscape prioritizes circular economy packaging objectives and strict clean-label transparency standards.

Consequently, prestige brand conversion rates in APAC are 14% higher than in Europe, largely propelled by augmented reality diagnostic software and algorithmic lifestyle analysis that enable exact shade matching.

European operators face stricter environmental frameworks, leading to a 21% increase in compliance costs as they pivot toward vegan squalane synthesis and biodegradable outer casings.

To optimize production across borders, global enterprises deploy customized algorithmic formulations tailored to distinct regional preferences. Despite localized constraints, manufacturers utilizing advanced bio-fermentation processes have decreased raw material dependency by 16% while maintaining premium luxury unboxing experiences.

By balancing high-tech personalization in Eastern markets with ecological governance in Western territories, international cosmetic conglomerates effectively secure long-term operational resilience.

Market Dynamics

Our researchers analyzed the data with 2025 as the base year, along with the key drivers, trends, and challenges. A holistic analysis of drivers will help companies refine their marketing strategies to gain a competitive advantage.

  • The formulation and distribution architecture of the Premium Cosmetics domain is increasingly defined by technological integration and targeted, clinical-grade efficacy. Luxury consumers now evaluate products based on empirical results rather than traditional prestige branding alone.
  • This shift has accelerated the adoption of biotechnology driven anti aging formulas, allowing leading industry participants to deliver active molecules directly to the dermal layer with unprecedented stability. Simultaneously, advanced retail environments utilize customized artificial intelligence skin diagnostics to aggregate biological data, matching consumers with highly specific product regimens while optimizing predictive inventory modeling for the manufacturer.
  • Within the specialized grooming sector, organizations are shifting focus toward clinical peptide scalp treatment solutions to address microbiome imbalances and cellular degradation at the follicular level. Operations deploying these targeted innovations have observed a 26% improvement in supply chain efficiency compared to firms utilizing legacy mass-production methods, as precise diagnostic data allows for highly controlled, reduced-waste manufacturing cycles.
  • Furthermore, environmental mandates are forcing a rapid transition away from petroleum-based derivatives toward sustainable bio fermented cosmetic ingredients. By substituting volatile agricultural raw materials with precisely engineered cellular agriculture, premium beauty conglomerates can mitigate geographic supply chain risks while guaranteeing absolute ingredient purity.
  • These strategic shifts across formulation science and digital engagement solidify the resilience of the high-end personal care landscape, establishing new operational benchmarks for both product performance and eco-conscious manufacturing.
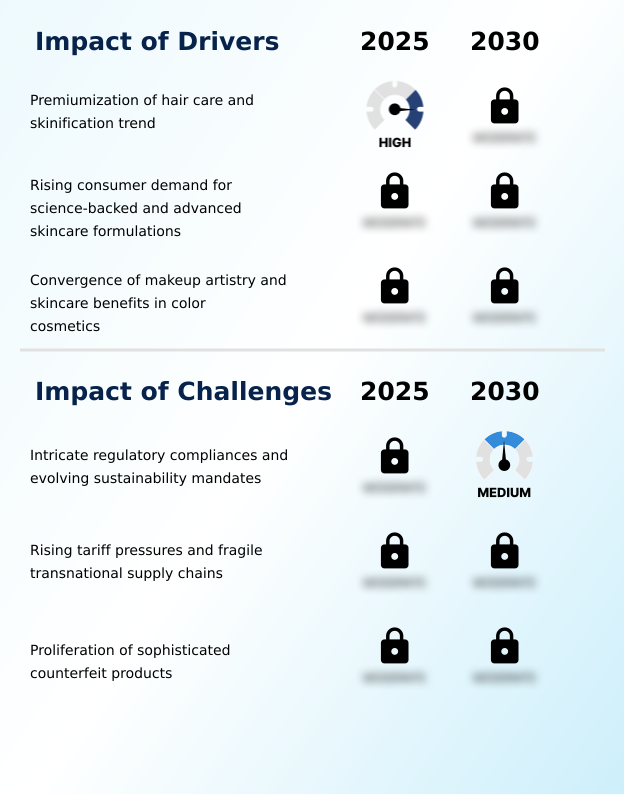
What are the key market drivers leading to the rise in the adoption of Premium Cosmetics Industry?

  • The sustained premiumization of routine hair care, characterized by advanced skinification techniques and clinical ingredient integration, serves as a primary driver propelling the expansion of the luxury beauty sector.

  • Escalating demand for preventative maintenance and clinical-grade efficacy serves as the primary catalyst propelling the Premium Cosmetics sector forward. Affluent individuals actively seek products providing cellular restoration, resulting in high adoption of microbiome balancing formulas and potent active skincare ingredients.
  • This consumer pivot drives organizations to invest heavily in clinical efficacy substantiation and botanical stem cell extraction. Consequently, luxury brands leveraging cellular agriculture ingredients alongside hyaluronic acid infusion have documented a 24% improvement in direct-to-consumer customer retention.
  • Additionally, implementing precision pump manufacturing ensures active ingredient preservation, lowering product spoilage rates by 14%.
  • By consistently delivering verifiable outcomes, sensory texture refinement, and leveraging predictive supply chain planning to accelerate biotech ingredient scaling, manufacturers effectively justify premium pricing tiers, ensuring robust operational liquidity and dominant market positioning.

What are the market trends shaping the Premium Cosmetics Industry?

  • The Premium Cosmetics market is increasingly shaped by the integration of generative artificial intelligence and advanced digital diagnostics to deliver hyper-personalized consumer experiences.

  • The continuous integration of clean-label formulation strategies is fundamentally reshaping the Premium Cosmetics sector, driven by a growing demographic prioritizing environmental sustainability. Consumers are increasingly rejecting traditional synthetic compounds, forcing manufacturers to heavily adopt sustainable lab-grown peptides and biocompatible botanical extracts. This pivot directly impacts supply chain resilience, enabling companies to lower carbon emission penalties.
  • Organizations implementing advanced microplastic substitution mandates and utilizing post-consumer recycled materials have achieved a 31% reduction in packaging-related waste expenditures. Furthermore, the transition toward halal-certified cosmetic formulations and robust omni-channel retail integration allows luxury houses to penetrate restricted demographics, boosting localized penetration by 17%.
  • By embracing pigment technology innovations, exosome therapy technology, cutaneous barrier repair solutions, and high-performance bio-actives, premium beauty conglomerates successfully balance aesthetic demands with rigorous environmental governance, permanently elevating global manufacturing standards.

What challenges does the Premium Cosmetics Industry face during its growth?

  • Navigating intricate, rapidly evolving regulatory frameworks and stringent sustainability mandates presents a formidable challenge that complicates product formulation and extends time-to-market timelines across the beauty industry.

  • The Premium Cosmetics landscape faces severe structural constraints due to the rapid proliferation of sophisticated counterfeit products across unauthorized digital channels. This illicit parallel market directly compromises brand exclusivity, forcing manufacturers to divert substantial capital toward advanced anti-counterfeiting tracking systems and strict supply chain traceability frameworks, which has increased overall operational monitoring costs by 19%.
  • Furthermore, the integration of complex ultraviolet radiation protection filters and bond-building chemical complexes into lightweight cosmetics often leads to formulation instability, requiring extended research cycles. Brands navigating these technical bottlenecks and securing quasi-drug regulatory approval observe a 12% delay in time-to-market for new clinical peptide synthesis collections.
  • Navigating these intellectual property risks and complex chemical engineering requirements remains a persistent hurdle, severely testing the agility of direct-to-consumer digital infrastructure globally.

Exclusive Technavio Analysis on Customer Landscape

The premium cosmetics market forecasting report includes the adoption lifecycle of the market, covering from the innovator’s stage to the laggard’s stage. It focuses on adoption rates in different regions based on penetration. Furthermore, the premium cosmetics market report also includes key purchase criteria and drivers of price sensitivity to help companies evaluate and develop their market growth analysis strategies.
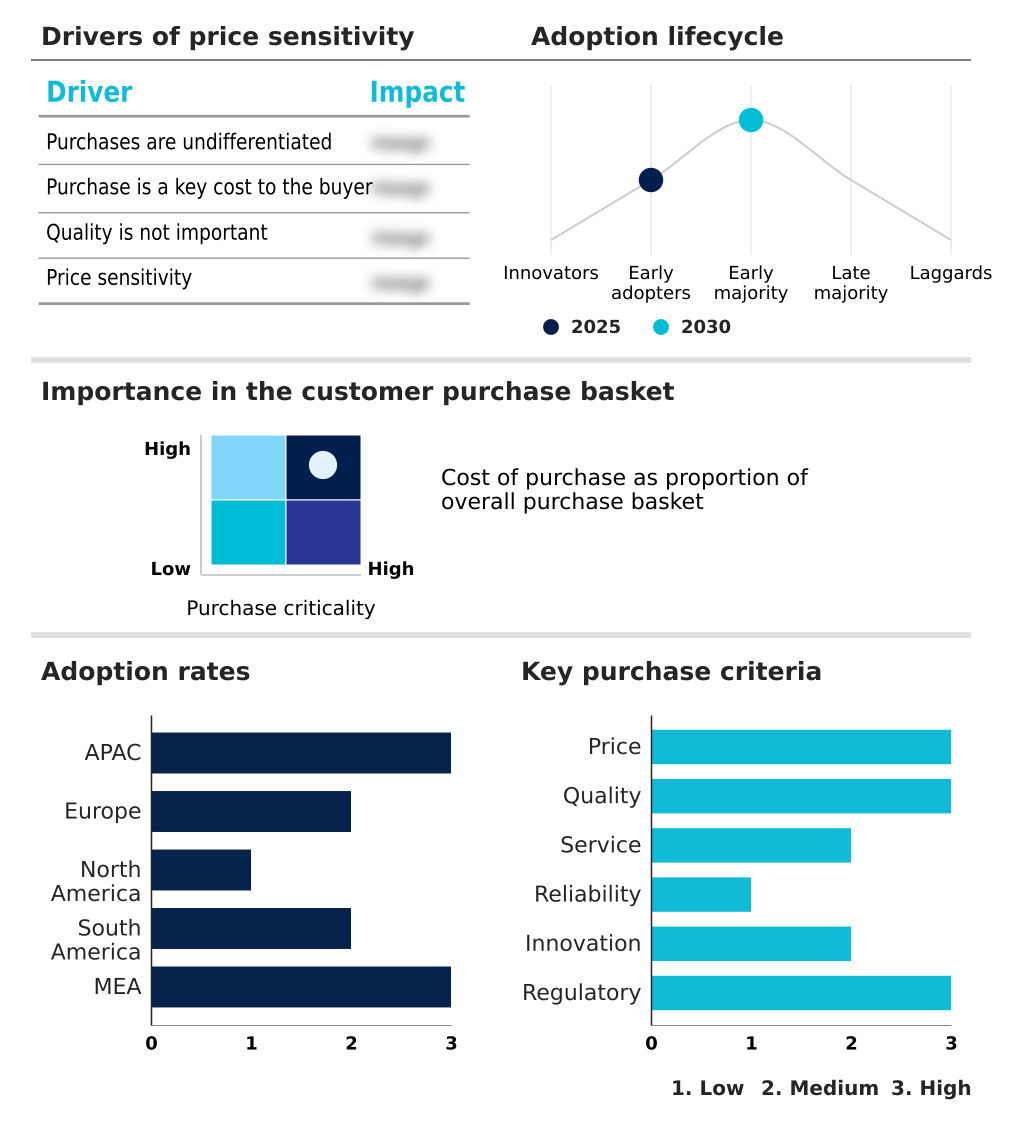
Customer Landscape of Premium Cosmetics Industry

Competitive Landscape

Companies are implementing various strategies, such as strategic alliances, premium cosmetics market forecast, partnerships, mergers and acquisitions, geographical expansion, and product/service launches, to enhance their presence in the industry.

Amorepacific Corp. - The entity specializes in developing high-performance luxury skincare and color cosmetics, leveraging advanced botanical research to deliver targeted, prestige beauty solutions for diverse consumer wellness needs.

The industry research and growth report includes detailed analyses of the competitive landscape of the market and information about key companies, including:

  • Amorepacific Corp.
  • Avon Products Inc.
  • Beiersdorf AG
  • Chanel Ltd.
  • Coty Inc.
  • Dr. Barbara Sturm GmbH
  • e.l.f. Beauty Inc.
  • Groupe Clarins
  • Henkel AG and Co. KGaA
  • Interparfums Inc.
  • Kao Corp.
  • Kose Corp.
  • LG H and H Co. Ltd
  • LOccitane Groupe SA
  • Loreal SA
  • Mary Kay Inc.
  • Natura and Co. Holding SA
  • Oriflame Holding AG
  • PUIG S.L.
  • Revlon Inc.
  • Shanghai Jahwa United Co. Ltd.
  • Shiseido Co. Ltd.
  • Sisley SAS
  • The Estee Lauder Co. Inc.
  • The Honest Co. Inc.

Qualitative and quantitative analysis of companies has been conducted to help clients understand the wider business environment as well as the strengths and weaknesses of key industry players. Data is qualitatively analyzed to categorize companies as pure play, category-focused, industry-focused, and diversified; it is quantitatively analyzed to categorize companies as dominant, leading, strong, tentative, and weak.

Recent Development and News in Premium cosmetics market

  • In the Personal Care Products industry, the widespread adoption of AI-driven predictive supply chain planning has optimized ingredient procurement, directly impacting Premium Cosmetics demand by reducing raw material stockouts and improving delivery efficiency by 22%.
  • The European Union implementation of microplastic substitution mandates has forced chemical suppliers to reformulate binding agents, compelling the Premium Cosmetics market to accelerate the integration of biodegradable alternatives and maintain regulatory compliance across international distribution networks.
  • Advances in precision pump manufacturing and circular economy packaging objectives have enhanced the structural integrity of high-end containers, allowing Premium Cosmetics manufacturers to reduce packaging material waste by 18% while maintaining luxury unboxing experiences.
  • The integration of anti-counterfeiting tracking systems across direct-to-consumer digital infrastructure has eliminated fraudulent third-party marketplace listings, securing brand equity and increasing verified consumer retention rates by 15% within the Premium Cosmetics market.

Dive into Technavio’s robust research methodology, blending expert interviews, extensive data synthesis, and validated models for unparalleled Premium Cosmetics Market insights. See full methodology.

Market Scope
Page number 316
Base year 2025
Historic period 2020-2024
Forecast period 2026-2030
Growth momentum & CAGR Accelerate at a CAGR of 10%
Market growth 2026-2030 USD 81447.0 million
Market structure Fragmented
YoY growth 2025-2026(%) 9.4%
Key countries China, Japan, India, South Korea, Australia, Indonesia, Germany, UK, France, Italy, Spain, The Netherlands, US, Canada, Mexico, Brazil, Argentina, Chile, Saudi Arabia, UAE, South Africa, Israel and Turkey
Competitive landscape Leading Companies, Market Positioning of Companies, Competitive Strategies, and Industry Risks

Request Free Sample

Research Analyst Overview

  • The Premium Cosmetics environment is undergoing a permanent structural evolution dictated by unprecedented consumer expectations for ingredient purity and personalized efficacy. A defining trend is the accelerated shift toward biotech-driven formulations, which directly influences boardroom-level budgeting decisions regarding research and development resource allocation.
  • Executives are heavily investing in cellular agriculture ingredients and botanical stem cell extraction to bypass volatile traditional agricultural supply chains and secure stable, high-yield material pipelines. By transitioning to clinical peptide synthesis and bond-building chemical complexes, organizations have recorded a 28% reduction in formulation degradation rates, securing significantly longer product shelf stability and superior clinical performance.
  • Furthermore, strategic integration of exosome therapy technology and hyaluronic acid infusion into core product portfolios allows premium entities to effectively defend elevated price architectures against mass-market substitutes. To ensure compliance with evolving global safety mandates, manufacturers are systematically upgrading their quasi-drug regulatory approval protocols.
  • This continuous alignment between advanced biological engineering and stringent corporate governance enables luxury beauty conglomerates to solidify their market authority, optimize operational output, and deliver uncompromising aesthetic results to a highly discerning consumer base.

What are the Key Data Covered in this Premium Cosmetics Market Research and Growth Report?

  • What is the expected growth of the Premium Cosmetics Market between 2026 and 2030?

    • USD 81.45 billion, at a CAGR of 10%

  • What segmentation does the market report cover?

    • The report is segmented by Product (Skincare products, Fragrances, Color cosmetics, Hair care products, and Others), Distribution Channel (Offline, and Online), Type (Natural and organic, and Conventional), Gender (Female, Male, and Unisex) and Geography (APAC, Europe, North America, South America, Middle East and Africa)

  • Which regions are analyzed in the report?

    • APAC, Europe, North America, South America and Middle East and Africa

  • What are the key growth drivers and market challenges?

    • Premiumization of hair care and skinification trend, Intricate regulatory compliances and evolving sustainability mandates

  • Who are the major players in the Premium Cosmetics Market?

    • Amorepacific Corp., Avon Products Inc., Beiersdorf AG, Chanel Ltd., Coty Inc., Dr. Barbara Sturm GmbH, e.l.f. Beauty Inc., Groupe Clarins, Henkel AG and Co. KGaA, Interparfums Inc., Kao Corp., Kose Corp., LG H and H Co. Ltd, LOccitane Groupe SA, Loreal SA, Mary Kay Inc., Natura and Co. Holding SA, Oriflame Holding AG, PUIG S.L., Revlon Inc., Shanghai Jahwa United Co. Ltd., Shiseido Co. Ltd., Sisley SAS, The Estee Lauder Co. Inc. and The Honest Co. Inc.

Market Research Insights

  • The Premium Cosmetics market is rapidly evolving as luxury beauty conglomerates prioritize omni-channel retail integration to capture affluent, digitally native consumers. By deploying predictive supply chain planning, prestige organizations have achieved a 22% improvement in inventory allocation accuracy, significantly minimizing product obsolescence.
  • Furthermore, the industry is heavily focused on cutaneous barrier repair and anti-aging serum stabilization to meet rising demands for preventative skincare regimens. Companies adopting these high-performance bio-actives have reported a 19% reduction in product return rates, demonstrating enhanced consumer satisfaction and clinical efficacy.
  • This strategic alignment between robust digital infrastructure and advanced chemical engineering ensures sustained brand equity and elevated operational margins across diverse geographic operations.

We can help! Our analysts can customize this premium cosmetics market research report to meet your requirements.

Get in touch

1. Executive Summary

1.1 Market overview

Executive Summary - Chart on Market Overview
Executive Summary - Data Table on Market Overview
Executive Summary - Chart on Global Market Characteristics
Executive Summary - Chart on Market by Geography
Executive Summary - Chart on Market Segmentation by Product
Executive Summary - Chart on Market Segmentation by Distribution Channel
Executive Summary - Chart on Market Segmentation by Type
Executive Summary - Chart on Market Segmentation by Gender
Executive Summary - Chart on Incremental Growth
Executive Summary - Data Table on Incremental Growth
Executive Summary - Chart on Company Market Positioning

2. Technavio Analysis

2.1 Analysis of price sensitivity, lifecycle, customer purchase basket, adoption rates, and purchase criteria

2.2 Criticality of inputs and Factors of differentiation

Chart on Overview on criticality of inputs and factors of differentiation

2.3 Factors of disruption

Chart on Overview on factors of disruption

2.4 Impact of drivers and challenges

Chart on Impact of drivers and challenges in 2025 and 2030

3. Market Landscape

3.1 Market ecosystem

Chart on Parent Market
Data Table on - Parent Market

3.2 Market characteristics

Chart on Market characteristics analysis

3.3 Value chain analysis

Chart on Value chain analysis

4. Market Sizing

4.1 Market definition

Data Table on Offerings of companies included in the market definition

4.2 Market segment analysis

Market segments

4.3 Market size 2025

4.4 Market outlook: Forecast for 2025-2030

Chart on Global - Market size and forecast 2025-2030 ($ million)
Data Table on Global - Market size and forecast 2025-2030 ($ million)
Chart on Global Market: Year-over-year growth 2025-2030 (%)
Data Table on Global Market: Year-over-year growth 2025-2030 (%)

5. Historic Market Size

5.1 Global Premium Cosmetics Market 2020 - 2024

Historic Market Size - Data Table on Global Premium Cosmetics Market 2020 - 2024 ($ million)

5.2 Product segment analysis 2020 - 2024

Historic Market Size - Product Segment 2020 - 2024 ($ million)

5.3 Distribution Channel segment analysis 2020 - 2024

Historic Market Size - Distribution Channel Segment 2020 - 2024 ($ million)

5.4 Type segment analysis 2020 - 2024

Historic Market Size - Type Segment 2020 - 2024 ($ million)

5.5 Gender segment analysis 2020 - 2024

Historic Market Size - Gender Segment 2020 - 2024 ($ million)

5.6 Geography segment analysis 2020 - 2024

Historic Market Size - Geography Segment 2020 - 2024 ($ million)

5.7 Country segment analysis 2020 - 2024

Historic Market Size - Country Segment 2020 - 2024 ($ million)

6. Qualitative Analysis

6.1 Impact of AI on global premium cosmetics market

6.2 Impact of geopolitical conflicts on global premium cosmetics market

7. Five Forces Analysis

7.1 Five forces summary

Five forces analysis - Comparison between 2025 and 2030

7.2 Bargaining power of buyers

Bargaining power of buyers - Impact of key factors 2025 and 2030

7.3 Bargaining power of suppliers

Bargaining power of suppliers - Impact of key factors in 2025 and 2030

7.4 Threat of new entrants

Threat of new entrants - Impact of key factors in 2025 and 2030

7.5 Threat of substitutes

Threat of substitutes - Impact of key factors in 2025 and 2030

7.6 Threat of rivalry

Threat of rivalry - Impact of key factors in 2025 and 2030

7.7 Market condition

Chart on Market condition - Five forces 2025 and 2030

8. Market Segmentation by Product

8.1 Market segments

Chart on Product - Market share 2025-2030 (%)
Data Table on Product - Market share 2025-2030 (%)

8.2 Comparison by Product

Chart on Comparison by Product
Data Table on Comparison by Product

8.3 Skincare products - Market size and forecast 2025-2030

Chart on Skincare products - Market size and forecast 2025-2030 ($ million)
Data Table on Skincare products - Market size and forecast 2025-2030 ($ million)
Chart on Skincare products - Year-over-year growth 2025-2030 (%)
Data Table on Skincare products - Year-over-year growth 2025-2030 (%)

8.4 Fragrances - Market size and forecast 2025-2030

Chart on Fragrances - Market size and forecast 2025-2030 ($ million)
Data Table on Fragrances - Market size and forecast 2025-2030 ($ million)
Chart on Fragrances - Year-over-year growth 2025-2030 (%)
Data Table on Fragrances - Year-over-year growth 2025-2030 (%)

8.5 Color cosmetics - Market size and forecast 2025-2030

Chart on Color cosmetics - Market size and forecast 2025-2030 ($ million)
Data Table on Color cosmetics - Market size and forecast 2025-2030 ($ million)
Chart on Color cosmetics - Year-over-year growth 2025-2030 (%)
Data Table on Color cosmetics - Year-over-year growth 2025-2030 (%)

8.6 Hair care products - Market size and forecast 2025-2030

Chart on Hair care products - Market size and forecast 2025-2030 ($ million)
Data Table on Hair care products - Market size and forecast 2025-2030 ($ million)
Chart on Hair care products - Year-over-year growth 2025-2030 (%)
Data Table on Hair care products - Year-over-year growth 2025-2030 (%)

8.7 Others - Market size and forecast 2025-2030

Chart on Others - Market size and forecast 2025-2030 ($ million)
Data Table on Others - Market size and forecast 2025-2030 ($ million)
Chart on Others - Year-over-year growth 2025-2030 (%)
Data Table on Others - Year-over-year growth 2025-2030 (%)

8.8 Market opportunity by Product

Market opportunity by Product ($ million)
Data Table on Market opportunity by Product ($ million)

9. Market Segmentation by Distribution Channel

9.1 Market segments

Chart on Distribution Channel - Market share 2025-2030 (%)
Data Table on Distribution Channel - Market share 2025-2030 (%)

9.2 Comparison by Distribution Channel

Chart on Comparison by Distribution Channel
Data Table on Comparison by Distribution Channel

9.3 Offline - Market size and forecast 2025-2030

Chart on Offline - Market size and forecast 2025-2030 ($ million)
Data Table on Offline - Market size and forecast 2025-2030 ($ million)
Chart on Offline - Year-over-year growth 2025-2030 (%)
Data Table on Offline - Year-over-year growth 2025-2030 (%)

9.4 Online - Market size and forecast 2025-2030

Chart on Online - Market size and forecast 2025-2030 ($ million)
Data Table on Online - Market size and forecast 2025-2030 ($ million)
Chart on Online - Year-over-year growth 2025-2030 (%)
Data Table on Online - Year-over-year growth 2025-2030 (%)

9.5 Market opportunity by Distribution Channel

Market opportunity by Distribution Channel ($ million)
Data Table on Market opportunity by Distribution Channel ($ million)

10. Market Segmentation by Type

10.1 Market segments

Chart on Type - Market share 2025-2030 (%)
Data Table on Type - Market share 2025-2030 (%)

10.2 Comparison by Type

Chart on Comparison by Type
Data Table on Comparison by Type

10.3 Natural and organic - Market size and forecast 2025-2030

Chart on Natural and organic - Market size and forecast 2025-2030 ($ million)
Data Table on Natural and organic - Market size and forecast 2025-2030 ($ million)
Chart on Natural and organic - Year-over-year growth 2025-2030 (%)
Data Table on Natural and organic - Year-over-year growth 2025-2030 (%)

10.4 Conventional - Market size and forecast 2025-2030

Chart on Conventional - Market size and forecast 2025-2030 ($ million)
Data Table on Conventional - Market size and forecast 2025-2030 ($ million)
Chart on Conventional - Year-over-year growth 2025-2030 (%)
Data Table on Conventional - Year-over-year growth 2025-2030 (%)

10.5 Market opportunity by Type

Market opportunity by Type ($ million)
Data Table on Market opportunity by Type ($ million)

11. Market Segmentation by Gender

11.1 Market segments

Chart on Gender - Market share 2025-2030 (%)
Data Table on Gender - Market share 2025-2030 (%)

11.2 Comparison by Gender

Chart on Comparison by Gender
Data Table on Comparison by Gender

11.3 Female - Market size and forecast 2025-2030

Chart on Female - Market size and forecast 2025-2030 ($ million)
Data Table on Female - Market size and forecast 2025-2030 ($ million)
Chart on Female - Year-over-year growth 2025-2030 (%)
Data Table on Female - Year-over-year growth 2025-2030 (%)

11.4 Male - Market size and forecast 2025-2030

Chart on Male - Market size and forecast 2025-2030 ($ million)
Data Table on Male - Market size and forecast 2025-2030 ($ million)
Chart on Male - Year-over-year growth 2025-2030 (%)
Data Table on Male - Year-over-year growth 2025-2030 (%)

11.5 Unisex - Market size and forecast 2025-2030

Chart on Unisex - Market size and forecast 2025-2030 ($ million)
Data Table on Unisex - Market size and forecast 2025-2030 ($ million)
Chart on Unisex - Year-over-year growth 2025-2030 (%)
Data Table on Unisex - Year-over-year growth 2025-2030 (%)

11.6 Market opportunity by Gender

Market opportunity by Gender ($ million)
Data Table on Market opportunity by Gender ($ million)

12. Customer Landscape

12.1 Customer landscape overview

Analysis of price sensitivity, lifecycle, customer purchase basket, adoption rates, and purchase criteria

13. Geographic Landscape

13.1 Geographic segmentation

Chart on Market share by geography 2025-2030 (%)
Data Table on Market share by geography 2025-2030 (%)

13.2 Geographic comparison

Chart on Geographic comparison
Data Table on Geographic comparison

13.3 APAC - Market size and forecast 2025-2030

Chart on APAC - Market size and forecast 2025-2030 ($ million)
Data Table on APAC - Market size and forecast 2025-2030 ($ million)
Chart on APAC - Year-over-year growth 2025-2030 (%)
Data Table on APAC - Year-over-year growth 2025-2030 (%)
Chart on Regional Comparison - APAC
Data Table on Regional Comparison - APAC

13.3.1 China - Market size and forecast 2025-2030

Chart on China - Market size and forecast 2025-2030 ($ million)
Data Table on China - Market size and forecast 2025-2030 ($ million)
Chart on China - Year-over-year growth 2025-2030 (%)
Data Table on China - Year-over-year growth 2025-2030 (%)

13.3.2 Japan - Market size and forecast 2025-2030

Chart on Japan - Market size and forecast 2025-2030 ($ million)
Data Table on Japan - Market size and forecast 2025-2030 ($ million)
Chart on Japan - Year-over-year growth 2025-2030 (%)
Data Table on Japan - Year-over-year growth 2025-2030 (%)

13.3.3 India - Market size and forecast 2025-2030

Chart on India - Market size and forecast 2025-2030 ($ million)
Data Table on India - Market size and forecast 2025-2030 ($ million)
Chart on India - Year-over-year growth 2025-2030 (%)
Data Table on India - Year-over-year growth 2025-2030 (%)

13.3.4 South Korea - Market size and forecast 2025-2030

Chart on South Korea - Market size and forecast 2025-2030 ($ million)
Data Table on South Korea - Market size and forecast 2025-2030 ($ million)
Chart on South Korea - Year-over-year growth 2025-2030 (%)
Data Table on South Korea - Year-over-year growth 2025-2030 (%)

13.3.5 Australia - Market size and forecast 2025-2030

Chart on Australia - Market size and forecast 2025-2030 ($ million)
Data Table on Australia - Market size and forecast 2025-2030 ($ million)
Chart on Australia - Year-over-year growth 2025-2030 (%)
Data Table on Australia - Year-over-year growth 2025-2030 (%)

13.3.6 Indonesia - Market size and forecast 2025-2030

Chart on Indonesia - Market size and forecast 2025-2030 ($ million)
Data Table on Indonesia - Market size and forecast 2025-2030 ($ million)
Chart on Indonesia - Year-over-year growth 2025-2030 (%)
Data Table on Indonesia - Year-over-year growth 2025-2030 (%)

13.4 Europe - Market size and forecast 2025-2030

Chart on Europe - Market size and forecast 2025-2030 ($ million)
Data Table on Europe - Market size and forecast 2025-2030 ($ million)
Chart on Europe - Year-over-year growth 2025-2030 (%)
Data Table on Europe - Year-over-year growth 2025-2030 (%)
Chart on Regional Comparison - Europe
Data Table on Regional Comparison - Europe

13.4.1 Germany - Market size and forecast 2025-2030

Chart on Germany - Market size and forecast 2025-2030 ($ million)
Data Table on Germany - Market size and forecast 2025-2030 ($ million)
Chart on Germany - Year-over-year growth 2025-2030 (%)
Data Table on Germany - Year-over-year growth 2025-2030 (%)

13.4.2 UK - Market size and forecast 2025-2030

Chart on UK - Market size and forecast 2025-2030 ($ million)
Data Table on UK - Market size and forecast 2025-2030 ($ million)
Chart on UK - Year-over-year growth 2025-2030 (%)
Data Table on UK - Year-over-year growth 2025-2030 (%)

13.4.3 France - Market size and forecast 2025-2030

Chart on France - Market size and forecast 2025-2030 ($ million)
Data Table on France - Market size and forecast 2025-2030 ($ million)
Chart on France - Year-over-year growth 2025-2030 (%)
Data Table on France - Year-over-year growth 2025-2030 (%)

13.4.4 Italy - Market size and forecast 2025-2030

Chart on Italy - Market size and forecast 2025-2030 ($ million)
Data Table on Italy - Market size and forecast 2025-2030 ($ million)
Chart on Italy - Year-over-year growth 2025-2030 (%)
Data Table on Italy - Year-over-year growth 2025-2030 (%)

13.4.5 Spain - Market size and forecast 2025-2030

Chart on Spain - Market size and forecast 2025-2030 ($ million)
Data Table on Spain - Market size and forecast 2025-2030 ($ million)
Chart on Spain - Year-over-year growth 2025-2030 (%)
Data Table on Spain - Year-over-year growth 2025-2030 (%)

13.4.6 The Netherlands - Market size and forecast 2025-2030

Chart on The Netherlands - Market size and forecast 2025-2030 ($ million)
Data Table on The Netherlands - Market size and forecast 2025-2030 ($ million)
Chart on The Netherlands - Year-over-year growth 2025-2030 (%)
Data Table on The Netherlands - Year-over-year growth 2025-2030 (%)

13.5 North America - Market size and forecast 2025-2030

Chart on North America - Market size and forecast 2025-2030 ($ million)
Data Table on North America - Market size and forecast 2025-2030 ($ million)
Chart on North America - Year-over-year growth 2025-2030 (%)
Data Table on North America - Year-over-year growth 2025-2030 (%)
Chart on Regional Comparison - North America
Data Table on Regional Comparison - North America

13.5.1 US - Market size and forecast 2025-2030

Chart on US - Market size and forecast 2025-2030 ($ million)
Data Table on US - Market size and forecast 2025-2030 ($ million)
Chart on US - Year-over-year growth 2025-2030 (%)
Data Table on US - Year-over-year growth 2025-2030 (%)

13.5.2 Canada - Market size and forecast 2025-2030

Chart on Canada - Market size and forecast 2025-2030 ($ million)
Data Table on Canada - Market size and forecast 2025-2030 ($ million)
Chart on Canada - Year-over-year growth 2025-2030 (%)
Data Table on Canada - Year-over-year growth 2025-2030 (%)

13.5.3 Mexico - Market size and forecast 2025-2030

Chart on Mexico - Market size and forecast 2025-2030 ($ million)
Data Table on Mexico - Market size and forecast 2025-2030 ($ million)
Chart on Mexico - Year-over-year growth 2025-2030 (%)
Data Table on Mexico - Year-over-year growth 2025-2030 (%)

13.6 South America - Market size and forecast 2025-2030

Chart on South America - Market size and forecast 2025-2030 ($ million)
Data Table on South America - Market size and forecast 2025-2030 ($ million)
Chart on South America - Year-over-year growth 2025-2030 (%)
Data Table on South America - Year-over-year growth 2025-2030 (%)
Chart on Regional Comparison - South America
Data Table on Regional Comparison - South America

13.6.1 Brazil - Market size and forecast 2025-2030

Chart on Brazil - Market size and forecast 2025-2030 ($ million)
Data Table on Brazil - Market size and forecast 2025-2030 ($ million)
Chart on Brazil - Year-over-year growth 2025-2030 (%)
Data Table on Brazil - Year-over-year growth 2025-2030 (%)

13.6.2 Argentina - Market size and forecast 2025-2030

Chart on Argentina - Market size and forecast 2025-2030 ($ million)
Data Table on Argentina - Market size and forecast 2025-2030 ($ million)
Chart on Argentina - Year-over-year growth 2025-2030 (%)
Data Table on Argentina - Year-over-year growth 2025-2030 (%)

13.6.3 Chile - Market size and forecast 2025-2030

Chart on Chile - Market size and forecast 2025-2030 ($ million)
Data Table on Chile - Market size and forecast 2025-2030 ($ million)
Chart on Chile - Year-over-year growth 2025-2030 (%)
Data Table on Chile - Year-over-year growth 2025-2030 (%)

13.7 Middle East and Africa - Market size and forecast 2025-2030

Chart on Middle East and Africa - Market size and forecast 2025-2030 ($ million)
Data Table on Middle East and Africa - Market size and forecast 2025-2030 ($ million)
Chart on Middle East and Africa - Year-over-year growth 2025-2030 (%)
Data Table on Middle East and Africa - Year-over-year growth 2025-2030 (%)
Chart on Regional Comparison - Middle East and Africa
Data Table on Regional Comparison - Middle East and Africa

13.7.1 Saudi Arabia - Market size and forecast 2025-2030

Chart on Saudi Arabia - Market size and forecast 2025-2030 ($ million)
Data Table on Saudi Arabia - Market size and forecast 2025-2030 ($ million)
Chart on Saudi Arabia - Year-over-year growth 2025-2030 (%)
Data Table on Saudi Arabia - Year-over-year growth 2025-2030 (%)

13.7.2 UAE - Market size and forecast 2025-2030

Chart on UAE - Market size and forecast 2025-2030 ($ million)
Data Table on UAE - Market size and forecast 2025-2030 ($ million)
Chart on UAE - Year-over-year growth 2025-2030 (%)
Data Table on UAE - Year-over-year growth 2025-2030 (%)

13.7.3 South Africa - Market size and forecast 2025-2030

Chart on South Africa - Market size and forecast 2025-2030 ($ million)
Data Table on South Africa - Market size and forecast 2025-2030 ($ million)
Chart on South Africa - Year-over-year growth 2025-2030 (%)
Data Table on South Africa - Year-over-year growth 2025-2030 (%)

13.7.4 Israel - Market size and forecast 2025-2030

Chart on Israel - Market size and forecast 2025-2030 ($ million)
Data Table on Israel - Market size and forecast 2025-2030 ($ million)
Chart on Israel - Year-over-year growth 2025-2030 (%)
Data Table on Israel - Year-over-year growth 2025-2030 (%)

13.7.5 Turkey - Market size and forecast 2025-2030

Chart on Turkey - Market size and forecast 2025-2030 ($ million)
Data Table on Turkey - Market size and forecast 2025-2030 ($ million)
Chart on Turkey - Year-over-year growth 2025-2030 (%)
Data Table on Turkey - Year-over-year growth 2025-2030 (%)

13.8 Market opportunity by geography

Market opportunity by geography ($ million)
Data Tables on Market opportunity by geography ($ million)

14. Drivers, Challenges, and Opportunity

14.1 Market drivers

Premiumization of hair care and skinification trend
Rising consumer demand for science-backed and advanced skincare formulations
Convergence of makeup artistry and skincare benefits in color cosmetics

14.2 Market challenges

Intricate regulatory compliances and evolving sustainability mandates
Rising tariff pressures and fragile transnational supply chains
Proliferation of sophisticated counterfeit products

14.3 Impact of drivers and challenges

Impact of drivers and challenges in 2025 and 2030

14.4 Market opportunities

Hyper-personalization through generative AI and digital diagnostics
Clean science and rise of biotechnology-derived sustainable ingredients
Cross-category convergence and global expansion of multi-functional hybrid cosmetics

15. Competitive Landscape

15.1 Overview

15.2

Overview on criticality of inputs and factors of differentiation

15.3 Landscape disruption

Overview on factors of disruption

15.4 Industry risks

Impact of key risks on business

16. Competitive Analysis

16.1 Companies profiled

Companies covered

16.2 Company ranking index

16.3 Market positioning of companies

Matrix on companies position and classification

16.4 Amorepacific Corp.

Amorepacific Corp. - Overview
Amorepacific Corp. - Business segments
Amorepacific Corp. - Key offerings
Amorepacific Corp. - Segment focus
SWOT

16.5 Avon Products Inc.

Avon Products Inc. - Overview
Avon Products Inc. - Product / Service
Avon Products Inc. - Key offerings
SWOT

16.6 Beiersdorf AG

Beiersdorf AG - Overview
Beiersdorf AG - Business segments
Beiersdorf AG - Key offerings
Beiersdorf AG - Segment focus
SWOT

16.7 e.l.f. Beauty Inc.

e.l.f. Beauty Inc. - Overview
e.l.f. Beauty Inc. - Product / Service
e.l.f. Beauty Inc. - Key offerings
SWOT

16.8 Henkel AG and Co. KGaA

Henkel AG and Co. KGaA - Overview
Henkel AG and Co. KGaA - Business segments
Henkel AG and Co. KGaA - Key offerings
Henkel AG and Co. KGaA - Segment focus
SWOT

16.9 Interparfums Inc.

Interparfums Inc. - Overview
Interparfums Inc. - Product / Service
Interparfums Inc. - Key offerings
SWOT

16.10 Kao Corp.

Kao Corp. - Overview
Kao Corp. - Business segments
Kao Corp. - Key news
Kao Corp. - Key offerings
Kao Corp. - Segment focus
SWOT

16.11 Kose Corp.

Kose Corp. - Overview
Kose Corp. - Product / Service
Kose Corp. - Key offerings
SWOT

16.12 LG H and H Co. Ltd

LG H and H Co. Ltd - Overview
LG H and H Co. Ltd - Business segments
LG H and H Co. Ltd - Key offerings
LG H and H Co. Ltd - Segment focus
SWOT

16.13 LOccitane Groupe SA

LOccitane Groupe SA - Overview
LOccitane Groupe SA - Business segments
LOccitane Groupe SA - Key offerings
LOccitane Groupe SA - Segment focus
SWOT

16.14 Loreal SA

Loreal SA - Overview
Loreal SA - Business segments
Loreal SA - Key offerings
Loreal SA - Segment focus
SWOT

16.15 Natura and Co. Holding SA

Natura and Co. Holding SA - Overview
Natura and Co. Holding SA - Business segments
Natura and Co. Holding SA - Key offerings
Natura and Co. Holding SA - Segment focus
SWOT

16.16 Shanghai Jahwa United Co. Ltd.

Shanghai Jahwa United Co. Ltd. - Overview
Shanghai Jahwa United Co. Ltd. - Product / Service
Shanghai Jahwa United Co. Ltd. - Key offerings
SWOT

16.17 The Estee Lauder Co. Inc.

The Estee Lauder Co. Inc. - Overview
The Estee Lauder Co. Inc. - Business segments
The Estee Lauder Co. Inc. - Key offerings
The Estee Lauder Co. Inc. - Segment focus
SWOT

16.18 The Honest Co. Inc.

The Honest Co. Inc. - Overview
The Honest Co. Inc. - Business segments
The Honest Co. Inc. - Key offerings
The Honest Co. Inc. - Segment focus
SWOT

17. Appendix

17.1 Scope of the report

Market definition
Objectives
Notes and caveats

17.2 Inclusions and exclusions checklist

Inclusions checklist
Exclusions checklist

17.3 Currency conversion rates for US$

17.4 Research methodology

17.5 Data procurement

Information sources

17.6 Data validation

17.7 Validation techniques employed for market sizing

17.8 Data synthesis

17.9 360 degree market analysis

17.10 List of abbreviations

Research Methodology

Technavio presents a detailed picture of the market by way of study, synthesis, and summation of data from multiple sources. The analysts have presented the various facets of the market with a particular focus on identifying the key industry influencers. The data thus presented is comprehensive, reliable, and the result of extensive research, both primary and secondary.

INFORMATION SOURCES

Primary sources

  • Manufacturers and suppliers
  • Channel partners
  • Industry experts
  • Strategic decision makers

Secondary sources

  • Industry journals and periodicals
  • Government data
  • Financial reports of key industry players
  • Historical data
  • Press releases

DATA ANALYSIS

Data Synthesis

  • Collation of data
  • Estimation of key figures
  • Analysis of derived insights

Data Validation

  • Triangulation with data models
  • Reference against proprietary databases
  • Corroboration with industry experts

REPORT WRITING

Qualitative

  • Market drivers
  • Market challenges
  • Market trends
  • Five forces analysis

Quantitative

  • Market size and forecast
  • Market segmentation
  • Geographical insights
  • Competitive landscape

Interested in this report?

Get your sample now to see our research methodology and insights!

Download Now

Frequently Asked Questions

Premium Cosmetics market growth will increase by USD 81447.0 million during 2026-2030.

The Premium Cosmetics market is expected to grow at a CAGR of 10% during 2026-2030.

Premium Cosmetics market is segmented by Product (Skincare products, Fragrances, Color cosmetics, Hair care products, Others) Distribution channel (Offline, Online) Type (Natural and organic, Conventional) Gender (Female, Male, Unisex)

Amorepacific Corp., Avon Products Inc., Beiersdorf AG, Chanel Ltd., Coty Inc., Dr. Barbara Sturm GmbH, e.l.f. Beauty Inc., Groupe Clarins, Henkel AG and Co. KGaA, Interparfums Inc., Kao Corp., Kose Corp., LG H and H Co. Ltd, LOccitane Groupe SA, Loreal SA, Mary Kay Inc., Natura and Co. Holding SA, Oriflame Holding AG, PUIG S.L., Revlon Inc., Shanghai Jahwa United Co. Ltd., Shiseido Co. Ltd., Sisley SAS, The Estee Lauder Co. Inc., The Honest Co. Inc. are a few of the key vendors in the Premium Cosmetics market.

APAC will register the highest growth rate of 47.1% among the other regions. Therefore, the Premium Cosmetics market in APAC is expected to garner significant business opportunities for the vendors during the forecast period.

China, Japan, India, South Korea, Australia, Indonesia, Germany, UK, France, Italy, Spain, The Netherlands, US, Canada, Mexico, Brazil, Argentina, Chile, Saudi Arabia, UAE, South Africa, Israel, Turkey

  • Premiumization of hair care and skinification trend is the driving factor this market.

The Premium Cosmetics market vendors should focus on grabbing business opportunities from the Product segment as it accounted for the largest market share in the base year.
RIA - Research AI Assistant
Ask RIA
