Clean Beauty Market Size 2025-2029
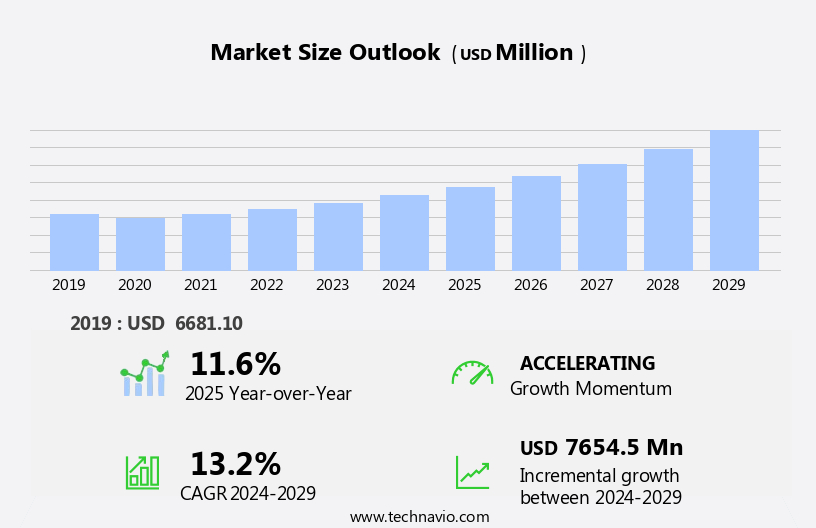
The clean beauty market size is forecast to increase by USD 7.65 billion at a CAGR of 13.2% between 2024 and 2029.
- The market is experiencing significant growth, driven by several key factors. One major trend is the increase in disposable income, enabling consumers to invest in premium, health-conscious beauty products. Another trend is the preference for multi-functional beauty products, as consumers seek to simplify their routines and reduce the number of products they use. Skincare products, such as scrubs and serums, are a popular choice for those looking to maintain healthy and radiant skin. Clean color cosmetics, skincare, hair care, oral care, and personal care products are gaining popularity, with a focus on natural, organic, and sustainable ingredients. However, consumer trust issues and the rise of greenwashing are challenges that the market must address. As consumers become more aware of the ingredients In their beauty products and demand transparency, companies must ensure they are delivering on their promises. The market is expected to continue growing, as consumers prioritize health and wellness in all aspects of their lives.
What will be the Size of the Clean Beauty Market During the Forecast Period?
- The market continues to gain momentum, driven by consumer demand for non-toxic, transparent, and science-backed beauty solutions. This movement, which highlights the use of clean and sustainable ingredients, has been fueled by various trends, including the rise of clean mulations, the increasing influence of celebrities and influencers, and the growing awareness of the potential health risks associated with traditional beauty products. Certification programs, such as those offering certification for clean and cruelty-free products, have played a significant role In the market's growth. Consumers are increasingly seeking out sustainable beauty products, from travel essentials to gift sets, as they prioritize ethical and additive-free offerings.
- The market caters to diverse consumer segments, including women, men, kids, and those with sensitive skin. Innovation In the sector is driven by startups and specialty stores, who are addressing the unique needs of different skin types, such as oily or dry skin, and debunking common myths surrounding clean beauty. Retailers are responding to this trend by expanding their offerings and providing education to consumers about the benefits of clean and sustainable beauty. Subscription boxes and other e-commerce platforms offer convenient access to a range of clean and plant-based beauty products. Despite the progress made In the market, there are still challenges to address, including the need for greater transparency around ingredients and manufacturing processes, as well as the ethical considerations surrounding wages for women and the use of animal testing In the beauty industry.
How is this Clean Beauty Industry segmented and which is the largest segment?
The clean beauty industry research report provides comprehensive data (region-wise segment analysis), with forecasts and estimates in "USD billion" for the period 2025-2029, as well as historical data from 2019-2023 for the following segments.
- Product
- Skincare
- Haircare
- Face care
- Body care
- Color cosmetics
- End-user
- Women
- Men
- Geography
- North America
- Canada
- US
- Europe
- Germany
- UK
- France
- APAC
- China
- Japan
- South Korea
- South America
- Brazil
- Middle East and Africa
- North America
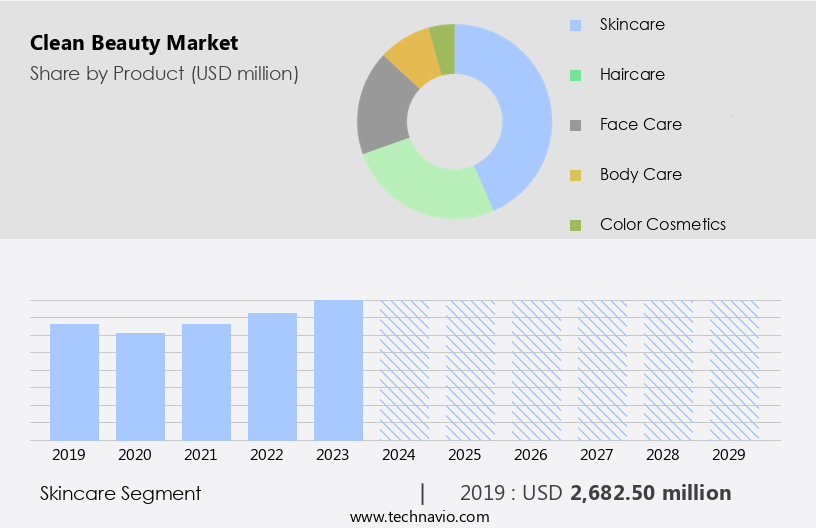
By Product Insights
- The skincare segment is estimated to witness significant growth during the forecast period.
The market encompasses a range of skincare and beauty products formulated with natural, non-toxic ingredients. This market segment, which includes cleansers, moisturizers, serums, sunscreens, and anti-aging treatments, is gaining popularity due to increasing consumer demand for safer and sustainable solutions. The skincare segment's dominance is driven by the growing emphasis on comprehensive skincare routines and the proven effectiveness of these products in addressing various skin concerns. Notable product launches further strengthen the market's position. Consumers are increasingly opting for clean standards, green beauty, and eco-friendly choices, making this a significant trend In the beauty industry.
Get a glance at the Clean Beauty Industry report of share of various segments Request Free Sample
The skincare segment was valued at USD 2.68 billion in 2019 and showed a gradual increase during the forecast period.
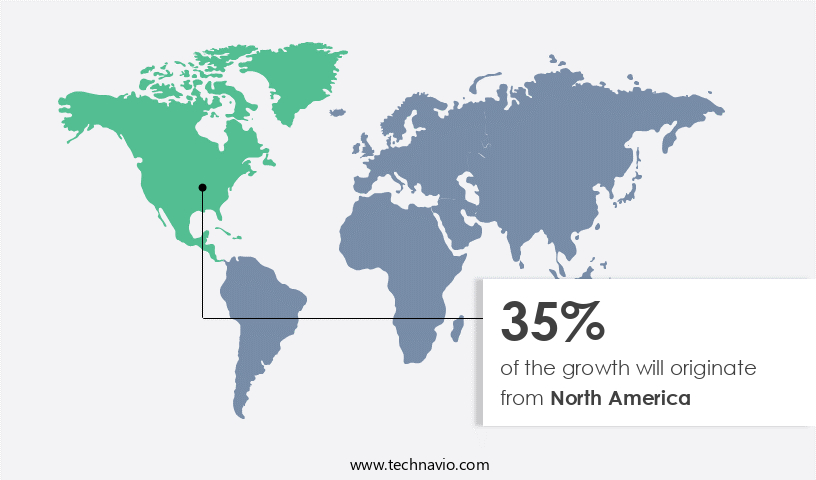
Regional Analysis
- North America is estimated to contribute 35% to the growth of the global market during the forecast period.
Technavio's analysts have elaborately explained the regional trends and drivers that shape the market during the forecast period.
For more insights on the market share of various regions, Request Free Sample
The market in North America is experiencing notable growth, fueled by consumer demographics prioritizing sustainability and ethical considerations. As of Q2 2024, Gen Z represented 18% of the labor force, while Baby Boomers comprised 15%, and Millennials held the largest share at 36%. This demographic shift influences market trends, with younger consumers preferring non-toxic, clean beauty products that align with their values. The clean beauty sector in North America continues to expand, catering to the increasing demand for pure, organic, and toxic-free personal care products, including lip products, liquid foundations, hair care, and oral care.
Market Dynamics
Our clean beauty market researchers analyzed the data with 2024 as the base year, along with the key drivers, trends, and challenges. A holistic analysis of drivers will help companies refine their marketing strategies to gain a competitive advantage.
What are the key market drivers leading to the rise In the adoption of Clean Beauty Industry?
Increase in disposable income is the key driver of the market.
- The market is witnessing significant growth due to the increasing consumer awareness and preference for clean and non-toxic beauty products. This trend is driven by the desire for sustainable skincare and clean color cosmetics that are free from harmful ingredients such as phthalates, parabens, synthetic fragrances, talc, and other synthetic chemicals. Consumers are increasingly seeking eco-friendly beauty solutions that align with their values of ethical sourcing and sustainability. The market for clean beauty products includes a wide range of items such as cleansers, moisturizers, serums, scrubs, lip products, hair care, and oral care. These products are made with natural ingredients and are additive-free, ensuring that they are safe for both the end user and the environment.
- The demand for clean beauty products is not limited to skincare but also extends to makeup, including eyeshadows, blushes, and setting powders. The shift towards clean beauty is a global trend, with many countries witnessing an increase in demand for these products. For instance, in China, the growing disposable income has enabled consumers to prioritize clean beauty products, leading to a rise in demand for eco-friendly and non-toxic options. This trend is expected to continue as consumers become more conscious of the impact of their purchasing decisions on their health and the environment. The market offers sustainable solutions for personal care products, providing consumers with a wide range of options that align with their values and preferences.
What are the market trends shaping the Clean Beauty Industry?
Transition to multi-functional beauty products is the upcoming market trend.
- The market is experiencing a notable trend towards multi-functional, sustainable beauty products. Consumers are increasingly seeking high-performance solutions that combine multiple benefits in a single item, aiming for simplified and efficient beauty routines. This shift is driven by the demand for clean and non-toxic, eco-friendly beauty products, free from harmful ingredients such as phthalates, parabens, synthetic fragrances, and talc. Brands are adhering to clean standards, ensuring additive-free, ethical sourcing, and environmental friendliness.
- These trends reflect a broader consumer consciousness toward health and the environment. This innovative product offers the benefits of a Vitamin C serum, mineral SPF, Niacinamide, and hydrating oils in a single item. The market for clean beauty continues to grow, with a focus on providing consumers with pure, non-toxic, and eco-friendly choices. Clean skincare products, including cleansers, moisturizers, and serums, are in high demand, as consumers seek to maintain healthy, radiant skin. Lip products, such as lipsticks and balms, are also gaining popularity, with a focus on natural, non-toxic ingredients.
What challenges does the Clean Beauty Industry face during its growth?
Consumer trust issues and greenwashing is a key challenge affecting the industry's growth.
- The market is witnessing growing demand as consumers increasingly seek out clean and non-toxic beauty products. This trend is driven by concerns over harmful ingredients, such as phthalates, parabens, synthetic fragrances, and talc, found in traditional beauty products. In response, the market is seeing an influx of sustainable skincare and clean color cosmetics, as well as eco-friendly choices in hair care, oral care, and personal care products. However, the industry faces challenges related to consumer trust and greenwashing. Greenwashing occurs when brands falsely market themselves as eco-friendly or clean without adhering to genuine sustainability standards.
- To address these concerns, the market is shifting towards sustainable solutions and ethical sourcing. Brands are focusing on using natural ingredients, such as herbs, fruits, and botanicals, and adhering to clean standards. Consumers are also demanding additive-free and toxic-free products, leading to the growth of pure, organic, and natural beauty offerings. The market includes a range of products, such as cleansers, moisturizers, serums, scrubs, eyeshadows, setting powders, and lip products, available in various forms like gel, powder, liquid, and natural. The market is expected to continue growing as consumers prioritize their health and the environment In their personal care choices.
Exclusive Customer Landscape
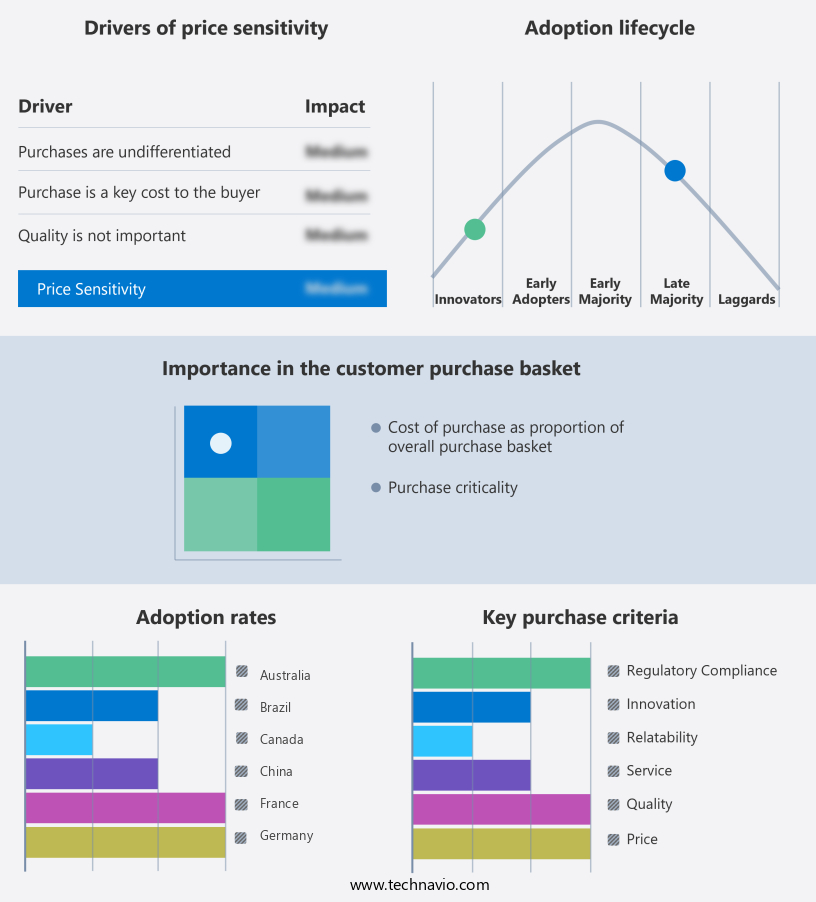
The clean beauty market forecasting report includes the adoption lifecycle of the market, covering from the innovator's stage to the laggard's stage. It focuses on adoption rates in different regions based on penetration. Furthermore, the clean beauty market report also includes key purchase criteria and drivers of price sensitivity to help companies evaluate and develop their market growth analysis strategies.
Customer Landscape
Key Companies & Market Insights
Companies are implementing various strategies, such as strategic alliances, clean beauty market forecast, partnerships, mergers and acquisitions, geographical expansion, and product/service launches, to enhance their presence In the industry.
100 Percent PURE - The company offers Luminous Primer, Fruit Pigmented Cream Foundation, Fruit Pigmented 2nd Skin Foundation, and BB Cream.
The industry research and growth report includes detailed analyses of the competitive landscape of the market and information about key companies, including:
- 100 Percent PURE
- Amorepacific Corp.
- CLEAN Beauty Collective
- e.l.f. Beauty Inc.
- GROWN ALCHEMIST
- ILIA Beauty
- John Paul Mitchell Systems
- LOreal SA
- OFFSPRING BEAUTY CO.
- Olaplex Holdings Inc.
- RMS Beauty
- Shiseido Co. Ltd.
- The Estee Lauder Co. Inc.
- The Honest Co. Inc.
Qualitative and quantitative analysis of companies has been conducted to help clients understand the wider business environment as well as the strengths and weaknesses of key industry players. Data is qualitatively analyzed to categorize companies as pure play, category-focused, industry-focused, and diversified; it is quantitatively analyzed to categorize companies as dominant, leading, strong, tentative, and weak.
Research Analyst Overview
The market continues to gain momentum as consumers become increasingly conscious of what they put on their bodies. This shift towards clean and non-toxic beauty products is driven by a collective desire for sustainable skincare and eco-friendly color cosmetics. The trend towards clean beauty is not limited to specific regions or demographics but is a global movement that transcends borders. Clean beauty encompasses a range of products, from additive-free cleansers and moisturizers to natural lip products and sustainable hair care solutions. These products are free from harmful ingredients such as phthalates, parabens, synthetic fragrances, talc, and other synthetic chemicals.
Instead, they are made with natural and organic ingredients, ensuring that they are safe for both the user and the environment. The beauty industry is responding to this trend by offering a wider range of clean and sustainable solutions. Brands are focusing on ethical sourcing and using clean standards to produce their products. Supermarkets and hypermarkets are also getting in on the action, offering a growing selection of eco-friendly beauty products. These products are free from harmful elements and are designed to nourish and protect the skin.
Similarly, clean color cosmetics, such as eyeshadows and blushes, offer vibrant and long-lasting colors without the use of synthetic chemicals. The demand for clean beauty is not just driven by health concerns, but also by a desire for sustainable and ethical choices. Consumers are increasingly aware of the environmental impact of traditional beauty products and are looking for alternatives. Clean and non-toxic beauty products are often made using sustainable ingredients and packaging, reducing their carbon footprint and minimizing waste. The market is expected to continue growing as more consumers make the switch to clean and sustainable solutions. This trend is not just a fad, but a fundamental shift In the way we approach personal care.
|
Clean Beauty Market Scope |
|
|
Report Coverage |
Details |
|
Page number |
205 |
|
Base year |
2024 |
|
Historic period |
2019-2023 |
|
Forecast period |
2025-2029 |
|
Growth momentum & CAGR |
Accelerate at a CAGR of 13.2% |
|
Market Growth 2025-2029 |
USD 7.65 billion |
|
Market structure |
Concentrated |
|
YoY growth 2024-2025(%) |
11.6 |
|
Key countries |
US, China, UK, France, South Korea, Germany, Japan, Canada, Brazil, and Australia |
|
Competitive landscape |
Leading Companies, Market Positioning of Companies, Competitive Strategies, and Industry Risks |
What are the Key Data Covered in this Clean Beauty Market Research and Growth Report?
- CAGR of the Clean Beauty industry during the forecast period
- Detailed information on factors that will drive the Clean Beauty growth and forecasting between 2025 and 2029
- Precise estimation of the size of the market and its contribution of the industry in focus to the parent market
- Accurate predictions about upcoming growth and trends and changes in consumer behaviour
- Growth of the market across North America, Europe, APAC, South America, and Middle East and Africa
- Thorough analysis of the market's competitive landscape and detailed information about companies
- Comprehensive analysis of factors that will challenge the clean beauty market growth of industry companies
We can help! Our analysts can customize this clean beauty market research report to meet your requirements.
 RIA -
RIA - 
