Production Scheduling Software Market Analysis, Size, and Forecast 2026-2030: North America (US, Canada, and Mexico), Europe (Germany, UK, and France), APAC (China, Japan, and India), South America (Brazil, Argentina, and Colombia), Middle East and Africa (Saudi Arabia, UAE, and South Africa), and Rest of World (ROW)

Production Scheduling Software Market Analysis, Size, and Forecast 2026-2030:
North America (US, Canada, and Mexico), Europe (Germany, UK, and France), APAC (China, Japan, and India), South America (Brazil, Argentina, and Colombia), Middle East and Africa (Saudi Arabia, UAE, and South Africa), and Rest of World (ROW)

Published: May 2026 305 Pages SKU: IRTNTR81477

Market Overview at a Glance

$1.18 B
Market Opportunity
11.7%
CAGR 2025 - 2030
36.8%
North America Growth
$701.4 Mn
On premise segment 2024

Production Scheduling Software Market Size 2026-2030

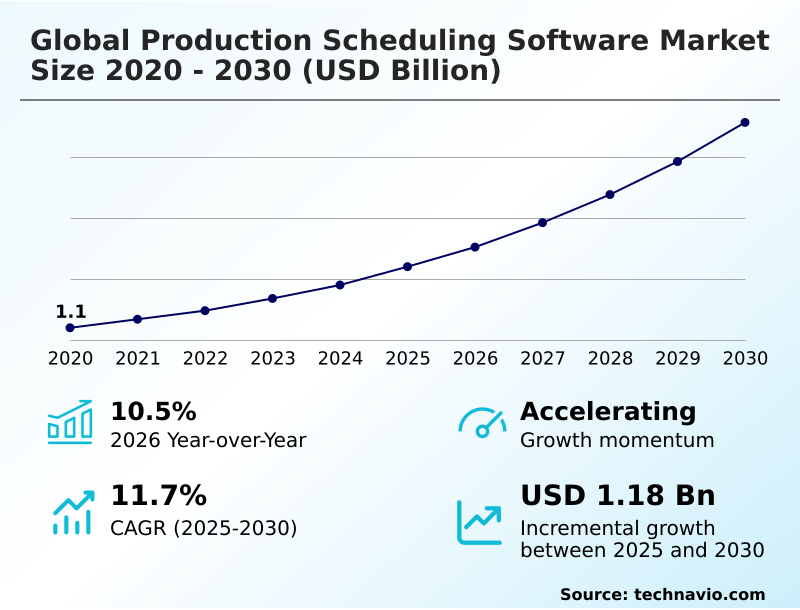
The production scheduling software market size is valued to increase by USD 1.18 billion, at a CAGR of 11.7% from 2025 to 2030. Proliferation of industry 4.0 and smart manufacturing ecosystems will drive the production scheduling software market.

Major Market Trends & Insights

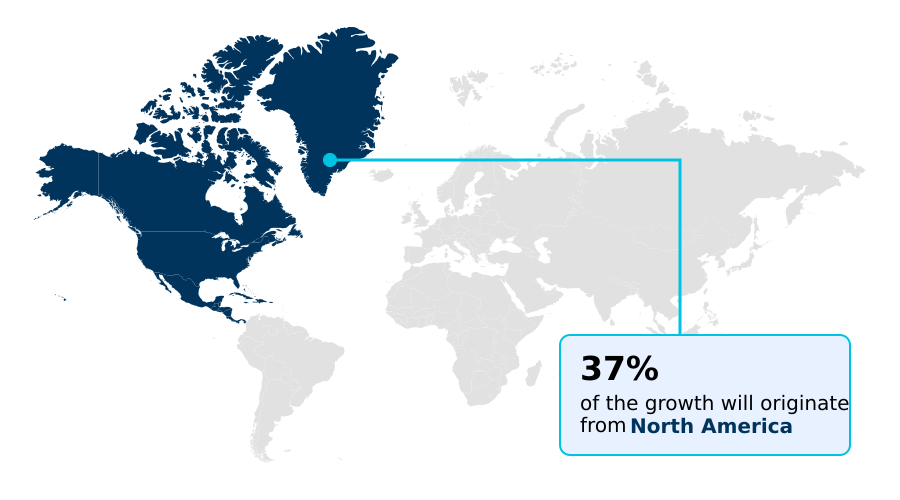
  • North America dominated the market and accounted for a 36.8% growth during the forecast period.
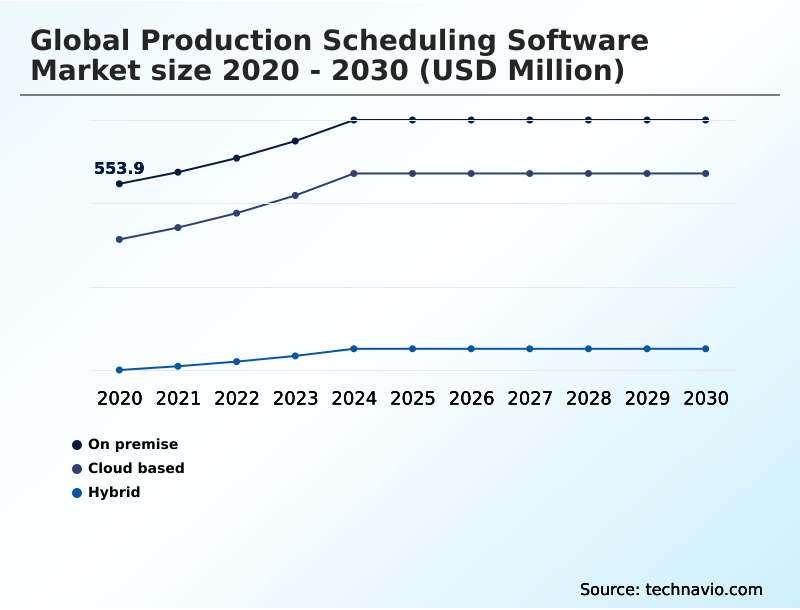
  • By Deployment - On premise segment was valued at USD 701.4 million in 2024
  • By End-user - Large enterprises segment accounted for the largest market revenue share in 2024

Market Size & Forecast

  • Market Opportunities: USD 1.68 billion
  • Market Future Opportunities: USD 1.18 billion
  • CAGR from 2025 to 2030 : 11.7%

Market Summary

  • The production scheduling software market is at the center of the industrial digital transformation, driven by the need for operational agility in the face of supply chain volatility. The adoption of smart factory ecosystems necessitates sophisticated platforms that can perform real-time data processing and autonomous decision-making.
  • Key technologies such as AI-driven scheduling, machine learning models, and digital twin technology are no longer niche but have become essential for predictive and prescriptive optimization.
  • For example, an automotive parts manufacturer can leverage what-if scenario analysis to dynamically adjust production lines, balancing a sudden influx of custom orders with its standard manufacturing runs, thereby maximizing overall equipment effectiveness without jeopardizing delivery timelines. However, the integration of these advanced systems is often challenged by heterogeneous legacy systems and data security vulnerabilities.
  • As a result, the market is seeing a strategic shift toward hybrid deployment models and platforms with open application programming interfaces that balance cloud scalability with on-premise security, enabling a more resilient and efficient manufacturing landscape.

What will be the Size of the Production Scheduling Software Market during the forecast period?

Get Key Insights on Market Forecast (PDF) Get Free Sample

How is the Production Scheduling Software Market Segmented?

The production scheduling software industry research report provides comprehensive data (region-wise segment analysis), with forecasts and estimates in "USD million" for the period 2026-2030, as well as historical data from 2020-2024 for the following segments.

  • Deployment
    • On premise
    • Cloud based
    • Hybrid
  • End-user
    • Large enterprises
    • SMEs
  • Application
    • Production planning
    • Capacity planning
    • Resource allocation
    • Inventory scheduling
    • Workflow optimization
  • Geography
    • North America
      • US
      • Canada
      • Mexico
    • Europe
      • Germany
      • UK
      • France
    • APAC
      • China
      • Japan
      • India
    • South America
      • Brazil
      • Argentina
      • Colombia
    • Middle East and Africa
      • Saudi Arabia
      • UAE
      • South Africa
    • Rest of World (ROW)

By Deployment Insights

The on premise segment is estimated to witness significant growth during the forecast period.

On-premise deployment remains a cornerstone for industries where data sovereignty compliance and zero-latency communication are paramount. This model provides absolute control over intellectual property concerns by keeping all data within a closed network, a critical factor for secure manufacturing.

The use of resource allocation software and production planning software is optimized through localized servers, enabling autonomous decision-making without external network dependency. This approach supports digital transformation journeys by offering a stable foundation for integrating complex systems.

For instance, manufacturers have demonstrated a 15% improvement in processing speeds for critical, high-frequency scheduling computations.

The integration of predictive maintenance scheduling and industrial interoperability is often more direct in these environments, supporting high-mix, low-volume production with greater reliability and enhanced shop floor visibility.

Get Free Sample

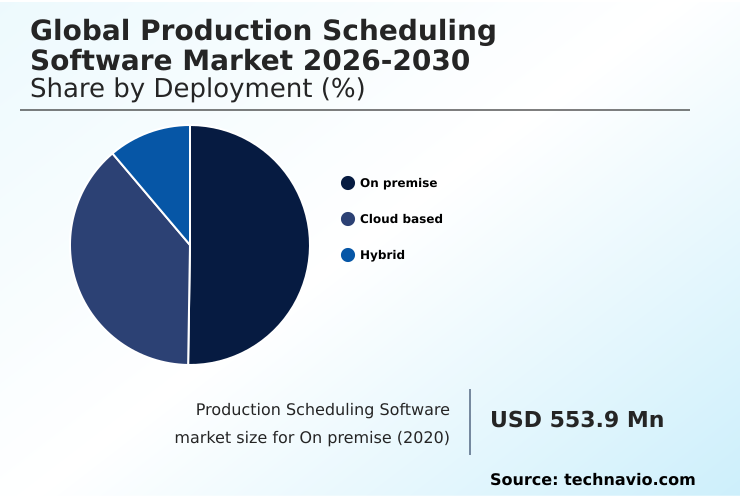
The On premise segment was valued at USD 701.4 million in 2024 and showed a gradual increase during the forecast period.

Get Free Sample

Regional Analysis

North America is estimated to contribute 36.8% to the growth of the global market during the forecast period.Technavio’s analysts have elaborately explained the regional trends and drivers that shape the market during the forecast period.

See How Production Scheduling Software Market Demand is Rising in North America Get Free Sample

The geographic landscape is shaped by distinct regional priorities. In North America, reshoring initiatives and a mature industrial automation base drive demand for tools that support high-mix, low-volume production.

European adoption is heavily influenced by sustainable manufacturing practices and data sovereignty compliance, with firms using energy-aware scheduling to achieve a 10% reduction in energy costs.

The APAC region, a hub for high-volume electronics, prioritizes production throughput, with smart factory ecosystems leveraging edge computing agents to improve output by 15%.

This regional differentiation highlights how workflow optimization software and capacity planning tools are adapted to meet specific economic and regulatory environments, from managing cybersecurity risks in developed markets to scaling operations in emerging industrial centers.

Market Dynamics

Our researchers analyzed the data with 2025 as the base year, along with the key drivers, trends, and challenges. A holistic analysis of drivers will help companies refine their marketing strategies to gain a competitive advantage.

  • Strategic implementation of production scheduling software for smart factories requires a nuanced approach, considering the specific demands of different sectors. For instance, production scheduling software for aerospace manufacturing must handle extreme complexity and regulatory oversight, often using digital twins for production simulation to validate every step.
  • In contrast, production scheduling for just-in-time inventory in the automotive sector focuses on seamless MES integration. The debate over cloud vs. on-premise production scheduling continues, with hybrid models emerging as a popular compromise to manage cybersecurity in cloud production scheduling software while keeping critical data localized.
  • The benefits of AI in production scheduling are universally acknowledged, particularly in AI-based scheduling for semiconductor fabrication, where precision is paramount. The role of scheduling software in Industry 4.0 is central, enabling firms to manage supply chain disruptions with scheduling tools that offer real-time visibility.
  • While the cost of implementing production scheduling software can be a barrier, the ROI is clear, especially for production scheduling software for custom manufacturing, which requires immense flexibility. Solutions are tailored for different scales, from production scheduling software for large enterprises to SaaS production scheduling for SMEs, which offers affordability and scalability.
  • Ultimately, improving OEE with production scheduling software is a key goal, achieved through predictive maintenance scheduling software integration and leveraging real-time production scheduling software features to optimize operations.

What are the key market drivers leading to the rise in the adoption of Production Scheduling Software Industry?

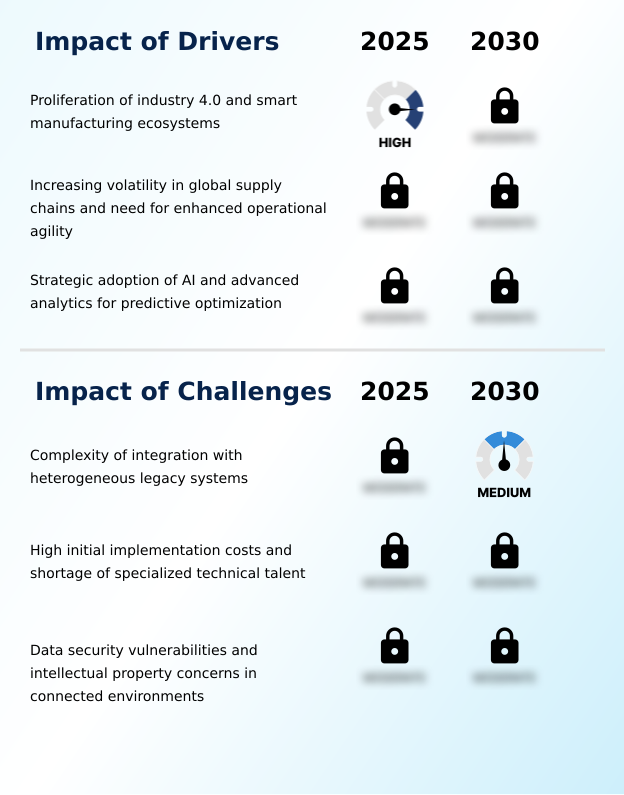
  • The proliferation of Industry 4.0 and smart manufacturing ecosystems is a key driver for the market.

  • Market growth is fueled by the widespread adoption of Industry 4.0 principles, transforming factories into smart factory ecosystems.
  • This digital transformation journey is driven by the need to manage supply chain volatility, with advanced platforms enabling manufacturers to reduce lead times by up to 30%.
  • The strategic adoption of AI-driven scheduling and predictive and prescriptive optimization allows for data-driven decision-making, significantly boosting overall equipment effectiveness by an average of 20%.
  • As industrial automation deepens, the reliance on sophisticated software for orchestrating high-mix, low-volume production becomes critical. This environment demands operational agility, which these systems provide by enabling rapid rescheduling and optimizing production throughput in response to real-time events and disruptions.

What are the market trends shaping the Production Scheduling Software Industry?

  • The integration of generative AI and natural language interfaces is an emerging market trend. This shift is redefining user interaction with complex scheduling systems.

  • Key trends are reshaping user interaction and operational strategy. The integration of generative AI is moving the industry toward conversational interfaces, where natural language processing allows planners to query complex schedules, improving decision-making speed by up to 40%.
  • The shift toward energy-aware scheduling is gaining momentum, driven by sustainability goals; firms are reporting energy consumption reductions of over 15% by aligning production with low-cost energy periods. Furthermore, the convergence of edge computing agents with industrial interoperability enables autonomous rescheduling at the machine level, cutting data latency by more than 50% in high-speed environments.
  • This decentralization makes the production schedule a dynamic asset, reflecting the real-time state of the factory floor and enabling a more responsive and efficient circular manufacturing model.

What challenges does the Production Scheduling Software Industry face during its growth?

  • The complexity of integrating modern software with heterogeneous legacy systems presents a key challenge to industry growth.

  • Significant challenges constrain widespread adoption, led by the complexity of integrating with heterogeneous legacy systems, which can inflate implementation costs by up to 50%. A pronounced shortage of specialized technical talent further complicates the deployment and management of these sophisticated platforms, leading to underutilization.
  • Additionally, the move toward interconnected, cloud-based deployment models introduces heightened data security vulnerabilities and intellectual property concerns. Manufacturers remain cautious due to cybersecurity risks, with reports of industrial cyber-attacks increasing by 25% annually. Overcoming these hurdles requires substantial investment and a strategic approach to managing organizational change, data governance, and the total cost of ownership, especially for smaller enterprises.

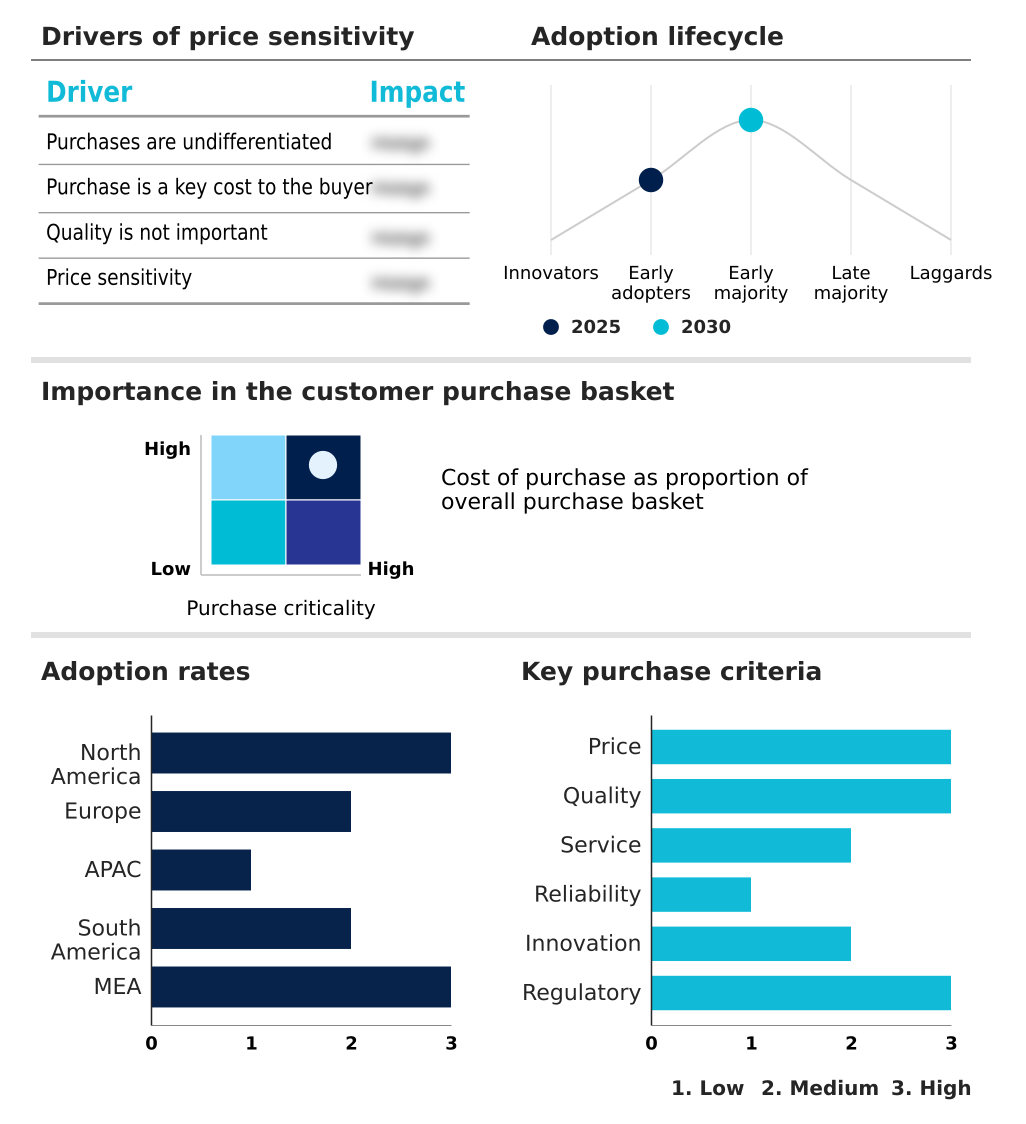
Exclusive Technavio Analysis on Customer Landscape

The production scheduling software market forecasting report includes the adoption lifecycle of the market, covering from the innovator’s stage to the laggard’s stage. It focuses on adoption rates in different regions based on penetration. Furthermore, the production scheduling software market report also includes key purchase criteria and drivers of price sensitivity to help companies evaluate and develop their market growth analysis strategies.

Customer Landscape of Production Scheduling Software Industry

Competitive Landscape

Companies are implementing various strategies, such as strategic alliances, production scheduling software market forecast, partnerships, mergers and acquisitions, geographical expansion, and product/service launches, to enhance their presence in the industry.

Asprova Corp. - Offerings include advanced planning and scheduling (APS) systems designed to optimize factory floor operations through real-time data integration and predictive analytics.

The industry research and growth report includes detailed analyses of the competitive landscape of the market and information about key companies, including:

  • Asprova Corp.
  • Blue Yonder Group Inc.
  • Dassault Systemes SE
  • E2open Parent Holdings Inc.
  • ECI Software Solutions Inc.
  • Epicor Software Corp.
  • Global Shop Solutions Inc.
  • IFS
  • Infor Inc.
  • Katana Technologies OU
  • Kinaxis Inc.
  • Logility SCS Inc.
  • OMP
  • Oracle Corp.
  • PlanetTogether Inc.
  • Plex Systems Inc.
  • QAD Inc.
  • SAP SE
  • Siemens AG
  • SYSPRO Pty. Ltd.

Qualitative and quantitative analysis of companies has been conducted to help clients understand the wider business environment as well as the strengths and weaknesses of key industry players. Data is qualitatively analyzed to categorize companies as pure play, category-focused, industry-focused, and diversified; it is quantitatively analyzed to categorize companies as dominant, leading, strong, tentative, and weak.

Recent Development and News in Production scheduling software market

  • In April 2025, Rockwell Automation introduced generative AI capabilities within its FactoryTalk Optix software suite, enabling planners to use natural language queries for real-time schedule modifications and simulations.
  • In May 2025, Honeywell International Inc. enhanced its Forge Performance+ for Industrial platform with production scheduling features tailored for the life sciences sector to manage supply chain disruptions.
  • In May 2025, Microsoft Corporation expanded its Azure manufacturing suite with a dedicated production scheduling module for the electronics industry, focusing on component shortage visibility and automated rescheduling.
  • In March 2025, Dassault Systemes announced an update to its DELMIA planning platforms, featuring cognitive optimization engines to automate complex scheduling decisions in high-volume manufacturing environments.

Dive into Technavio’s robust research methodology, blending expert interviews, extensive data synthesis, and validated models for unparalleled Production Scheduling Software Market insights. See full methodology.

Market Scope
Page number 305
Base year 2025
Historic period 2020-2024
Forecast period 2026-2030
Growth momentum & CAGR Accelerate at a CAGR of 11.7%
Market growth 2026-2030 USD 1181.1 million
Market structure Fragmented
YoY growth 2025-2026(%) 10.5%
Key countries US, Canada, Mexico, Germany, UK, France, Italy, The Netherlands, Spain, China, Japan, India, South Korea, Australia, Indonesia, Brazil, Argentina, Colombia, Saudi Arabia, UAE, South Africa, Israel and Turkey
Competitive landscape Leading Companies, Market Positioning of Companies, Competitive Strategies, and Industry Risks

Request Free Sample

Research Analyst Overview

  • The market's evolution is centered on the strategic deployment of cognitive optimization engines and predictive analytics engines to achieve new levels of operational excellence. Successful implementation of production planning software and resource allocation software is now deeply tied to a firm's ability to harness real-time data processing through the industrial internet of things.
  • Boardroom decisions are increasingly influenced by the capability of energy-aware scheduling to meet ESG mandates, which has become as critical as cycle time optimization. The adoption of digital twin technology allows for what-if scenario analysis without disrupting the shop floor, a crucial advantage in high-stakes industries.
  • Platforms are defined by their capacity for autonomous rescheduling and rapid rescheduling, supported by machine learning models and generative AI integration. This shift to intelligent automation, evident in firms achieving a 30% reduction in planning cycle times, underscores the move from passive tools to proactive, autonomous decision-making partners.
  • The success of this transition depends on seamless enterprise resource planning integration and open application programming interfaces to create a unified manufacturing execution system.

What are the Key Data Covered in this Production Scheduling Software Market Research and Growth Report?

  • What is the expected growth of the Production Scheduling Software Market between 2026 and 2030?

    • USD 1.18 billion, at a CAGR of 11.7%

  • What segmentation does the market report cover?

    • The report is segmented by Deployment (On premise, Cloud based, and Hybrid), End-user (Large enterprises, and SMEs), Application (Production planning, Capacity planning, Resource allocation, Inventory scheduling, and Workflow optimization) and Geography (North America, Europe, APAC, South America, Middle East and Africa)

  • Which regions are analyzed in the report?

    • North America, Europe, APAC, South America and Middle East and Africa

  • What are the key growth drivers and market challenges?

    • Proliferation of industry 4.0 and smart manufacturing ecosystems, Complexity of integration with heterogeneous legacy systems

  • Who are the major players in the Production Scheduling Software Market?

    • Asprova Corp., Blue Yonder Group Inc., Dassault Systemes SE, E2open Parent Holdings Inc., ECI Software Solutions Inc., Epicor Software Corp., Global Shop Solutions Inc., IFS, Infor Inc., Katana Technologies OU, Kinaxis Inc., Logility SCS Inc., OMP, Oracle Corp., PlanetTogether Inc., Plex Systems Inc., QAD Inc., SAP SE, Siemens AG and SYSPRO Pty. Ltd.

Market Research Insights

  • Market dynamics are defined by a push for greater manufacturing agility and resilience in response to sustained supply chain volatility. The adoption of advanced planning and scheduling systems has become critical, with firms reporting up to a 25% improvement in on-time delivery rates.
  • As organizations advance their digital transformation journey, there is a clear focus on data-driven decision-making to optimize production throughput. This strategic shift is enabling manufacturers to reduce total cost of ownership by 15% through better resource utilization and minimized waste.
  • The move toward smart factory ecosystems leverages industrial automation and decentralized decision-making to enhance operational agility, allowing for rapid adaptation to market changes.

We can help! Our analysts can customize this production scheduling software market research report to meet your requirements.

Get in touch

1. Executive Summary

1.1 Market overview

Executive Summary - Chart on Market Overview
Executive Summary - Data Table on Market Overview
Executive Summary - Chart on Global Market Characteristics
Executive Summary - Chart on Market by Geography
Executive Summary - Chart on Market Segmentation by Deployment
Executive Summary - Chart on Market Segmentation by End-user
Executive Summary - Chart on Market Segmentation by Application
Executive Summary - Chart on Incremental Growth
Executive Summary - Data Table on Incremental Growth
Executive Summary - Chart on Company Market Positioning

2. Technavio Analysis

2.1 Analysis of price sensitivity, lifecycle, customer purchase basket, adoption rates, and purchase criteria

2.2 Criticality of inputs and Factors of differentiation

Chart on Overview on criticality of inputs and factors of differentiation

2.3 Factors of disruption

Chart on Overview on factors of disruption

2.4 Impact of drivers and challenges

Chart on Impact of drivers and challenges in 2025 and 2030

3. Market Landscape

3.1 Market ecosystem

Chart on Parent Market
Data Table on - Parent Market

3.2 Market characteristics

Chart on Market characteristics analysis

3.3 Value chain analysis

Chart on Value chain analysis

4. Market Sizing

4.1 Market definition

Data Table on Offerings of companies included in the market definition

4.2 Market segment analysis

Market segments

4.3 Market size 2025

4.4 Market outlook: Forecast for 2025-2030

Chart on Global - Market size and forecast 2025-2030 ($ million)
Data Table on Global - Market size and forecast 2025-2030 ($ million)
Chart on Global Market: Year-over-year growth 2025-2030 (%)
Data Table on Global Market: Year-over-year growth 2025-2030 (%)

5. Historic Market Size

5.1 Global Production Scheduling Software Market 2020 - 2024

Historic Market Size - Data Table on Global Production Scheduling Software Market 2020 - 2024 ($ million)

5.2 Deployment segment analysis 2020 - 2024

Historic Market Size - Deployment Segment 2020 - 2024 ($ million)

5.3 End-user segment analysis 2020 - 2024

Historic Market Size - End-user Segment 2020 - 2024 ($ million)

5.4 Application segment analysis 2020 - 2024

Historic Market Size - Application Segment 2020 - 2024 ($ million)

5.5 Geography segment analysis 2020 - 2024

Historic Market Size - Geography Segment 2020 - 2024 ($ million)

5.6 Country segment analysis 2020 - 2024

Historic Market Size - Country Segment 2020 - 2024 ($ million)

6. Qualitative Analysis

6.1 Impact of AI on Global Production Scheduling Software Market

6.2 Impact of geopolitical conflicts on Global Production Scheduling Software Market

7. Five Forces Analysis

7.1 Five forces summary

Five forces analysis - Comparison between 2025 and 2030

7.2 Bargaining power of buyers

Bargaining power of buyers - Impact of key factors 2025 and 2030

7.3 Bargaining power of suppliers

Bargaining power of suppliers - Impact of key factors in 2025 and 2030

7.4 Threat of new entrants

Threat of new entrants - Impact of key factors in 2025 and 2030

7.5 Threat of substitutes

Threat of substitutes - Impact of key factors in 2025 and 2030

7.6 Threat of rivalry

Threat of rivalry - Impact of key factors in 2025 and 2030

7.7 Market condition

Chart on Market condition - Five forces 2025 and 2030

8. Market Segmentation by Deployment

8.1 Market segments

Chart on Deployment - Market share 2025-2030 (%)
Data Table on Deployment - Market share 2025-2030 (%)

8.2 Comparison by Deployment

Chart on Comparison by Deployment
Data Table on Comparison by Deployment

8.3 On premise - Market size and forecast 2025-2030

Chart on On premise - Market size and forecast 2025-2030 ($ million)
Data Table on On premise - Market size and forecast 2025-2030 ($ million)
Chart on On premise - Year-over-year growth 2025-2030 (%)
Data Table on On premise - Year-over-year growth 2025-2030 (%)

8.4 Cloud based - Market size and forecast 2025-2030

Chart on Cloud based - Market size and forecast 2025-2030 ($ million)
Data Table on Cloud based - Market size and forecast 2025-2030 ($ million)
Chart on Cloud based - Year-over-year growth 2025-2030 (%)
Data Table on Cloud based - Year-over-year growth 2025-2030 (%)

8.5 Hybrid - Market size and forecast 2025-2030

Chart on Hybrid - Market size and forecast 2025-2030 ($ million)
Data Table on Hybrid - Market size and forecast 2025-2030 ($ million)
Chart on Hybrid - Year-over-year growth 2025-2030 (%)
Data Table on Hybrid - Year-over-year growth 2025-2030 (%)

8.6 Market opportunity by Deployment

Market opportunity by Deployment ($ million)
Data Table on Market opportunity by Deployment ($ million)

9. Market Segmentation by End-user

9.1 Market segments

Chart on End-user - Market share 2025-2030 (%)
Data Table on End-user - Market share 2025-2030 (%)

9.2 Comparison by End-user

Chart on Comparison by End-user
Data Table on Comparison by End-user

9.3 Large enterprises - Market size and forecast 2025-2030

Chart on Large enterprises - Market size and forecast 2025-2030 ($ million)
Data Table on Large enterprises - Market size and forecast 2025-2030 ($ million)
Chart on Large enterprises - Year-over-year growth 2025-2030 (%)
Data Table on Large enterprises - Year-over-year growth 2025-2030 (%)

9.4 SMEs - Market size and forecast 2025-2030

Chart on SMEs - Market size and forecast 2025-2030 ($ million)
Data Table on SMEs - Market size and forecast 2025-2030 ($ million)
Chart on SMEs - Year-over-year growth 2025-2030 (%)
Data Table on SMEs - Year-over-year growth 2025-2030 (%)

9.5 Market opportunity by End-user

Market opportunity by End-user ($ million)
Data Table on Market opportunity by End-user ($ million)

10. Market Segmentation by Application

10.1 Market segments

Chart on Application - Market share 2025-2030 (%)
Data Table on Application - Market share 2025-2030 (%)

10.2 Comparison by Application

Chart on Comparison by Application
Data Table on Comparison by Application

10.3 Production planning - Market size and forecast 2025-2030

Chart on Production planning - Market size and forecast 2025-2030 ($ million)
Data Table on Production planning - Market size and forecast 2025-2030 ($ million)
Chart on Production planning - Year-over-year growth 2025-2030 (%)
Data Table on Production planning - Year-over-year growth 2025-2030 (%)

10.4 Capacity planning - Market size and forecast 2025-2030

Chart on Capacity planning - Market size and forecast 2025-2030 ($ million)
Data Table on Capacity planning - Market size and forecast 2025-2030 ($ million)
Chart on Capacity planning - Year-over-year growth 2025-2030 (%)
Data Table on Capacity planning - Year-over-year growth 2025-2030 (%)

10.5 Resource allocation - Market size and forecast 2025-2030

Chart on Resource allocation - Market size and forecast 2025-2030 ($ million)
Data Table on Resource allocation - Market size and forecast 2025-2030 ($ million)
Chart on Resource allocation - Year-over-year growth 2025-2030 (%)
Data Table on Resource allocation - Year-over-year growth 2025-2030 (%)

10.6 Inventory scheduling - Market size and forecast 2025-2030

Chart on Inventory scheduling - Market size and forecast 2025-2030 ($ million)
Data Table on Inventory scheduling - Market size and forecast 2025-2030 ($ million)
Chart on Inventory scheduling - Year-over-year growth 2025-2030 (%)
Data Table on Inventory scheduling - Year-over-year growth 2025-2030 (%)

10.7 Workflow optimization - Market size and forecast 2025-2030

Chart on Workflow optimization - Market size and forecast 2025-2030 ($ million)
Data Table on Workflow optimization - Market size and forecast 2025-2030 ($ million)
Chart on Workflow optimization - Year-over-year growth 2025-2030 (%)
Data Table on Workflow optimization - Year-over-year growth 2025-2030 (%)

10.8 Market opportunity by Application

Market opportunity by Application ($ million)
Data Table on Market opportunity by Application ($ million)

11. Customer Landscape

11.1 Customer landscape overview

Analysis of price sensitivity, lifecycle, customer purchase basket, adoption rates, and purchase criteria

12. Geographic Landscape

12.1 Geographic segmentation

Chart on Market share by geography 2025-2030 (%)
Data Table on Market share by geography 2025-2030 (%)

12.2 Geographic comparison

Chart on Geographic comparison
Data Table on Geographic comparison

12.3 North America - Market size and forecast 2025-2030

Chart on North America - Market size and forecast 2025-2030 ($ million)
Data Table on North America - Market size and forecast 2025-2030 ($ million)
Chart on North America - Year-over-year growth 2025-2030 (%)
Data Table on North America - Year-over-year growth 2025-2030 (%)
Chart on Regional Comparison - North America
Data Table on Regional Comparison - North America

12.3.1 US - Market size and forecast 2025-2030

Chart on US - Market size and forecast 2025-2030 ($ million)
Data Table on US - Market size and forecast 2025-2030 ($ million)
Chart on US - Year-over-year growth 2025-2030 (%)
Data Table on US - Year-over-year growth 2025-2030 (%)

12.3.2 Canada - Market size and forecast 2025-2030

Chart on Canada - Market size and forecast 2025-2030 ($ million)
Data Table on Canada - Market size and forecast 2025-2030 ($ million)
Chart on Canada - Year-over-year growth 2025-2030 (%)
Data Table on Canada - Year-over-year growth 2025-2030 (%)

12.3.3 Mexico - Market size and forecast 2025-2030

Chart on Mexico - Market size and forecast 2025-2030 ($ million)
Data Table on Mexico - Market size and forecast 2025-2030 ($ million)
Chart on Mexico - Year-over-year growth 2025-2030 (%)
Data Table on Mexico - Year-over-year growth 2025-2030 (%)

12.4 Europe - Market size and forecast 2025-2030

Chart on Europe - Market size and forecast 2025-2030 ($ million)
Data Table on Europe - Market size and forecast 2025-2030 ($ million)
Chart on Europe - Year-over-year growth 2025-2030 (%)
Data Table on Europe - Year-over-year growth 2025-2030 (%)
Chart on Regional Comparison - Europe
Data Table on Regional Comparison - Europe

12.4.1 Germany - Market size and forecast 2025-2030

Chart on Germany - Market size and forecast 2025-2030 ($ million)
Data Table on Germany - Market size and forecast 2025-2030 ($ million)
Chart on Germany - Year-over-year growth 2025-2030 (%)
Data Table on Germany - Year-over-year growth 2025-2030 (%)

12.4.2 UK - Market size and forecast 2025-2030

Chart on UK - Market size and forecast 2025-2030 ($ million)
Data Table on UK - Market size and forecast 2025-2030 ($ million)
Chart on UK - Year-over-year growth 2025-2030 (%)
Data Table on UK - Year-over-year growth 2025-2030 (%)

12.4.3 France - Market size and forecast 2025-2030

Chart on France - Market size and forecast 2025-2030 ($ million)
Data Table on France - Market size and forecast 2025-2030 ($ million)
Chart on France - Year-over-year growth 2025-2030 (%)
Data Table on France - Year-over-year growth 2025-2030 (%)

12.4.4 Italy - Market size and forecast 2025-2030

Chart on Italy - Market size and forecast 2025-2030 ($ million)
Data Table on Italy - Market size and forecast 2025-2030 ($ million)
Chart on Italy - Year-over-year growth 2025-2030 (%)
Data Table on Italy - Year-over-year growth 2025-2030 (%)

12.4.5 The Netherlands - Market size and forecast 2025-2030

Chart on The Netherlands - Market size and forecast 2025-2030 ($ million)
Data Table on The Netherlands - Market size and forecast 2025-2030 ($ million)
Chart on The Netherlands - Year-over-year growth 2025-2030 (%)
Data Table on The Netherlands - Year-over-year growth 2025-2030 (%)

12.4.6 Spain - Market size and forecast 2025-2030

Chart on Spain - Market size and forecast 2025-2030 ($ million)
Data Table on Spain - Market size and forecast 2025-2030 ($ million)
Chart on Spain - Year-over-year growth 2025-2030 (%)
Data Table on Spain - Year-over-year growth 2025-2030 (%)

12.5 APAC - Market size and forecast 2025-2030

Chart on APAC - Market size and forecast 2025-2030 ($ million)
Data Table on APAC - Market size and forecast 2025-2030 ($ million)
Chart on APAC - Year-over-year growth 2025-2030 (%)
Data Table on APAC - Year-over-year growth 2025-2030 (%)
Chart on Regional Comparison - APAC
Data Table on Regional Comparison - APAC

12.5.1 China - Market size and forecast 2025-2030

Chart on China - Market size and forecast 2025-2030 ($ million)
Data Table on China - Market size and forecast 2025-2030 ($ million)
Chart on China - Year-over-year growth 2025-2030 (%)
Data Table on China - Year-over-year growth 2025-2030 (%)

12.5.2 Japan - Market size and forecast 2025-2030

Chart on Japan - Market size and forecast 2025-2030 ($ million)
Data Table on Japan - Market size and forecast 2025-2030 ($ million)
Chart on Japan - Year-over-year growth 2025-2030 (%)
Data Table on Japan - Year-over-year growth 2025-2030 (%)

12.5.3 India - Market size and forecast 2025-2030

Chart on India - Market size and forecast 2025-2030 ($ million)
Data Table on India - Market size and forecast 2025-2030 ($ million)
Chart on India - Year-over-year growth 2025-2030 (%)
Data Table on India - Year-over-year growth 2025-2030 (%)

12.5.4 South Korea - Market size and forecast 2025-2030

Chart on South Korea - Market size and forecast 2025-2030 ($ million)
Data Table on South Korea - Market size and forecast 2025-2030 ($ million)
Chart on South Korea - Year-over-year growth 2025-2030 (%)
Data Table on South Korea - Year-over-year growth 2025-2030 (%)

12.5.5 Australia - Market size and forecast 2025-2030

Chart on Australia - Market size and forecast 2025-2030 ($ million)
Data Table on Australia - Market size and forecast 2025-2030 ($ million)
Chart on Australia - Year-over-year growth 2025-2030 (%)
Data Table on Australia - Year-over-year growth 2025-2030 (%)

12.5.6 Indonesia - Market size and forecast 2025-2030

Chart on Indonesia - Market size and forecast 2025-2030 ($ million)
Data Table on Indonesia - Market size and forecast 2025-2030 ($ million)
Chart on Indonesia - Year-over-year growth 2025-2030 (%)
Data Table on Indonesia - Year-over-year growth 2025-2030 (%)

12.6 South America - Market size and forecast 2025-2030

Chart on South America - Market size and forecast 2025-2030 ($ million)
Data Table on South America - Market size and forecast 2025-2030 ($ million)
Chart on South America - Year-over-year growth 2025-2030 (%)
Data Table on South America - Year-over-year growth 2025-2030 (%)
Chart on Regional Comparison - South America
Data Table on Regional Comparison - South America

12.6.1 Brazil - Market size and forecast 2025-2030

Chart on Brazil - Market size and forecast 2025-2030 ($ million)
Data Table on Brazil - Market size and forecast 2025-2030 ($ million)
Chart on Brazil - Year-over-year growth 2025-2030 (%)
Data Table on Brazil - Year-over-year growth 2025-2030 (%)

12.6.2 Argentina - Market size and forecast 2025-2030

Chart on Argentina - Market size and forecast 2025-2030 ($ million)
Data Table on Argentina - Market size and forecast 2025-2030 ($ million)
Chart on Argentina - Year-over-year growth 2025-2030 (%)
Data Table on Argentina - Year-over-year growth 2025-2030 (%)

12.6.3 Colombia - Market size and forecast 2025-2030

Chart on Colombia - Market size and forecast 2025-2030 ($ million)
Data Table on Colombia - Market size and forecast 2025-2030 ($ million)
Chart on Colombia - Year-over-year growth 2025-2030 (%)
Data Table on Colombia - Year-over-year growth 2025-2030 (%)

12.7 Middle East and Africa - Market size and forecast 2025-2030

Chart on Middle East and Africa - Market size and forecast 2025-2030 ($ million)
Data Table on Middle East and Africa - Market size and forecast 2025-2030 ($ million)
Chart on Middle East and Africa - Year-over-year growth 2025-2030 (%)
Data Table on Middle East and Africa - Year-over-year growth 2025-2030 (%)
Chart on Regional Comparison - Middle East and Africa
Data Table on Regional Comparison - Middle East and Africa

12.7.1 Saudi Arabia - Market size and forecast 2025-2030

Chart on Saudi Arabia - Market size and forecast 2025-2030 ($ million)
Data Table on Saudi Arabia - Market size and forecast 2025-2030 ($ million)
Chart on Saudi Arabia - Year-over-year growth 2025-2030 (%)
Data Table on Saudi Arabia - Year-over-year growth 2025-2030 (%)

12.7.2 UAE - Market size and forecast 2025-2030

Chart on UAE - Market size and forecast 2025-2030 ($ million)
Data Table on UAE - Market size and forecast 2025-2030 ($ million)
Chart on UAE - Year-over-year growth 2025-2030 (%)
Data Table on UAE - Year-over-year growth 2025-2030 (%)

12.7.3 South Africa - Market size and forecast 2025-2030

Chart on South Africa - Market size and forecast 2025-2030 ($ million)
Data Table on South Africa - Market size and forecast 2025-2030 ($ million)
Chart on South Africa - Year-over-year growth 2025-2030 (%)
Data Table on South Africa - Year-over-year growth 2025-2030 (%)

12.7.4 Israel - Market size and forecast 2025-2030

Chart on Israel - Market size and forecast 2025-2030 ($ million)
Data Table on Israel - Market size and forecast 2025-2030 ($ million)
Chart on Israel - Year-over-year growth 2025-2030 (%)
Data Table on Israel - Year-over-year growth 2025-2030 (%)

12.7.5 Turkey - Market size and forecast 2025-2030

Chart on Turkey - Market size and forecast 2025-2030 ($ million)
Data Table on Turkey - Market size and forecast 2025-2030 ($ million)
Chart on Turkey - Year-over-year growth 2025-2030 (%)
Data Table on Turkey - Year-over-year growth 2025-2030 (%)

12.8 Market opportunity by geography

Market opportunity by geography ($ million)
Data Tables on Market opportunity by geography ($ million)

13. Drivers, Challenges, and Opportunity

13.1 Market drivers

Proliferation of industry 4.0 and smart manufacturing ecosystems
Increasing volatility in global supply chains and need for enhanced operational agility
Strategic adoption of AI and advanced analytics for predictive optimization

13.2 Market challenges

Complexity of integration with heterogeneous legacy systems
High initial implementation costs and shortage of specialized technical talent
Data security vulnerabilities and intellectual property concerns in connected environments

13.3 Impact of drivers and challenges

Impact of drivers and challenges in 2025 and 2030

13.4 Market opportunities

Integration of generative AI and natural language interfaces
Shift toward energy-aware scheduling and environmental sustainability
Convergence of edge computing and real-time industrial interoperability

14. Competitive Landscape

14.1 Overview

14.2

Overview on criticality of inputs and factors of differentiation

14.3 Landscape disruption

Overview on factors of disruption

14.4 Industry risks

Impact of key risks on business

15. Competitive Analysis

15.1 Companies profiled

Companies covered

15.2 Company ranking index

15.3 Market positioning of companies

Matrix on companies position and classification

15.4 Asprova Corp.

Asprova Corp. - Overview
Asprova Corp. - Product / Service
Asprova Corp. - Key offerings
SWOT

15.5 Blue Yonder Group Inc.

Blue Yonder Group Inc. - Overview
Blue Yonder Group Inc. - Product / Service
Blue Yonder Group Inc. - Key offerings
SWOT

15.6 Dassault Systemes SE

Dassault Systemes SE - Overview
Dassault Systemes SE - Business segments
Dassault Systemes SE - Key offerings
Dassault Systemes SE - Segment focus
SWOT

15.7 ECI Software Solutions Inc.

ECI Software Solutions Inc. - Overview
ECI Software Solutions Inc. - Product / Service
ECI Software Solutions Inc. - Key offerings
SWOT

15.8 Epicor Software Corp.

Epicor Software Corp. - Overview
Epicor Software Corp. - Product / Service
Epicor Software Corp. - Key news
Epicor Software Corp. - Key offerings
SWOT

15.9 Global Shop Solutions Inc.

Global Shop Solutions Inc. - Overview
Global Shop Solutions Inc. - Product / Service
Global Shop Solutions Inc. - Key offerings
SWOT

15.10 Katana Technologies OU

Katana Technologies OU - Overview
Katana Technologies OU - Product / Service
Katana Technologies OU - Key offerings
SWOT

15.11 Kinaxis Inc.

Kinaxis Inc. - Overview
Kinaxis Inc. - Product / Service
Kinaxis Inc. - Key offerings
SWOT

15.12 OMP

OMP - Overview
OMP - Product / Service
OMP - Key offerings
SWOT

15.13 Oracle Corp.

Oracle Corp. - Overview
Oracle Corp. - Business segments
Oracle Corp. - Key news
Oracle Corp. - Key offerings
Oracle Corp. - Segment focus
SWOT

15.14 PlanetTogether Inc.

PlanetTogether Inc. - Overview
PlanetTogether Inc. - Product / Service
PlanetTogether Inc. - Key offerings
SWOT

15.15 Plex Systems Inc.

Plex Systems Inc. - Overview
Plex Systems Inc. - Product / Service
Plex Systems Inc. - Key offerings
SWOT

15.16 SAP SE

SAP SE - Overview
SAP SE - Business segments
SAP SE - Key news
SAP SE - Key offerings
SAP SE - Segment focus
SWOT

15.17 Siemens AG

Siemens AG - Overview
Siemens AG - Business segments
Siemens AG - Key news
Siemens AG - Key offerings
Siemens AG - Segment focus
SWOT

15.18 SYSPRO Pty. Ltd.

SYSPRO Pty. Ltd. - Overview
SYSPRO Pty. Ltd. - Product / Service
SYSPRO Pty. Ltd. - Key offerings
SWOT

16. Appendix

16.1 Scope of the report

Market definition
Objectives
Notes and caveats

16.2 Inclusions and exclusions checklist

Inclusions checklist
Exclusions checklist

16.3 Currency conversion rates for US$

16.4 Research methodology

16.5 Data procurement

Information sources

16.6 Data validation

16.7 Validation techniques employed for market sizing

16.8 Data synthesis

16.9 360 degree market analysis

16.10 List of abbreviations

Research Methodology

Technavio presents a detailed picture of the market by way of study, synthesis, and summation of data from multiple sources. The analysts have presented the various facets of the market with a particular focus on identifying the key industry influencers. The data thus presented is comprehensive, reliable, and the result of extensive research, both primary and secondary.

INFORMATION SOURCES

Primary sources

  • Manufacturers and suppliers
  • Channel partners
  • Industry experts
  • Strategic decision makers

Secondary sources

  • Industry journals and periodicals
  • Government data
  • Financial reports of key industry players
  • Historical data
  • Press releases

DATA ANALYSIS

Data Synthesis

  • Collation of data
  • Estimation of key figures
  • Analysis of derived insights

Data Validation

  • Triangulation with data models
  • Reference against proprietary databases
  • Corroboration with industry experts

REPORT WRITING

Qualitative

  • Market drivers
  • Market challenges
  • Market trends
  • Five forces analysis

Quantitative

  • Market size and forecast
  • Market segmentation
  • Geographical insights
  • Competitive landscape

Interested in this report?

Get your sample now to see our research methodology and insights!

Download Now

Frequently Asked Questions

Production Scheduling Software market growth will increase by USD 1181.1 million during 2026-2030.

The Production Scheduling Software market is expected to grow at a CAGR of 11.7% during 2026-2030.

Production Scheduling Software market is segmented by Deployment (On premise, Cloud based, Hybrid) End-user (Large enterprises, SMEs) Application (Production planning, Capacity planning, Resource allocation, Inventory scheduling, Workflow optimization)

Asprova Corp., Blue Yonder Group Inc., Dassault Systemes SE, E2open Parent Holdings Inc., ECI Software Solutions Inc., Epicor Software Corp., Global Shop Solutions Inc., IFS, Infor Inc., Katana Technologies OU, Kinaxis Inc., Logility SCS Inc., OMP, Oracle Corp., PlanetTogether Inc., Plex Systems Inc., QAD Inc., SAP SE, Siemens AG, SYSPRO Pty. Ltd. are a few of the key vendors in the Production Scheduling Software market.

North America will register the highest growth rate of 36.8% among the other regions. Therefore, the Production Scheduling Software market in North America is expected to garner significant business opportunities for the vendors during the forecast period.

US, Canada, Mexico, Germany, UK, France, Italy, The Netherlands, Spain, China, Japan, India, South Korea, Australia, Indonesia, Brazil, Argentina, Colombia, Saudi Arabia, UAE, South Africa, Israel, Turkey

  • Proliferation of industry 4.0 and smart manufacturing ecosystems is the driving factor this market.

The Production Scheduling Software market vendors should focus on grabbing business opportunities from the Deployment segment as it accounted for the largest market share in the base year.
RIA - Research AI Assistant
Ask RIA