Public Sector Cybersecurity Market Analysis, Size, and Forecast 2026-2030: North America (US, Canada, and Mexico), Europe (UK, Germany, and France), APAC (China, Japan, and India), Middle East and Africa (Saudi Arabia, UAE, and South Africa), South America (Brazil, Argentina, and Colombia), and Rest of World (ROW)

Public Sector Cybersecurity Market Analysis, Size, and Forecast 2026-2030:
North America (US, Canada, and Mexico), Europe (UK, Germany, and France), APAC (China, Japan, and India), Middle East and Africa (Saudi Arabia, UAE, and South Africa), South America (Brazil, Argentina, and Colombia), and Rest of World (ROW)

Published: Apr 2026 312 Pages SKU: IRTNTR81428

Market Overview at a Glance

$62.92 B
Market Opportunity
11.7%
CAGR 2025 - 2030
33.2%
North America Growth
$26.72 B
Network security segment 2024

Public Sector Cybersecurity Market Size 2026-2030

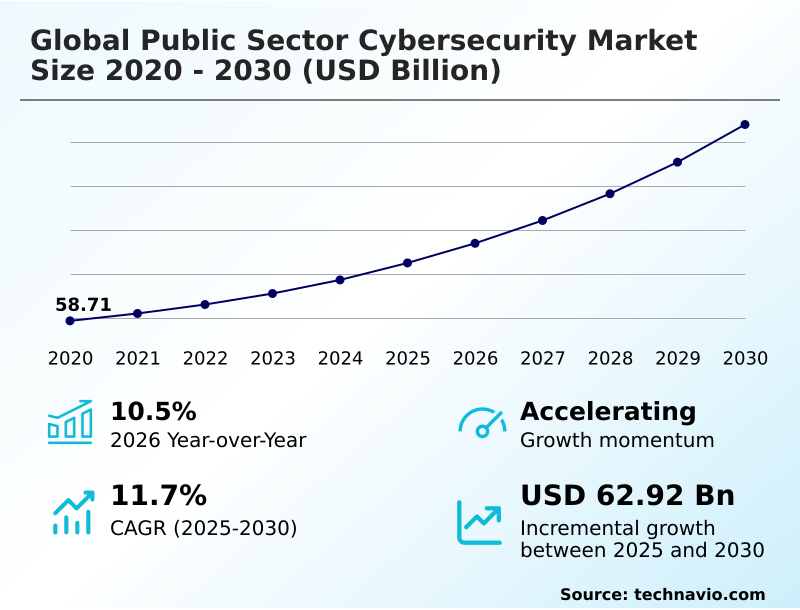
The public sector cybersecurity market size is valued to increase by USD 62.92 billion, at a CAGR of 11.7% from 2025 to 2030. Increasing frequency and complexity of state sponsored threats will drive the public sector cybersecurity market.

Major Market Trends & Insights

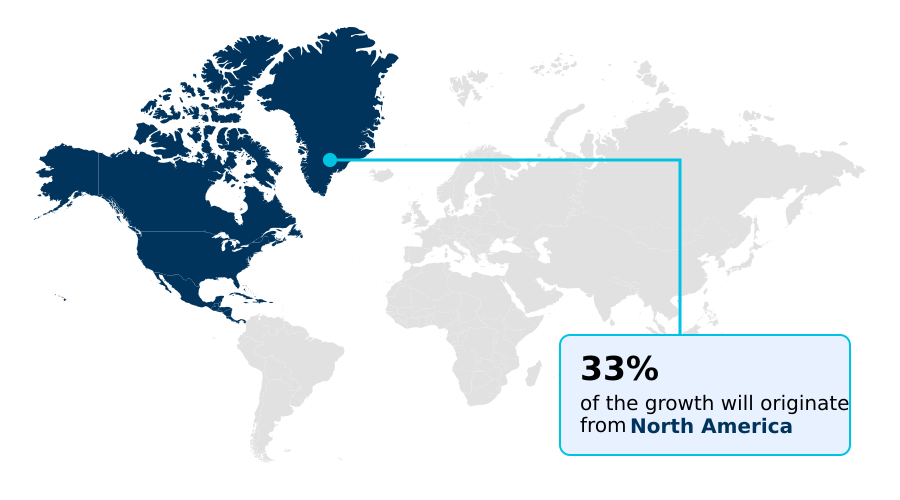
  • North America dominated the market and accounted for a 33.2% growth during the forecast period.
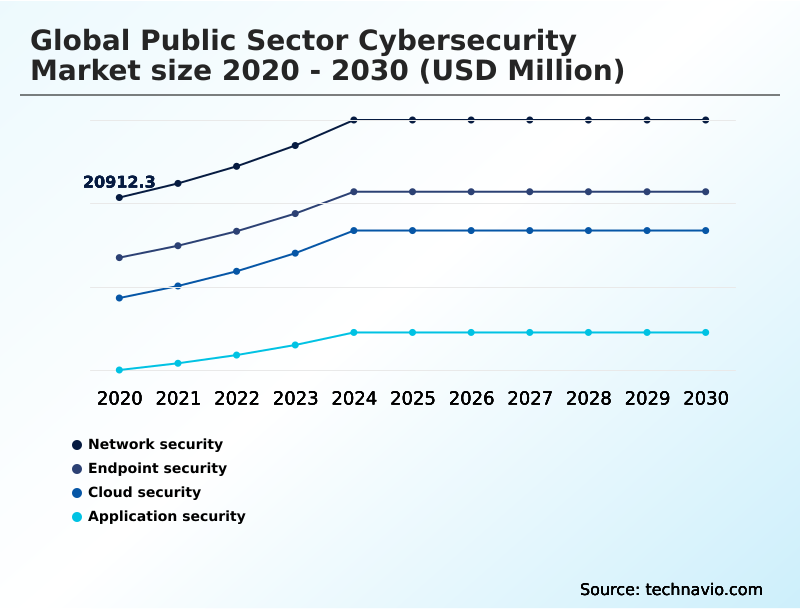
  • By Type - Network security segment was valued at USD 26.72 billion in 2024
  • By End-user - Government agencies segment accounted for the largest market revenue share in 2024

Market Size & Forecast

  • Market Opportunities: USD 89.25 billion
  • Market Future Opportunities: USD 62.92 billion
  • CAGR from 2025 to 2030 : 11.7%

Market Summary

  • The public sector cybersecurity market is undergoing a significant transformation as government entities worldwide accelerate their digital initiatives. This shift, driven by the need to deliver efficient citizen services, simultaneously expands the attack surface, making robust defense mechanisms essential. The increasing sophistication of state-sponsored threats and advanced persistent threats necessitates a move beyond traditional perimeter security toward more dynamic frameworks.
  • Consequently, the adoption of zero trust architecture, which mandates continuous verification for all users and devices, is becoming a standard. For instance, a federal agency transitioning its services to a cloud environment must implement cloud security posture management and identity-centric security models to protect sensitive data.
  • This involves not only deploying advanced firewalls but also integrating AI-driven security operations centers for proactive threat hunting. However, the integration of these modern solutions with legacy systems poses a significant challenge, often requiring extensive customization and investment.
  • The critical need to secure national infrastructure, from public utilities to defense networks, ensures that cybersecurity remains a top priority, driving continuous innovation in areas like quantum-safe cryptography and industrial control systems security.

What will be the Size of the Public Sector Cybersecurity Market during the forecast period?

Get Key Insights on Market Forecast (PDF) Request Free Sample

How is the Public Sector Cybersecurity Market Segmented?

The public sector cybersecurity industry research report provides comprehensive data (region-wise segment analysis), with forecasts and estimates in "USD million" for the period 2026-2030, as well as historical data from 2020-2024 for the following segments.

  • Type
    • Network security
    • Endpoint security
    • Cloud security
    • Application security
  • End-user
    • Government agencies
    • Defense and military
    • Public utilities
    • Healthcare institutions
  • Deployment
    • On-premises
    • Cloud-based
    • Hybrid
  • Geography
    • North America
      • US
      • Canada
      • Mexico
    • Europe
      • UK
      • Germany
      • France
    • APAC
      • China
      • Japan
      • India
    • Middle East and Africa
      • Saudi Arabia
      • UAE
      • South Africa
    • South America
      • Brazil
      • Argentina
      • Colombia
    • Rest of World (ROW)

By Type Insights

The network security segment is estimated to witness significant growth during the forecast period.

Network security forms the foundational defense layer in the global public sector cybersecurity market 2026-2030, safeguarding vast repositories of classified intelligence and citizen data.

The paradigm shift toward remote work models has dissolved traditional perimeters, compelling agencies to adopt proactive threat hunting and a zero trust architecture, which authenticates every access request.

Protecting against state-sponsored threats and advanced persistent threats requires continuous network traffic analysis. Deployment of AI-driven security operations centers is critical, with real-time analytics reducing breach detection times by over 40%.

Investment in robust network segmentation and advanced firewall solutions is non-negotiable for ensuring uninterrupted governance and maintaining sovereign operations, especially for industrial control systems security.

Request Free Sample

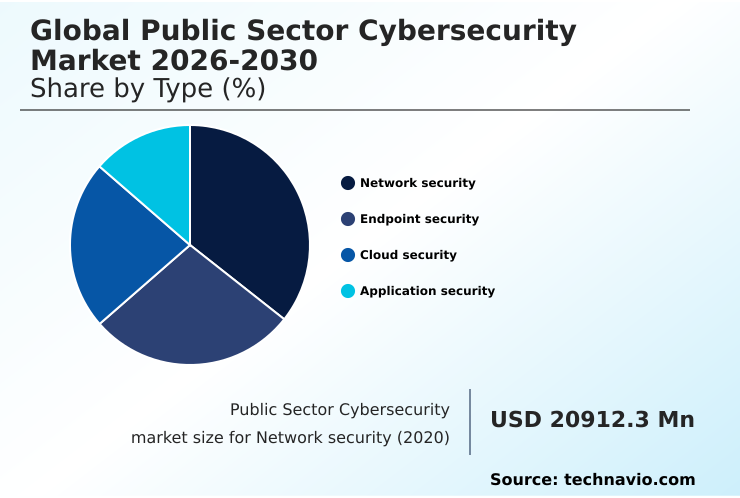
The Network security segment was valued at USD 26.72 billion in 2024 and showed a gradual increase during the forecast period.

Request Free Sample

Regional Analysis

North America is estimated to contribute 33.2% to the growth of the global market during the forecast period.Technavio’s analysts have elaborately explained the regional trends and drivers that shape the market during the forecast period.

See How Public Sector Cybersecurity Market Demand is Rising in North America Request Free Sample

The geographic landscape of the global public sector cybersecurity market 2026-2030 is diverse, with North America leading in maturity and investment.

However, APAC is the fastest-growing region, with a projected expansion of 13.1%, driven by widespread digital transformation and the need for data sovereignty. Europe follows with strong growth, focusing on stringent data privacy frameworks and sovereign cloud initiatives.

The implementation of unified threat management platforms is a common theme, with agencies achieving a 25% reduction in security alert fatigue. Public sector organizations are also standardizing vendor assessment protocols, which strengthens the security of digital supply chains across regions.

This global push for resilience is creating a landscape where both established and emerging markets prioritize cyber defense.

Market Dynamics

Our researchers analyzed the data with 2025 as the base year, along with the key drivers, trends, and challenges. A holistic analysis of drivers will help companies refine their marketing strategies to gain a competitive advantage.

  • The strategic direction of the global public sector cybersecurity market 2026-2030 is increasingly focused on sophisticated, forward-looking defense paradigms. A primary focus is on securing critical national infrastructure, where the convergence of IT and operational technology demands specialized solutions.
  • The implementation of ai in autonomous defense mechanisms is moving from theoretical to practical, with agencies reporting significantly higher efficacy in threat neutralization compared to manual systems. This is complemented by the widespread adoption of zero trust for government networks, a framework that is now a baseline requirement for most federal procurements.
  • As agencies migrate to the cloud, cloud security for federal agencies has become a major investment area, governed by strict compliance mandates. The push for proactive defense is evident in the demand for ai-driven endpoint protection for government, which offers predictive capabilities against novel malware.
  • Furthermore, ensuring public sector cybersecurity compliance is a constant challenge, driving the need for automated governance tools. Protecting electoral systems from cyber attacks remains a top-tier national security concern, compelling investments in highly resilient and transparent technologies.
  • Finally, the evolution of national cybersecurity strategies emphasizes a holistic approach, integrating threat intelligence, incident response, and continuous monitoring to build a truly fortified digital state. The necessity of enhancing supply chain security has also become a critical priority for public agencies.

What are the key market drivers leading to the rise in the adoption of Public Sector Cybersecurity Industry?

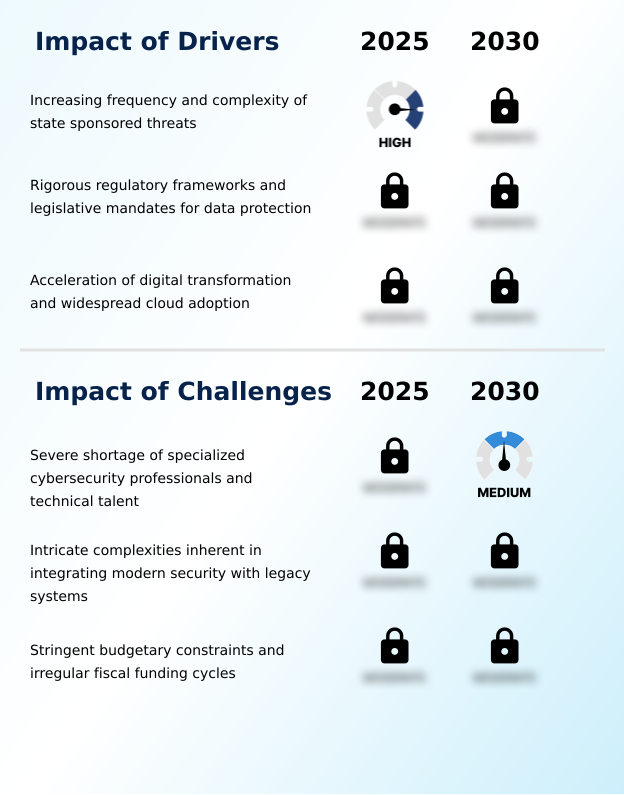
  • The increasing frequency and complexity of state-sponsored threats are a key driver for the public sector cybersecurity market.

  • The primary driver for the global public sector cybersecurity market 2026-2030 is the relentless increase in cyber attacks on critical national infrastructure. Government technology officers are spearheading digital transformation initiatives, but this rapid modernization expands the potential attack surface.
  • Malicious actors, including nation-state threat actors, are leveraging advanced techniques, compelling a strategic shift toward proactive defense. Strict legislative mandates and data privacy frameworks, which can impose penalties for non-compliance, further fuel investment.
  • Compliance with these rules often requires specialized governance, risk, and compliance software, leading to adoption rates increasing by 20% year-over-year in some regions.
  • The migration to hybrid and multi-cloud architectures necessitates robust cloud access security brokers and devsecops practices, driving sustained demand.

What are the market trends shaping the Public Sector Cybersecurity Industry?

  • The integration of artificial intelligence and machine learning is a key trend, enabling the development of autonomous defense mechanisms. This shift enhances proactive threat detection and response capabilities.

  • Key trends are reshaping the global public sector cybersecurity market 2026-2030, driven by the need for automated and predictive defense. The integration of AI into security operations centers is paramount, enabling autonomous systems to identify and neutralize threats with machine-speed efficiency, improving incident response times by over 50%.
  • This reliance on machine learning for security analytics allows for continuous adaptation to evolving attack vectors. The shift toward a zero trust security model is another critical trend, dismantling the idea of a trusted internal network. This approach, which is becoming a federal mandate in several nations, reduces the attack surface significantly.
  • Agencies adopting this model report a 60% reduction in successful lateral movement by attackers post-breach, underscoring its effectiveness in containing threats.

What challenges does the Public Sector Cybersecurity Industry face during its growth?

  • A severe shortage of specialized cybersecurity professionals and technical talent presents a key challenge to the industry's growth.

  • Significant challenges constrain the growth of the global public sector cybersecurity market 2026-2030, led by a severe shortage of qualified cybersecurity professionals. Public agencies struggle to compete with private sector compensation, leading to a talent deficit that leaves critical vulnerabilities unaddressed; some agencies report vacancy rates as high as 30% for key security roles.
  • Another major hurdle is the complexity of integrating modern security solutions with legacy infrastructure. Many government entities still rely on outdated mainframe systems that cannot support contemporary security protocols like native encryption, making them difficult to protect. This technical debt slows modernization, as the risk of operational disruption during upgrades can deter decision-makers.
  • Furthermore, stringent and often unpredictable budgetary constraints hinder proactive investment, forcing agencies to adopt a reactive security posture.

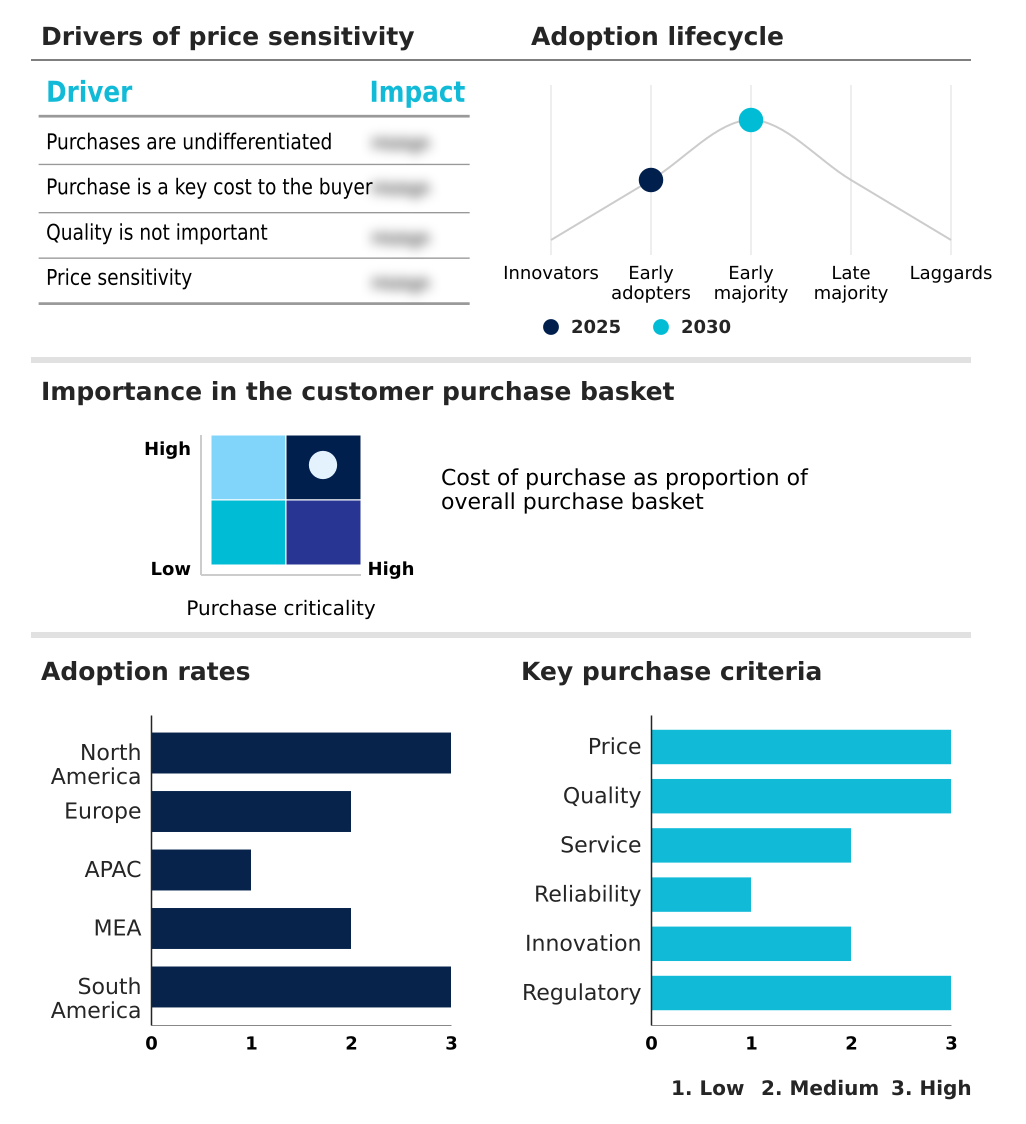
Exclusive Technavio Analysis on Customer Landscape

The public sector cybersecurity market forecasting report includes the adoption lifecycle of the market, covering from the innovator’s stage to the laggard’s stage. It focuses on adoption rates in different regions based on penetration. Furthermore, the public sector cybersecurity market report also includes key purchase criteria and drivers of price sensitivity to help companies evaluate and develop their market growth analysis strategies.

Customer Landscape of Public Sector Cybersecurity Industry

Competitive Landscape

Companies are implementing various strategies, such as strategic alliances, public sector cybersecurity market forecast, partnerships, mergers and acquisitions, geographical expansion, and product/service launches, to enhance their presence in the industry.

BAE Systems Plc - Provides national-level cyber defense, electronic warfare solutions, and intelligence analysis, specializing in advanced security for military and government entities.

The industry research and growth report includes detailed analyses of the competitive landscape of the market and information about key companies, including:

  • BAE Systems Plc
  • Booz Allen Hamilton Corp.
  • Check Point Software Tech Ltd.
  • Cisco Systems Inc.
  • CrowdStrike Inc.
  • CyberArk Software Ltd.
  • Fortinet Inc.
  • General Dynamics Information Tech.
  • IBM Corp.
  • Leidos Holdings Inc.
  • Lockheed Martin Corp.
  • Mandiant
  • Microsoft Corp.
  • Musarubra US LLC
  • Palo Alto Networks Inc.
  • Splunk Inc.
  • Tenable Holdings Inc.
  • Thales Group
  • Trend Micro Inc.
  • Zscaler Inc.

Qualitative and quantitative analysis of companies has been conducted to help clients understand the wider business environment as well as the strengths and weaknesses of key industry players. Data is qualitatively analyzed to categorize companies as pure play, category-focused, industry-focused, and diversified; it is quantitatively analyzed to categorize companies as dominant, leading, strong, tentative, and weak.

Recent Development and News in Public sector cybersecurity market

  • In September 2024, Leidos Holdings Inc. secured a multi-year contract to modernize the secure network infrastructure for a major federal agency, focusing on implementing a zero trust architecture to enhance security posture.
  • In November 2024, Microsoft Corp. announced a strategic partnership with Thales Group to integrate advanced quantum-safe cryptography into its Azure Government cloud platform, aiming to secure public sector data against future threats.
  • In February 2025, Dell Technologies launched a specialized secure server rack system designed exclusively for public sector on-premises environments, featuring advanced physical tamper resistance and integrated cryptographic accelerators for enhanced data protection.
  • In March 2025, Google Cloud announced a definitive agreement to acquire Wiz, a move intended to enhance its cloud security offerings and provide government organizations with greater flexibility in safeguarding their digital environments.

Dive into Technavio’s robust research methodology, blending expert interviews, extensive data synthesis, and validated models for unparalleled Public Sector Cybersecurity Market insights. See full methodology.

Market Scope
Page number 312
Base year 2025
Historic period 2020-2024
Forecast period 2026-2030
Growth momentum & CAGR Accelerate at a CAGR of 11.7%
Market growth 2026-2030 USD 62921.7 million
Market structure Fragmented
YoY growth 2025-2026(%) 10.5%
Key countries US, Canada, Mexico, UK, Germany, France, Italy, Spain, The Netherlands, China, Japan, India, South Korea, Australia, Indonesia, Saudi Arabia, UAE, South Africa, Israel, Turkey, Brazil, Argentina and Colombia
Competitive landscape Leading Companies, Market Positioning of Companies, Competitive Strategies, and Industry Risks

Request Free Sample

Research Analyst Overview

  • The public sector cybersecurity market is defined by an escalating need to defend against sophisticated, state-sponsored cyber campaigns. The core of modern strategy revolves around implementing a zero trust architecture, a non-negotiable framework for protecting distributed government networks. This involves the deployment of multi-factor authentication, endpoint detection and response (edr), and next-generation firewalls to create layered defenses.
  • A critical boardroom-level focus is aligning these technological procurements with stringent regulatory requirements, such as those governing data sovereignty and software bill of materials (sbom) disclosures. Agencies that integrate threat intelligence sharing platforms into their security posture have demonstrated a 30% faster response to zero-day vulnerabilities. Protecting critical infrastructure requires specialized industrial control systems security and operational technology (ot) security.
  • As agencies modernize, investments in cloud security posture management (cspm), quantum-safe cryptography, and fedramp-compliant solutions become imperative to safeguard against advanced persistent threats and ensure the resilience of national digital assets and autonomous systems.

What are the Key Data Covered in this Public Sector Cybersecurity Market Research and Growth Report?

  • What is the expected growth of the Public Sector Cybersecurity Market between 2026 and 2030?

    • USD 62.92 billion, at a CAGR of 11.7%

  • What segmentation does the market report cover?

    • The report is segmented by Type (Network security, Endpoint security, Cloud security, and Application security), End-user (Government agencies, Defense and military, Public utilities, and Healthcare institutions), Deployment (On-premises, Cloud-based, and Hybrid) and Geography (North America, Europe, APAC, Middle East and Africa, South America)

  • Which regions are analyzed in the report?

    • North America, Europe, APAC, Middle East and Africa and South America

  • What are the key growth drivers and market challenges?

    • Increasing frequency and complexity of state sponsored threats, Severe shortage of specialized cybersecurity professionals and technical talent

  • Who are the major players in the Public Sector Cybersecurity Market?

    • BAE Systems Plc, Booz Allen Hamilton Corp., Check Point Software Tech Ltd., Cisco Systems Inc., CrowdStrike Inc., CyberArk Software Ltd., Fortinet Inc., General Dynamics Information Tech., IBM Corp., Leidos Holdings Inc., Lockheed Martin Corp., Mandiant, Microsoft Corp., Musarubra US LLC, Palo Alto Networks Inc., Splunk Inc., Tenable Holdings Inc., Thales Group, Trend Micro Inc. and Zscaler Inc.

Market Research Insights

  • The dynamics of the public sector cybersecurity market are shaped by a strategic shift toward proactive defense and stringent regulatory compliance. The adoption of a secure access service edge (sase) has grown significantly, with agencies reporting a 50% improvement in securing remote workforce access. This identity-centric security model is crucial for mitigating risks associated with distributed networks.
  • Furthermore, the implementation of managed detection and response (mdr) services provides a more agile defense posture, reducing the mean time to detect threats by over 40% compared to in-house teams alone. Incident response planning is now a mandatory component of agency directives, with a focus on cyber warfare capabilities and resilience.
  • The continuous need for vulnerability management and comprehensive data loss prevention strategies ensures sustained investment in advanced platforms and governance, risk, and compliance software.

We can help! Our analysts can customize this public sector cybersecurity market research report to meet your requirements.

Get in touch

1. Executive Summary

1.1 Market overview

Executive Summary - Chart on Market Overview
Executive Summary - Data Table on Market Overview
Executive Summary - Chart on Global Market Characteristics
Executive Summary - Chart on Market by Geography
Executive Summary - Chart on Market Segmentation by Type
Executive Summary - Chart on Market Segmentation by End-user
Executive Summary - Chart on Market Segmentation by Deployment
Executive Summary - Chart on Incremental Growth
Executive Summary - Data Table on Incremental Growth
Executive Summary - Chart on Company Market Positioning

2. Technavio Analysis

2.1 Analysis of price sensitivity, lifecycle, customer purchase basket, adoption rates, and purchase criteria

2.2 Criticality of inputs and Factors of differentiation

Chart on Overview on criticality of inputs and factors of differentiation

2.3 Factors of disruption

Chart on Overview on factors of disruption

2.4 Impact of drivers and challenges

Chart on Impact of drivers and challenges in 2025 and 2030

3. Market Landscape

3.1 Market ecosystem

Chart on Parent Market
Data Table on - Parent Market

3.2 Market characteristics

Chart on Market characteristics analysis

3.3 Value chain analysis

Chart on Value chain analysis

4. Market Sizing

4.1 Market definition

Data Table on Offerings of companies included in the market definition

4.2 Market segment analysis

Market segments

4.3 Market size 2025

4.4 Market outlook: Forecast for 2025-2030

Chart on Global - Market size and forecast 2025-2030 ($ million)
Data Table on Global - Market size and forecast 2025-2030 ($ million)
Chart on Global Market: Year-over-year growth 2025-2030 (%)
Data Table on Global Market: Year-over-year growth 2025-2030 (%)

5. Historic Market Size

5.1 Global Public Sector Cybersecurity Market 2020 - 2024

Historic Market Size - Data Table on Global Public Sector Cybersecurity Market 2020 - 2024 ($ million)

5.2 Type segment analysis 2020 - 2024

Historic Market Size - Type Segment 2020 - 2024 ($ million)

5.3 End-user segment analysis 2020 - 2024

Historic Market Size - End-user Segment 2020 - 2024 ($ million)

5.4 Deployment segment analysis 2020 - 2024

Historic Market Size - Deployment Segment 2020 - 2024 ($ million)

5.5 Geography segment analysis 2020 - 2024

Historic Market Size - Geography Segment 2020 - 2024 ($ million)

5.6 Country segment analysis 2020 - 2024

Historic Market Size - Country Segment 2020 - 2024 ($ million)

6. Qualitative Analysis

6.1 Impact of AI on Global Public Sector Cybersecurity Market

6.2 Impact of Geopolitical Conflicts on Global Public Sector Cybersecurity Market

7. Five Forces Analysis

7.1 Five forces summary

Five forces analysis - Comparison between 2025 and 2030

7.2 Bargaining power of buyers

Bargaining power of buyers - Impact of key factors 2025 and 2030

7.3 Bargaining power of suppliers

Bargaining power of suppliers - Impact of key factors in 2025 and 2030

7.4 Threat of new entrants

Threat of new entrants - Impact of key factors in 2025 and 2030

7.5 Threat of substitutes

Threat of substitutes - Impact of key factors in 2025 and 2030

7.6 Threat of rivalry

Threat of rivalry - Impact of key factors in 2025 and 2030

7.7 Market condition

Chart on Market condition - Five forces 2025 and 2030

8. Market Segmentation by Type

8.1 Market segments

Chart on Type - Market share 2025-2030 (%)
Data Table on Type - Market share 2025-2030 (%)

8.2 Comparison by Type

Chart on Comparison by Type
Data Table on Comparison by Type

8.3 Network security - Market size and forecast 2025-2030

Chart on Network security - Market size and forecast 2025-2030 ($ million)
Data Table on Network security - Market size and forecast 2025-2030 ($ million)
Chart on Network security - Year-over-year growth 2025-2030 (%)
Data Table on Network security - Year-over-year growth 2025-2030 (%)

8.4 Endpoint security - Market size and forecast 2025-2030

Chart on Endpoint security - Market size and forecast 2025-2030 ($ million)
Data Table on Endpoint security - Market size and forecast 2025-2030 ($ million)
Chart on Endpoint security - Year-over-year growth 2025-2030 (%)
Data Table on Endpoint security - Year-over-year growth 2025-2030 (%)

8.5 Cloud security - Market size and forecast 2025-2030

Chart on Cloud security - Market size and forecast 2025-2030 ($ million)
Data Table on Cloud security - Market size and forecast 2025-2030 ($ million)
Chart on Cloud security - Year-over-year growth 2025-2030 (%)
Data Table on Cloud security - Year-over-year growth 2025-2030 (%)

8.6 Application security - Market size and forecast 2025-2030

Chart on Application security - Market size and forecast 2025-2030 ($ million)
Data Table on Application security - Market size and forecast 2025-2030 ($ million)
Chart on Application security - Year-over-year growth 2025-2030 (%)
Data Table on Application security - Year-over-year growth 2025-2030 (%)

8.7 Market opportunity by Type

Market opportunity by Type ($ million)
Data Table on Market opportunity by Type ($ million)

9. Market Segmentation by End-user

9.1 Market segments

Chart on End-user - Market share 2025-2030 (%)
Data Table on End-user - Market share 2025-2030 (%)

9.2 Comparison by End-user

Chart on Comparison by End-user
Data Table on Comparison by End-user

9.3 Government agencies - Market size and forecast 2025-2030

Chart on Government agencies - Market size and forecast 2025-2030 ($ million)
Data Table on Government agencies - Market size and forecast 2025-2030 ($ million)
Chart on Government agencies - Year-over-year growth 2025-2030 (%)
Data Table on Government agencies - Year-over-year growth 2025-2030 (%)

9.4 Defense and military - Market size and forecast 2025-2030

Chart on Defense and military - Market size and forecast 2025-2030 ($ million)
Data Table on Defense and military - Market size and forecast 2025-2030 ($ million)
Chart on Defense and military - Year-over-year growth 2025-2030 (%)
Data Table on Defense and military - Year-over-year growth 2025-2030 (%)

9.5 Public utilities - Market size and forecast 2025-2030

Chart on Public utilities - Market size and forecast 2025-2030 ($ million)
Data Table on Public utilities - Market size and forecast 2025-2030 ($ million)
Chart on Public utilities - Year-over-year growth 2025-2030 (%)
Data Table on Public utilities - Year-over-year growth 2025-2030 (%)

9.6 Healthcare institutions - Market size and forecast 2025-2030

Chart on Healthcare institutions - Market size and forecast 2025-2030 ($ million)
Data Table on Healthcare institutions - Market size and forecast 2025-2030 ($ million)
Chart on Healthcare institutions - Year-over-year growth 2025-2030 (%)
Data Table on Healthcare institutions - Year-over-year growth 2025-2030 (%)

9.7 Market opportunity by End-user

Market opportunity by End-user ($ million)
Data Table on Market opportunity by End-user ($ million)

10. Market Segmentation by Deployment

10.1 Market segments

Chart on Deployment - Market share 2025-2030 (%)
Data Table on Deployment - Market share 2025-2030 (%)

10.2 Comparison by Deployment

Chart on Comparison by Deployment
Data Table on Comparison by Deployment

10.3 On-premises - Market size and forecast 2025-2030

Chart on On-premises - Market size and forecast 2025-2030 ($ million)
Data Table on On-premises - Market size and forecast 2025-2030 ($ million)
Chart on On-premises - Year-over-year growth 2025-2030 (%)
Data Table on On-premises - Year-over-year growth 2025-2030 (%)

10.4 Cloud-based - Market size and forecast 2025-2030

Chart on Cloud-based - Market size and forecast 2025-2030 ($ million)
Data Table on Cloud-based - Market size and forecast 2025-2030 ($ million)
Chart on Cloud-based - Year-over-year growth 2025-2030 (%)
Data Table on Cloud-based - Year-over-year growth 2025-2030 (%)

10.5 Hybrid - Market size and forecast 2025-2030

Chart on Hybrid - Market size and forecast 2025-2030 ($ million)
Data Table on Hybrid - Market size and forecast 2025-2030 ($ million)
Chart on Hybrid - Year-over-year growth 2025-2030 (%)
Data Table on Hybrid - Year-over-year growth 2025-2030 (%)

10.6 Market opportunity by Deployment

Market opportunity by Deployment ($ million)
Data Table on Market opportunity by Deployment ($ million)

11. Customer Landscape

11.1 Customer landscape overview

Analysis of price sensitivity, lifecycle, customer purchase basket, adoption rates, and purchase criteria

12. Geographic Landscape

12.1 Geographic segmentation

Chart on Market share by geography 2025-2030 (%)
Data Table on Market share by geography 2025-2030 (%)

12.2 Geographic comparison

Chart on Geographic comparison
Data Table on Geographic comparison

12.3 North America - Market size and forecast 2025-2030

Chart on North America - Market size and forecast 2025-2030 ($ million)
Data Table on North America - Market size and forecast 2025-2030 ($ million)
Chart on North America - Year-over-year growth 2025-2030 (%)
Data Table on North America - Year-over-year growth 2025-2030 (%)
Chart on Regional Comparison - North America
Data Table on Regional Comparison - North America

12.3.1 US - Market size and forecast 2025-2030

Chart on US - Market size and forecast 2025-2030 ($ million)
Data Table on US - Market size and forecast 2025-2030 ($ million)
Chart on US - Year-over-year growth 2025-2030 (%)
Data Table on US - Year-over-year growth 2025-2030 (%)

12.3.2 Canada - Market size and forecast 2025-2030

Chart on Canada - Market size and forecast 2025-2030 ($ million)
Data Table on Canada - Market size and forecast 2025-2030 ($ million)
Chart on Canada - Year-over-year growth 2025-2030 (%)
Data Table on Canada - Year-over-year growth 2025-2030 (%)

12.3.3 Mexico - Market size and forecast 2025-2030

Chart on Mexico - Market size and forecast 2025-2030 ($ million)
Data Table on Mexico - Market size and forecast 2025-2030 ($ million)
Chart on Mexico - Year-over-year growth 2025-2030 (%)
Data Table on Mexico - Year-over-year growth 2025-2030 (%)

12.4 Europe - Market size and forecast 2025-2030

Chart on Europe - Market size and forecast 2025-2030 ($ million)
Data Table on Europe - Market size and forecast 2025-2030 ($ million)
Chart on Europe - Year-over-year growth 2025-2030 (%)
Data Table on Europe - Year-over-year growth 2025-2030 (%)
Chart on Regional Comparison - Europe
Data Table on Regional Comparison - Europe

12.4.1 UK - Market size and forecast 2025-2030

Chart on UK - Market size and forecast 2025-2030 ($ million)
Data Table on UK - Market size and forecast 2025-2030 ($ million)
Chart on UK - Year-over-year growth 2025-2030 (%)
Data Table on UK - Year-over-year growth 2025-2030 (%)

12.4.2 Germany - Market size and forecast 2025-2030

Chart on Germany - Market size and forecast 2025-2030 ($ million)
Data Table on Germany - Market size and forecast 2025-2030 ($ million)
Chart on Germany - Year-over-year growth 2025-2030 (%)
Data Table on Germany - Year-over-year growth 2025-2030 (%)

12.4.3 France - Market size and forecast 2025-2030

Chart on France - Market size and forecast 2025-2030 ($ million)
Data Table on France - Market size and forecast 2025-2030 ($ million)
Chart on France - Year-over-year growth 2025-2030 (%)
Data Table on France - Year-over-year growth 2025-2030 (%)

12.4.4 Italy - Market size and forecast 2025-2030

Chart on Italy - Market size and forecast 2025-2030 ($ million)
Data Table on Italy - Market size and forecast 2025-2030 ($ million)
Chart on Italy - Year-over-year growth 2025-2030 (%)
Data Table on Italy - Year-over-year growth 2025-2030 (%)

12.4.5 Spain - Market size and forecast 2025-2030

Chart on Spain - Market size and forecast 2025-2030 ($ million)
Data Table on Spain - Market size and forecast 2025-2030 ($ million)
Chart on Spain - Year-over-year growth 2025-2030 (%)
Data Table on Spain - Year-over-year growth 2025-2030 (%)

12.4.6 The Netherlands - Market size and forecast 2025-2030

Chart on The Netherlands - Market size and forecast 2025-2030 ($ million)
Data Table on The Netherlands - Market size and forecast 2025-2030 ($ million)
Chart on The Netherlands - Year-over-year growth 2025-2030 (%)
Data Table on The Netherlands - Year-over-year growth 2025-2030 (%)

12.5 APAC - Market size and forecast 2025-2030

Chart on APAC - Market size and forecast 2025-2030 ($ million)
Data Table on APAC - Market size and forecast 2025-2030 ($ million)
Chart on APAC - Year-over-year growth 2025-2030 (%)
Data Table on APAC - Year-over-year growth 2025-2030 (%)
Chart on Regional Comparison - APAC
Data Table on Regional Comparison - APAC

12.5.1 China - Market size and forecast 2025-2030

Chart on China - Market size and forecast 2025-2030 ($ million)
Data Table on China - Market size and forecast 2025-2030 ($ million)
Chart on China - Year-over-year growth 2025-2030 (%)
Data Table on China - Year-over-year growth 2025-2030 (%)

12.5.2 Japan - Market size and forecast 2025-2030

Chart on Japan - Market size and forecast 2025-2030 ($ million)
Data Table on Japan - Market size and forecast 2025-2030 ($ million)
Chart on Japan - Year-over-year growth 2025-2030 (%)
Data Table on Japan - Year-over-year growth 2025-2030 (%)

12.5.3 India - Market size and forecast 2025-2030

Chart on India - Market size and forecast 2025-2030 ($ million)
Data Table on India - Market size and forecast 2025-2030 ($ million)
Chart on India - Year-over-year growth 2025-2030 (%)
Data Table on India - Year-over-year growth 2025-2030 (%)

12.5.4 South Korea - Market size and forecast 2025-2030

Chart on South Korea - Market size and forecast 2025-2030 ($ million)
Data Table on South Korea - Market size and forecast 2025-2030 ($ million)
Chart on South Korea - Year-over-year growth 2025-2030 (%)
Data Table on South Korea - Year-over-year growth 2025-2030 (%)

12.5.5 Australia - Market size and forecast 2025-2030

Chart on Australia - Market size and forecast 2025-2030 ($ million)
Data Table on Australia - Market size and forecast 2025-2030 ($ million)
Chart on Australia - Year-over-year growth 2025-2030 (%)
Data Table on Australia - Year-over-year growth 2025-2030 (%)

12.5.6 Indonesia - Market size and forecast 2025-2030

Chart on Indonesia - Market size and forecast 2025-2030 ($ million)
Data Table on Indonesia - Market size and forecast 2025-2030 ($ million)
Chart on Indonesia - Year-over-year growth 2025-2030 (%)
Data Table on Indonesia - Year-over-year growth 2025-2030 (%)

12.6 Middle East and Africa - Market size and forecast 2025-2030

Chart on Middle East and Africa - Market size and forecast 2025-2030 ($ million)
Data Table on Middle East and Africa - Market size and forecast 2025-2030 ($ million)
Chart on Middle East and Africa - Year-over-year growth 2025-2030 (%)
Data Table on Middle East and Africa - Year-over-year growth 2025-2030 (%)
Chart on Regional Comparison - Middle East and Africa
Data Table on Regional Comparison - Middle East and Africa

12.6.1 Saudi Arabia - Market size and forecast 2025-2030

Chart on Saudi Arabia - Market size and forecast 2025-2030 ($ million)
Data Table on Saudi Arabia - Market size and forecast 2025-2030 ($ million)
Chart on Saudi Arabia - Year-over-year growth 2025-2030 (%)
Data Table on Saudi Arabia - Year-over-year growth 2025-2030 (%)

12.6.2 UAE - Market size and forecast 2025-2030

Chart on UAE - Market size and forecast 2025-2030 ($ million)
Data Table on UAE - Market size and forecast 2025-2030 ($ million)
Chart on UAE - Year-over-year growth 2025-2030 (%)
Data Table on UAE - Year-over-year growth 2025-2030 (%)

12.6.3 South Africa - Market size and forecast 2025-2030

Chart on South Africa - Market size and forecast 2025-2030 ($ million)
Data Table on South Africa - Market size and forecast 2025-2030 ($ million)
Chart on South Africa - Year-over-year growth 2025-2030 (%)
Data Table on South Africa - Year-over-year growth 2025-2030 (%)

12.6.4 Israel - Market size and forecast 2025-2030

Chart on Israel - Market size and forecast 2025-2030 ($ million)
Data Table on Israel - Market size and forecast 2025-2030 ($ million)
Chart on Israel - Year-over-year growth 2025-2030 (%)
Data Table on Israel - Year-over-year growth 2025-2030 (%)

12.6.5 Turkey - Market size and forecast 2025-2030

Chart on Turkey - Market size and forecast 2025-2030 ($ million)
Data Table on Turkey - Market size and forecast 2025-2030 ($ million)
Chart on Turkey - Year-over-year growth 2025-2030 (%)
Data Table on Turkey - Year-over-year growth 2025-2030 (%)

12.7 South America - Market size and forecast 2025-2030

Chart on South America - Market size and forecast 2025-2030 ($ million)
Data Table on South America - Market size and forecast 2025-2030 ($ million)
Chart on South America - Year-over-year growth 2025-2030 (%)
Data Table on South America - Year-over-year growth 2025-2030 (%)
Chart on Regional Comparison - South America
Data Table on Regional Comparison - South America

12.7.1 Brazil - Market size and forecast 2025-2030

Chart on Brazil - Market size and forecast 2025-2030 ($ million)
Data Table on Brazil - Market size and forecast 2025-2030 ($ million)
Chart on Brazil - Year-over-year growth 2025-2030 (%)
Data Table on Brazil - Year-over-year growth 2025-2030 (%)

12.7.2 Argentina - Market size and forecast 2025-2030

Chart on Argentina - Market size and forecast 2025-2030 ($ million)
Data Table on Argentina - Market size and forecast 2025-2030 ($ million)
Chart on Argentina - Year-over-year growth 2025-2030 (%)
Data Table on Argentina - Year-over-year growth 2025-2030 (%)

12.7.3 Colombia - Market size and forecast 2025-2030

Chart on Colombia - Market size and forecast 2025-2030 ($ million)
Data Table on Colombia - Market size and forecast 2025-2030 ($ million)
Chart on Colombia - Year-over-year growth 2025-2030 (%)
Data Table on Colombia - Year-over-year growth 2025-2030 (%)

12.8 Market opportunity by geography

Market opportunity by geography ($ million)
Data Tables on Market opportunity by geography ($ million)

13. Drivers, Challenges, and Opportunity

13.1 Market drivers

Increasing frequency and complexity of state sponsored threats
Rigorous regulatory frameworks and legislative mandates for data protection
Acceleration of digital transformation and widespread cloud adoption

13.2 Market challenges

Severe shortage of specialized cybersecurity professionals and technical talent
Intricate complexities inherent in integrating modern security with legacy systems
Stringent budgetary constraints and irregular fiscal funding cycles

13.3 Impact of drivers and challenges

Impact of drivers and challenges in 2025 and 2030

13.4 Market opportunities

Integration of AI and ML in autonomous defense mechanisms
Adoption of zero trust architecture across distributed governmental networks
Enhancement of supply chain risk management and vendor assessment protocols

14. Competitive Landscape

14.1 Overview

14.2

Overview on criticality of inputs and factors of differentiation

14.3 Landscape disruption

Overview on factors of disruption

14.4 Industry risks

Impact of key risks on business

15. Competitive Analysis

15.1 Companies profiled

Companies covered

15.2 Company ranking index

15.3 Market positioning of companies

Matrix on companies position and classification

15.4 BAE Systems Plc

BAE Systems Plc - Overview
BAE Systems Plc - Business segments
BAE Systems Plc - Key offerings
BAE Systems Plc - Segment focus
SWOT

15.5 Booz Allen Hamilton Corp.

Booz Allen Hamilton Corp. - Overview
Booz Allen Hamilton Corp. - Product / Service
Booz Allen Hamilton Corp. - Key offerings
SWOT

15.6 Cisco Systems Inc.

Cisco Systems Inc. - Overview
Cisco Systems Inc. - Business segments
Cisco Systems Inc. - Key news
Cisco Systems Inc. - Key offerings
Cisco Systems Inc. - Segment focus
SWOT

15.7 CrowdStrike Inc.

CrowdStrike Inc. - Overview
CrowdStrike Inc. - Product / Service
CrowdStrike Inc. - Key offerings
SWOT

15.8 Fortinet Inc.

Fortinet Inc. - Overview
Fortinet Inc. - Business segments
Fortinet Inc. - Key offerings
Fortinet Inc. - Segment focus
SWOT

15.9 General Dynamics Information Tech.

General Dynamics Information Tech. - Overview
General Dynamics Information Tech. - Product / Service
General Dynamics Information Tech. - Key offerings
SWOT

15.10 IBM Corp.

IBM Corp. - Overview
IBM Corp. - Business segments
IBM Corp. - Key news
IBM Corp. - Key offerings
IBM Corp. - Segment focus
SWOT

15.11 Leidos Holdings Inc.

Leidos Holdings Inc. - Overview
Leidos Holdings Inc. - Business segments
Leidos Holdings Inc. - Key offerings
Leidos Holdings Inc. - Segment focus
SWOT

15.12 Lockheed Martin Corp.

Lockheed Martin Corp. - Overview
Lockheed Martin Corp. - Business segments
Lockheed Martin Corp. - Key offerings
Lockheed Martin Corp. - Segment focus
SWOT

15.13 Mandiant

Mandiant - Overview
Mandiant - Product / Service
Mandiant - Key offerings
SWOT

15.14 Microsoft Corp.

Microsoft Corp. - Overview
Microsoft Corp. - Business segments
Microsoft Corp. - Key news
Microsoft Corp. - Key offerings
Microsoft Corp. - Segment focus
SWOT

15.15 Palo Alto Networks Inc.

Palo Alto Networks Inc. - Overview
Palo Alto Networks Inc. - Business segments
Palo Alto Networks Inc. - Key offerings
Palo Alto Networks Inc. - Segment focus
SWOT

15.16 Splunk Inc.

Splunk Inc. - Overview
Splunk Inc. - Product / Service
Splunk Inc. - Key offerings
SWOT

15.17 Thales Group

Thales Group - Overview
Thales Group - Business segments
Thales Group - Key offerings
Thales Group - Segment focus
SWOT

15.18 Zscaler Inc.

Zscaler Inc. - Overview
Zscaler Inc. - Product / Service
Zscaler Inc. - Key offerings
SWOT

16. Appendix

16.1 Scope of the report

Market definition
Objectives
Notes and caveats

16.2 Inclusions and exclusions checklist

Inclusions checklist
Exclusions checklist

16.3 Currency conversion rates for US$

16.4 Research methodology

16.5 Data procurement

Information sources

16.6 Data validation

16.7 Validation techniques employed for market sizing

16.8 Data synthesis

16.9 360 degree market analysis

16.10 List of abbreviations

Research Methodology

Technavio presents a detailed picture of the market by way of study, synthesis, and summation of data from multiple sources. The analysts have presented the various facets of the market with a particular focus on identifying the key industry influencers. The data thus presented is comprehensive, reliable, and the result of extensive research, both primary and secondary.

INFORMATION SOURCES

Primary sources

  • Manufacturers and suppliers
  • Channel partners
  • Industry experts
  • Strategic decision makers

Secondary sources

  • Industry journals and periodicals
  • Government data
  • Financial reports of key industry players
  • Historical data
  • Press releases

DATA ANALYSIS

Data Synthesis

  • Collation of data
  • Estimation of key figures
  • Analysis of derived insights

Data Validation

  • Triangulation with data models
  • Reference against proprietary databases
  • Corroboration with industry experts

REPORT WRITING

Qualitative

  • Market drivers
  • Market challenges
  • Market trends
  • Five forces analysis

Quantitative

  • Market size and forecast
  • Market segmentation
  • Geographical insights
  • Competitive landscape

Interested in this report?

Get your sample now to see our research methodology and insights!

Download Now

Frequently Asked Questions

Public Sector Cybersecurity market growth will increase by USD 62921.7 million during 2026-2030.

The Public Sector Cybersecurity market is expected to grow at a CAGR of 11.7% during 2026-2030.

Public Sector Cybersecurity market is segmented by Type (Network security, Endpoint security, Cloud security, Application security) End-user (Government agencies, Defense and military, Public utilities, Healthcare institutions) Deployment (On-premises, Cloud-based, Hybrid)

BAE Systems Plc, Booz Allen Hamilton Corp., Check Point Software Tech Ltd., Cisco Systems Inc., CrowdStrike Inc., CyberArk Software Ltd., Fortinet Inc., General Dynamics Information Tech., IBM Corp., Leidos Holdings Inc., Lockheed Martin Corp., Mandiant, Microsoft Corp., Musarubra US LLC, Palo Alto Networks Inc., Splunk Inc., Tenable Holdings Inc., Thales Group, Trend Micro Inc., Zscaler Inc. are a few of the key vendors in the Public Sector Cybersecurity market.

North America will register the highest growth rate of 33.2% among the other regions. Therefore, the Public Sector Cybersecurity market in North America is expected to garner significant business opportunities for the vendors during the forecast period.

US, Canada, Mexico, UK, Germany, France, Italy, Spain, The Netherlands, China, Japan, India, South Korea, Australia, Indonesia, Saudi Arabia, UAE, South Africa, Israel, Turkey, Brazil, Argentina, Colombia

  • Increasing frequency and complexity of state sponsored threats is the driving factor this market.

The Public Sector Cybersecurity market vendors should focus on grabbing business opportunities from the Type segment as it accounted for the largest market share in the base year.
RIA - Research AI Assistant
Ask RIA