
Multi-Factor Authentication Market Size 2025-2029
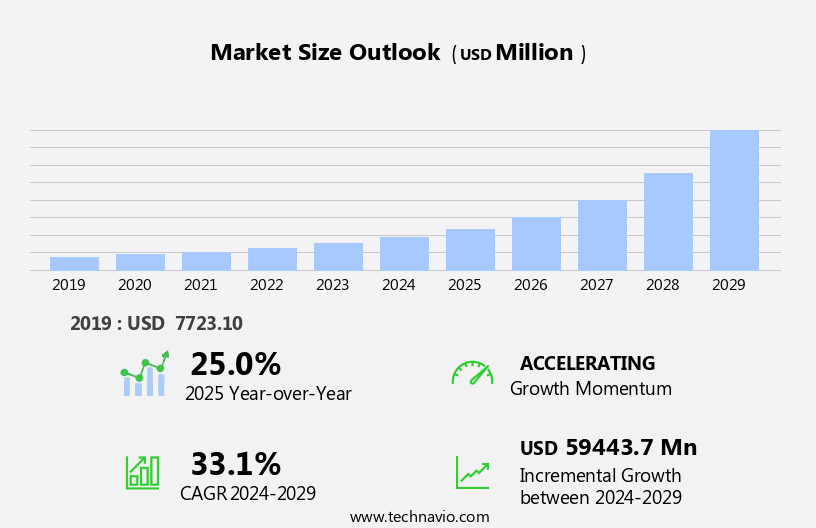
The multi-factor authentication market size is forecast to increase by USD 59.44 billion, at a CAGR of 33.1% between 2024 and 2029.
- The Multi-Factor Authentication (MFA) market is experiencing significant growth, driven by the increasing volume of online transactions. As businesses continue to digitize their operations, the need for robust security measures, such as MFA, becomes increasingly crucial. One trend shaping the market is the introduction of Out-of-Band (OOB) authentication methods, which provide an additional layer of security by requiring users to verify their identity through a separate communication channel. However, the market also faces challenges. The increasing cost of One-Time Password (OTP) tokens is a significant obstacle for some organizations, particularly smaller businesses with limited budgets. These costs can add up quickly, making it difficult for some to implement MFA solutions. Additionally, ensuring compliance with data security standards is crucial to avoid potential legal and reputational risks.
- Despite these challenges, the potential benefits of MFA, including enhanced security and compliance with regulatory requirements, make it an essential investment for businesses looking to protect their digital assets and safeguard customer information. Companies seeking to capitalize on market opportunities and navigate challenges effectively should consider exploring cost-effective MFA solutions and partnerships with technology providers. The market will see significant growth as smart thermostats and other IoT devices equipped with sensors require advanced multi-factor authentication to ensure secure access and protect user data.
What will be the Size of the Multi-Factor Authentication Market during the forecast period?
Explore in-depth regional segment analysis with market size data - historical 2019-2023 and forecasts 2025-2029 - in the full report.
Request Free Sample
- The multi-factor authentication (MFA) market is experiencing significant growth, driven by the increasing need for robust security solutions in the digital age. Contextual authentication, which considers user behavior and environment, is gaining popularity as an effective approach to enhance MFA. Security training programs are essential to ensure proper implementation and usage of MFA. Security dashboards provide real-time insights into authentication events, enabling quick response to security alerts and incidents. Post-quantum cryptography and quantum-resistant cryptography are emerging technologies that offer enhanced security, addressing concerns around quantum computing threats. Security certifications, such as CISSP and CISM, are vital for IT professionals to stay updated on the latest authentication trends and best practices.
- Digital identity management, including federated identity and decentralized identity, is evolving to provide more secure and convenient authentication methods. Security monitoring tools, like SIEMs and SOARs, play a crucial role in detecting and responding to unauthorized access attempts. Passwordless authentication, data redaction, and secure communication are essential components of a comprehensive authentication strategy. Cryptographic authentication, biometric fusion, behavioral biometrics, digital signatures, and security tokenization are advanced technologies that offer improved security and convenience. Data masking and security logs are essential for maintaining data privacy and ensuring regulatory compliance. In summary, the MFA market is dynamic, with a focus on advanced technologies, user-friendly solutions, and continuous security improvements.
How is this Multi-Factor Authentication Industry segmented?
The multi-factor authentication industry research report provides comprehensive data (region-wise segment analysis), with forecasts and estimates in "USD million" for the period 2025-2029, as well as historical data from 2019-2023 for the following segments.
- Component
- Services
- Products
- Deployment
- On-premises
- Cloud
- Product Type
- Two-Factor Authentication
- Three-Factor Authentication
- Others
- End-user
- BFSI
- IT and telecommunications
- Healthcare
- Government
- Others
- Geography
- North America
- US
- Canada
- Europe
- France
- Germany
- Italy
- UK
- APAC
- China
- India
- Japan
- South Korea
- Rest of World (ROW)
- North America
By Component Insights
The services segment is estimated to witness significant growth during the forecast period. In today's business landscape, the flexibility to work remotely has become a necessity, leading enterprises to prioritize secure authentication methods for remote access. Multi-factor authentication (MFA) solutions have gained prominence as they offer an additional layer of security, ensuring only authorized individuals can access sensitive data. MFA solutions employ various factors such as security tokens, email verification, SMS authentication, push notifications, and biometric authentication to confirm user identities. The increasing number of data breaches, cyber-attacks, and the widespread adoption of Bring Your Own Device (BYOD) policies in enterprises are major drivers for the MFA market. MFA solutions provide an essential defense against unauthorized access, protecting critical information from tampering.
Threat detection systems, security awareness training, and incident response are integrated into these solutions to mitigate risks and prevent fraud. Moreover, MFA solutions are not limited to traditional desktop environments. They are also crucial for securing mobile devices and cloud applications. Access control, behavioral analytics, and vulnerability management are integral components of these solutions, ensuring that security policies are adhered to and compliance regulations are met. MFA solutions also offer adaptive authentication, which adjusts the authentication process based on user behavior and risk levels. This feature enhances security by providing an extra layer of protection against advanced threats. Additionally, MFA solutions support open standards like OpenID Connect and OAuth, enabling seamless integration with various applications and services. Security monitoring, security analytics, penetration testing, and security best practices are essential practices that are integrated into MFA solutions to ensure robust security.
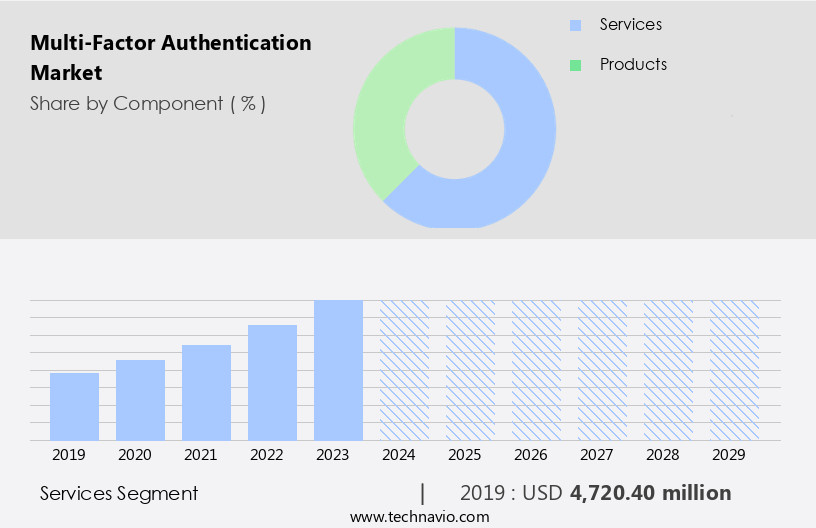
The Services segment was valued at USD 4.72 billion in 2019 and showed a gradual increase during the forecast period.
Regional Analysis
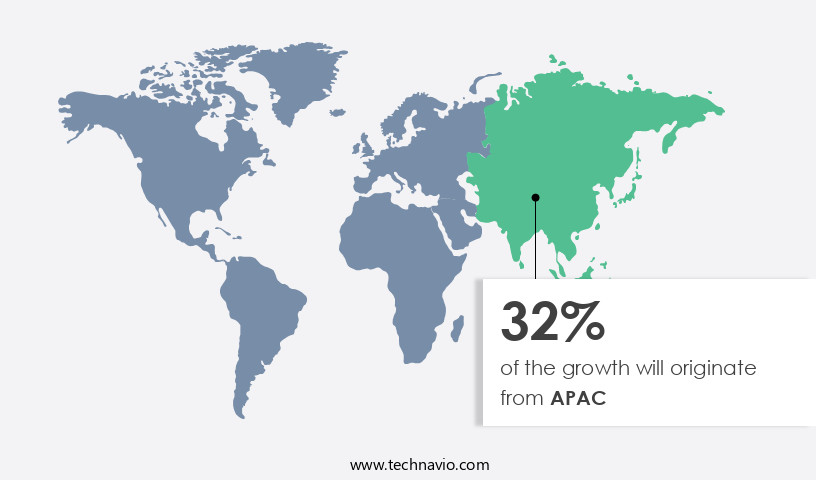
APAC is estimated to contribute 32% to the growth of the global market during the forecast period. Technavio's analysts have elaborately explained the regional trends and drivers that shape the market during the forecast period.
Multi-factor authentication (MFA) is a critical aspect of endpoint security in North America, particularly in the US and Canada. The market for MFA is expanding as organizations adopt various models, ranging from basic to advanced solutions. Healthcare applications dominate the US market due to stringent data privacy regulations. In the government sector, biometric systems, including facial recognition, voice recognition, and fingerprint scanning, are increasingly used for access control and threat detection. MFA enhances security by adding an extra layer to traditional password-based authentication. It is particularly effective against security breaches and phishing attacks. Security awareness training and incident response are essential components of a robust MFA strategy.
Other technologies, such as security tokens, SMS authentication, push notifications, and risk-based authentication, are also integral to MFA. OpenID Connect, security keys, and single sign-on further streamline the authentication process. Compliance regulations, such as HIPAA and PCI-DSS, mandate the use of MFA in specific industries. MFA is also vital for mobile security, network security, and cloud security. Security best practices, including security audits, penetration testing, and vulnerability management, are crucial in ensuring the effectiveness of MFA solutions. Ultimately, MFA is an essential component of a comprehensive security architecture, enabling secure access to applications and data while maintaining data encryption and user education.
Market Dynamics
Our researchers analyzed the data with 2024 as the base year, along with the key drivers, trends, and challenges. A holistic analysis of drivers will help companies refine their marketing strategies to gain a competitive advantage.
What are the Multi-Factor Authentication market drivers leading to the rise in the adoption of Industry?
- The significant growth in the number of online transactions is the primary catalyst fueling market expansion. Multi-Factor Authentication (MFA) has become a crucial component in securing online transactions as the number of digital services and e-commerce sales continues to grow. Cybersecurity threats, such as data breaches and identity theft, are increasingly targeting online platforms with large customer bases. Traditional authentication methods, like passwords, are no longer sufficient to protect against these advanced attacks. To mitigate these risks, organizations are adopting MFA solutions that combine multiple verification factors, such as facial recognition, voice recognition, security keys, and behavioral analytics. These technologies add an extra layer of security by requiring users to provide additional authentication factors beyond a password.
- Security monitoring and user education are also essential components of a robust MFA security architecture. OpenID Connect and Security Analytics help organizations monitor user behavior and detect anomalous activity, while data encryption ensures that sensitive information remains protected. MFA solutions can be integrated into various access control systems, such as Single Sign-On (SSO) and Identity as a Service (IDaaS), to streamline the authentication process for users. By implementing MFA, organizations can provide a more secure and seamless online experience for their customers.
What are the Multi-Factor Authentication market trends shaping the Industry?
- Out-of-Band (OOB) authentication is the emerging trend in the market. This authentication method, which involves the use of separate communication channels for authentication, enhances security by reducing the risk of interception and man-in-the-middle attacks. Multi-Factor Authentication (MFA), specifically Out-of-Band (OOB) authentication, is a critical security measure adopted by enterprises to enhance their network security. OOB authentication is a type of MFA that adds an extra layer of protection by requiring users to provide two different forms of verification from separate communication channels. This method is particularly effective in preventing unauthorized access even if a hacker manages to obtain a user's security credentials. The adoption of OOB authentication is on the rise due to the increasing number of security threats and the need to adhere to stringent security best practices. OOB authentication is cost-effective compared to other complex biometric technologies and can be implemented using one-time passwords (OTPs), security testing, threat intelligence, fingerprint scanning, or even security audits and penetration testing.
- Enterprises are focusing on implementing multi-factor authentication, including OOB technology, to secure their cloud environments and protect sensitive data from data loss prevention threats. Password managers and network security solutions are also integrating OOB authentication to provide an additional layer of security for their users.
How does Multi-Factor Authentication market faces challenges during its growth?
- The rising cost of One-Time Password (OTP) tokens poses a significant challenge to the industry's growth trajectory. This trend, which has gained momentum in recent times, may hinder the expansion and profitability of businesses that rely heavily on secure authentication methods. Multi-Factor Authentication (MFA) is a critical security measure that enhances user identity verification, adding an essential layer to traditional password-based authentication. MFA solutions employ various authentication factors, such as biometric authentication (iris scanning, fingerprint scanning), single sign-on, and two-factor authentication (SMS codes, tokens). Compliance regulations and stringent security policies demand robust fraud prevention and vulnerability management, making MFA a necessity. Authentication protocols, such as step-up authentication, provide additional security by requiring multiple factors for authentication in specific situations. High initial deployment and replacement costs are a challenge for MFA market growth. These costs consist of the initial pricing and licensing model, infrastructure and hardware requirements, token warranty, and the effort and resources needed for deployment and management.
- The market is dominated by a few key players, with limited competition leading to high costs. Companies prioritize security operations center integration, application security, and seamless user experience to cater to the evolving needs of businesses.
Exclusive Customer Landscape
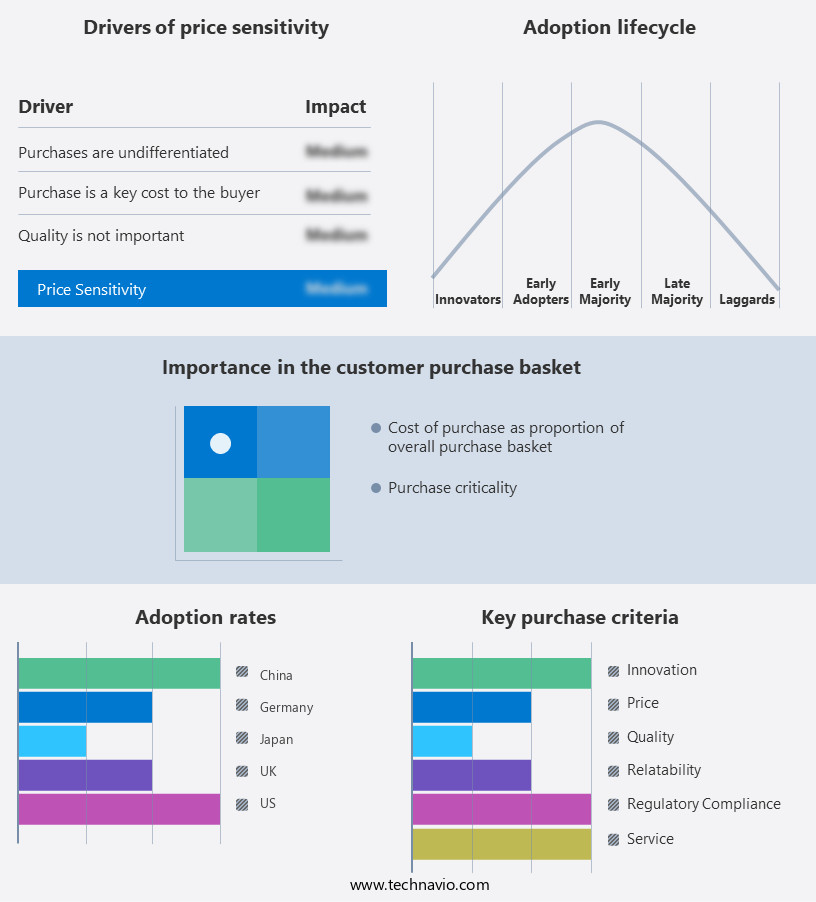
The multi-factor authentication market forecasting report includes the adoption lifecycle of the market, covering from the innovator's stage to the laggard's stage. It focuses on adoption rates in different regions based on penetration. Furthermore, the multi-factor authentication market report also includes key purchase criteria and drivers of price sensitivity to help companies evaluate and develop their market growth analysis strategies.
Customer Landscape
Key Companies & Market Insights
Companies are implementing various strategies, such as strategic alliances, multi-factor authentication market forecast, partnerships, mergers and acquisitions, geographical expansion, and product/service launches, to enhance their presence in the industry.
Beyond Identity Inc. - The company implements advanced security measures through CA Strong Authentication, a multi-factor authentication solution.
The industry research and growth report includes detailed analyses of the competitive landscape of the market and information about key companies, including:
- Beyond Identity Inc.
- Broadcom Inc.
- Duo Security Inc.
- Entrust Corp.
- FEITIAN Technologies Co. Ltd.
- Frontegg
- Fujitsu Ltd.
- FusionAuth
- Giesecke Devrient GmbH
- HID Global Corp.
- Microsoft Corp.
- NEC Corp.
- Okta Inc.
- OneSpan Inc.
- Quest Software Inc.
- RSA Security LLC
- SecureAuth Corp.
- Thales Group
- TransUnion
- Yubico AB
Qualitative and quantitative analysis of companies has been conducted to help clients understand the wider business environment as well as the strengths and weaknesses of key industry players. Data is qualitatively analyzed to categorize companies as pure play, category-focused, industry-focused, and diversified; it is quantitatively analyzed to categorize companies as dominant, leading, strong, tentative, and weak.
Recent Development and News in Multi-Factor Authentication Market
- In February 2024, Microsoft announced the global availability of its new Multi-Factor Authentication (MFA) solution, Microsoft Identity Platform Conditional Access, which uses artificial intelligence and machine learning to help organizations adapt and respond to evolving security risks in real-time (Microsoft Press Release, 2024).
- In May 2024, IBM Security and Google Cloud joined forces to integrate IBM's MFA and identity and access management solutions with Google Cloud's identity platform, enabling seamless authentication and authorization for joint customers (IBM Press Release, 2024).
- In October 2024, Okta, a leading identity and access management provider, raised USD1.5 billion in a funding round, demonstrating strong investor confidence in the growth potential of the market (Okta Press Release, 2024).
Research Analyst Overview
The multi-factor authentication (MFA) market continues to evolve, driven by the ever-evolving threat landscape and the need for robust security solutions. Endpoint security, a critical component of MFA, ensures the protection of devices and data access points. Security tokens, email verification, and SMS authentication are among the various MFA methods employed to enhance security. Data privacy is a primary concern, leading to the adoption of push notifications and threat detection systems. Security awareness training, incident response, and mobile security are essential components of a comprehensive MFA strategy. Adaptive authentication and risk-based approaches provide an additional layer of protection, while openid connect and security keys offer seamless integration with various applications and systems.
Behavioral analytics, voice recognition, and facial recognition are emerging trends in MFA, offering enhanced security and convenience. Data encryption, user education, and security analytics are integral to a robust security architecture. Access control, compliance regulations, and security policies are essential elements of a comprehensive MFA strategy. Fraud prevention, vulnerability management, and a security operations center are crucial components of an effective MFA solution. Authentication protocols, step-up authentication, and single sign-on streamline the authentication process while maintaining security. Biometric authentication, iris scanning, and two-factor authentication offer enhanced security and convenience. Threat intelligence, network security, password managers, and security testing are essential tools for maintaining a secure environment.
Data loss prevention and authentication factors are critical components of a comprehensive MFA strategy. The ongoing unfolding of market activities and evolving patterns underscore the importance of staying informed and adhering to best practices and security policies.
Dive into Technavio's strong research methodology, blending expert interviews, extensive data synthesis, and validated models for unparalleled Multi-Factor Authentication Market insights. See full methodology.
|
Market Scope |
|
|
Report Coverage |
Details |
|
Page number |
242 |
|
Base year |
2024 |
|
Historic period |
2019-2023 |
|
Forecast period |
2025-2029 |
|
Growth momentum & CAGR |
Accelerate at a CAGR of 33.1% |
|
Market growth 2025-2029 |
USD 59.44 billion |
|
Market structure |
Fragmented |
|
YoY growth 2024-2025(%) |
25.0 |
|
Key countries |
US, Germany, Canada, China, UK, France, Italy, Japan, India, and South Korea |
|
Competitive landscape |
Leading Companies, Market Positioning of Companies, Competitive Strategies, and Industry Risks |
What are the Key Data Covered in this Multi-Factor Authentication Market Research and Growth Report?
- CAGR of the Multi-Factor Authentication industry during the forecast period
- Detailed information on factors that will drive the growth and forecasting between 2025 and 2029
- Precise estimation of the size of the market and its contribution of the industry in focus to the parent market
- Accurate predictions about upcoming growth and trends and changes in consumer behaviour
- Growth of the market across North America, Europe, APAC, South America, and Middle East and Africa
- Thorough analysis of the market's competitive landscape and detailed information about companies
- Comprehensive analysis of factors that will challenge the multi-factor authentication market growth of industry companies
We can help! Our analysts can customize this multi-factor authentication market research report to meet your requirements.
 RIA -
RIA - 
