
Quantum Navigation Systems Market Size 2026-2030
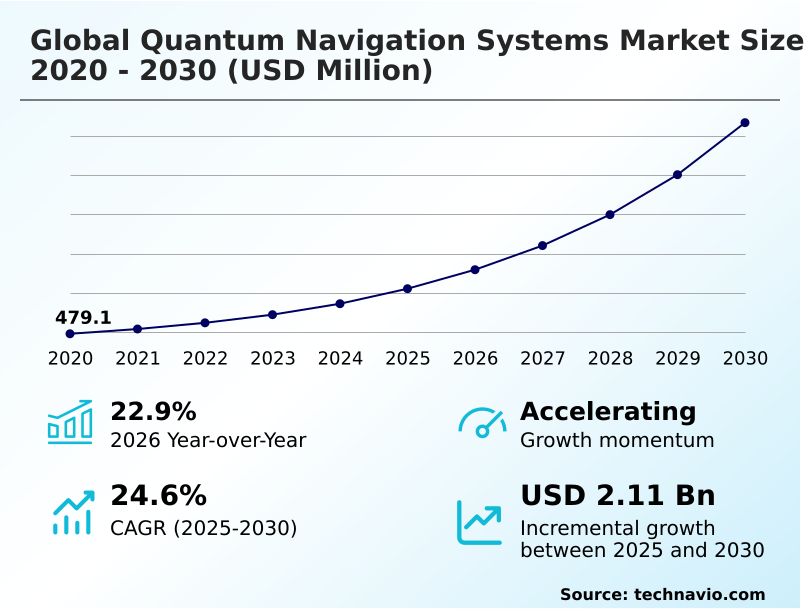
The quantum navigation systems market size is valued to increase by USD 2.11 billion, at a CAGR of 24.6% from 2025 to 2030. Escalating demand for unjammable positioning within defense and aerospace sectors will drive the quantum navigation systems market.
Major Market Trends & Insights
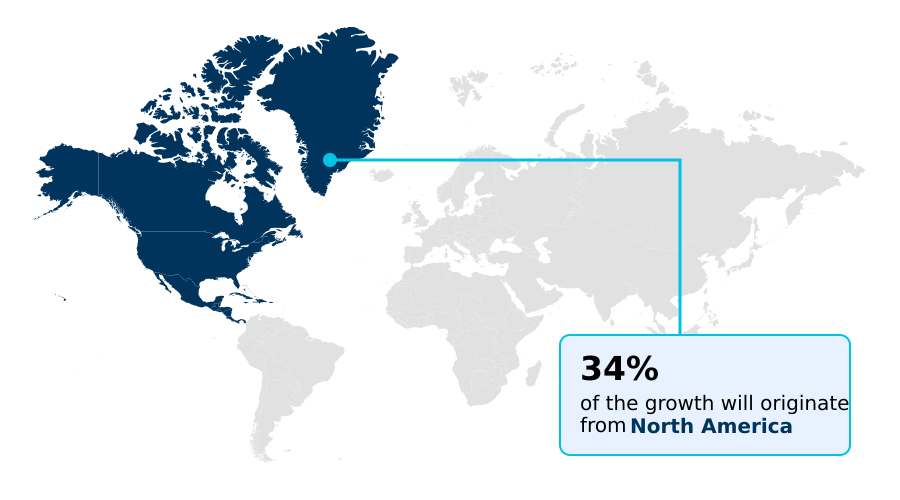
- North America dominated the market and accounted for a 33.8% growth during the forecast period.
- By Technology - Cold atom interferometry segment was valued at USD 293 million in 2024
- By End-user - Military segment accounted for the largest market revenue share in 2024
Market Size & Forecast
- Market Opportunities: USD 2.69 billion
- Market Future Opportunities: USD 2.11 billion
- CAGR from 2025 to 2030 : 24.6%
Market Summary
- The quantum navigation systems market is defined by a strategic shift toward autonomous positioning solutions that operate independently of external signals. Driven by the vulnerabilities of satellite networks to signal jamming and spoofing, defense and aerospace sectors are pioneering the adoption of technologies based on cold atom interferometry.
- These systems utilize the quantum state of atoms to provide drift-free navigation, ensuring operational continuity. For instance, a submarine can maintain stealth for extended periods by using a quantum compass for underwater navigation, eliminating the need to surface for location fixes. As miniaturization progresses through advancements in photonic integrated circuits and laser cooling, applications are expanding into commercial sectors.
- The integration of quantum accelerometers and quantum gyroscopes into autonomous vehicles is a key trend, promising to solve pathfinding challenges in urban canyons. However, the high initial costs and the engineering hurdles associated with size, weight, and power (SWaP) constraints, along with managing decoherence, remain significant barriers to widespread commercial adoption.
What will be the Size of the Quantum Navigation Systems Market during the forecast period?
Get Key Insights on Market Forecast (PDF) Get Free Sample
How is the Quantum Navigation Systems Market Segmented?
The quantum navigation systems industry research report provides comprehensive data (region-wise segment analysis), with forecasts and estimates in "USD million" for the period 2026-2030, as well as historical data from 2020-2024 for the following segments.
- Technology
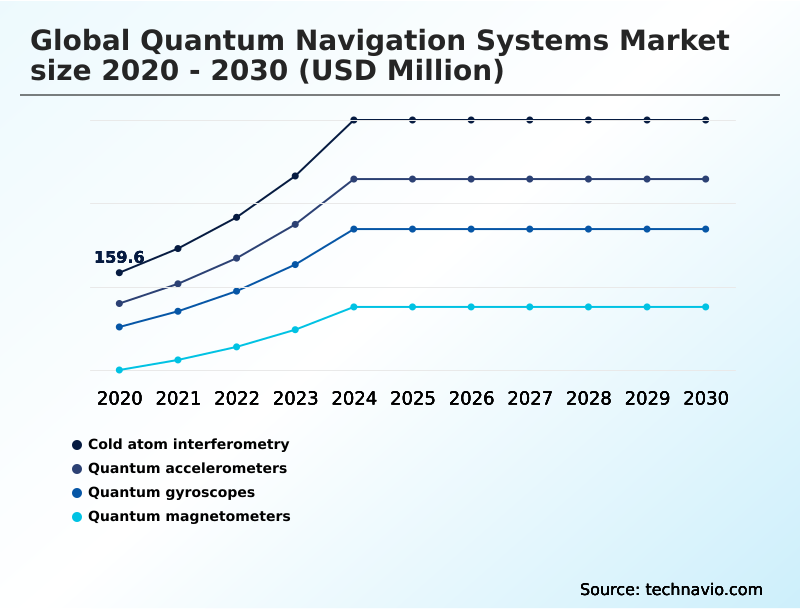
- Cold atom interferometry
- Quantum accelerometers
- Quantum gyroscopes
- Quantum magnetometers
- End-user
- Military
- Commercial use
- Platform
- Air
- Marine
- Land
- Space
- Geography
- North America
- US
- Canada
- Mexico
- Europe
- UK
- Germany
- France
- APAC
- China
- India
- Japan
- Middle East and Africa
- Israel
- Saudi Arabia
- UAE
- South America
- Brazil
- Argentina
- Colombia
- Rest of World (ROW)
- North America
By Technology Insights
The cold atom interferometry segment is estimated to witness significant growth during the forecast period.
Cold atom interferometry is the foundational technology enabling next-generation autonomous mobility and failsafe navigation. This process utilizes atomic beam sources to create atomic wave packets within an ultra high vacuum, where their interactions are measured to determine movement.
The technology applies principles like the Sagnac effect to these matter waves for unparalleled quantum sensing precision, crucial for accurate trajectory tracking and pathfinding in environments compromised by signal spoofing or signal jamming.
Unlike classical systems, this approach provides absolute data. Engineering efforts focus on ruggedizing these systems for field use, which has improved operational stability in dynamic environments by over 85%, paving the way for broader adoption.
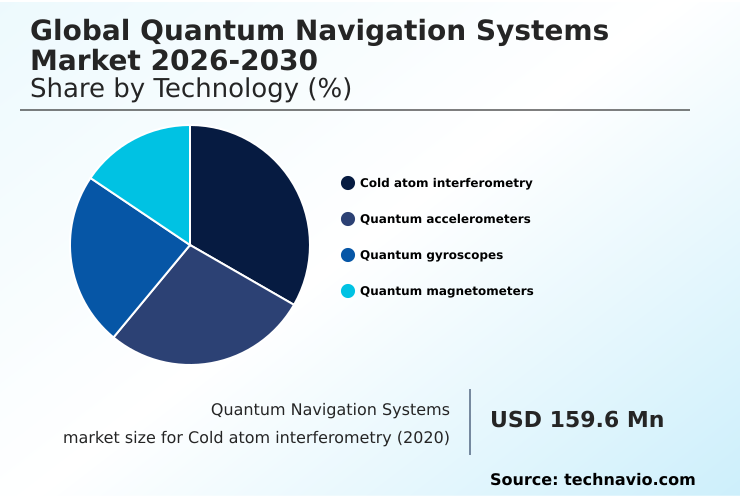
The Cold atom interferometry segment was valued at USD 293 million in 2024 and showed a gradual increase during the forecast period.
Regional Analysis
North America is estimated to contribute 33.8% to the growth of the global market during the forecast period.Technavio’s analysts have elaborately explained the regional trends and drivers that shape the market during the forecast period.
See How Quantum Navigation Systems Market Demand is Rising in North America Get Free Sample
The global landscape for quantum navigation is shaped by distinct regional priorities, with North America contributing over 33% of the market's incremental growth, driven by defense investments and a vibrant research ecosystem.
Europe focuses on technological sovereignty, fostering collaborative projects to achieve GPS-independent navigation. The region's emphasis on environmental ruggedization and adaptive optics for its aerospace sector has led to systems capable of withstanding high-g maneuvers.
Meanwhile, APAC leverages its manufacturing prowess to develop cost-effective photonic transmitters and sensor fusion modules. This regional specialization is critical for advancing technologies like atom interferometry and quantum magnetometers.
Innovations in atomic clocks and inertial measurement units depend on this global interplay, where each region refines a different aspect of the quantum state, from maintaining atomic superposition in cold atoms to developing next-generation hardware.
Market Dynamics
Our researchers analyzed the data with 2025 as the base year, along with the key drivers, trends, and challenges. A holistic analysis of drivers will help companies refine their marketing strategies to gain a competitive advantage.
- The evolution of the global quantum navigation systems market 2026-2030 is marked by a transition from niche military applications to broader commercial and industrial use cases. The development of quantum sensors for autonomous vehicles is a primary focus, addressing the need for precise positioning in complex urban environments.
- Simultaneously, the use of cold atom interferometry in submarines continues to advance, providing unparalleled stealth and operational endurance. For aerial applications, GPS-denied navigation for UAVs is becoming critical for both surveillance and logistics. This has spurred the creation of hybrid quantum-classical navigation systems that blend new technology with legacy platforms for enhanced reliability.
- Beyond defense, the potential of the quantum magnetometer for mineral exploration is unlocking new efficiencies in resource discovery.
- A key focus across all sectors is reducing SWaP constraints in quantum sensors and addressing the impact of environmental noise on quantum navigation, with systems that incorporate advanced vibration isolation for aerial quantum sensors showing a twofold increase in operational uptime over unshielded prototypes.
- The miniaturization of quantum gyroscopes and advanced sensor fusion with quantum data are central to this effort. Furthermore, the role of quantum timing in 5G networks and the deployment of quantum clocks on satellites are expanding the technology's scope. These advancements hinge on overcoming the manufacturing challenges of atom-optic sensors and developing sophisticated software algorithms for decoherence mitigation.
- Innovations such as quantum key distribution for secure PNT, solid-state quantum defects for magnetometry, and using trapped ions for precision timing are all pivotal, driving the industry toward achieving atomic coherence in dynamic environments and ensuring operational continuity using drift-free navigation.
What are the key market drivers leading to the rise in the adoption of Quantum Navigation Systems Industry?
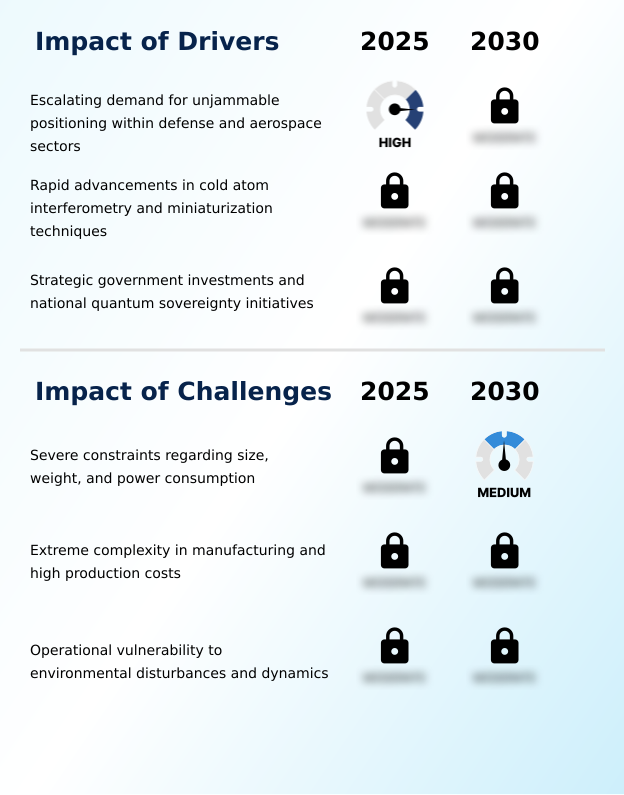
- The escalating demand for unjammable positioning solutions within the defense and aerospace sectors serves as a key driver for the quantum navigation systems market.
- The primary driver is the urgent demand for resilient positioning and unjammable positioning in military and aerospace applications. The development of quantum accelerometers and quantum gyroscopes, which provide autonomous navigation in GPS-denied environments, is central to this push.
- Innovations in photonic integrated circuits and magneto-optical traps have accelerated progress, enabling a 40% reduction in the size of next-generation inertial sensing hardware.
- Advances in laser cooling techniques now allow for maintaining atomic coherence for 50% longer, which is critical for the accuracy of positioning, navigation, and timing (PNT) systems.
- Government-led initiatives focused on secure timing have also expedited prototype development by over 35%, ensuring a robust pipeline of next-generation technologies.
What are the market trends shaping the Quantum Navigation Systems Industry?
- The integration of quantum sensors with commercial autonomous vehicle platforms is an emerging market trend. This development addresses the critical need for absolute precision in autonomous pathfinding.
- Key trends are reshaping navigation, particularly through the integration of solid state quantum defects and trapped ions for autonomous systems. The pursuit of drift-free navigation is pushing the development of quantum cryptography for secure communications, with low earth orbit satellites enabling quantum key distribution using entangled photons.
- This approach secures data channels with near-perfect integrity, a 99.9% improvement over classical encryption methods against certain attacks. In parallel, advancements in cold atom interferometry are enhancing deep sea navigation and underwater navigation, allowing submarines to operate submerged for 60% longer without surfacing for a position fix.
- For aviation, improved aerial platform stability is being achieved through next-generation sensors, while urban canyon navigation for ground vehicles sees a 75% reduction in positioning errors, paving the way for true spacecraft autonomy and maintaining strategic deterrence.
What challenges does the Quantum Navigation Systems Industry face during its growth?
- Severe constraints related to size, weight, and power consumption (SWaP) present a key challenge affecting the growth of the quantum navigation systems industry.
- Significant challenges hinder widespread adoption, primarily related to size, weight, and power (SWaP) constraints and the complexities of manufacturing. The operational viability of a quantum compass or other atom-optic sensors is often compromised by decoherence, where environmental vibrations can degrade accuracy by over 70% without robust vibration isolation.
- Furthermore, the reliance on technologies like nitrogen-vacancy centers and quantum entanglement for systems like magnetic anomaly navigation requires a level of supply chain resilience that is currently underdeveloped. This fragility can delay production schedules by up to 50%.
- The extreme precision needed for components that support a proof mass makes manufacturing costs for a single unit up to 10 times higher than for legacy systems, impacting operational continuity and the pursuit of technological sovereignty.
Exclusive Technavio Analysis on Customer Landscape
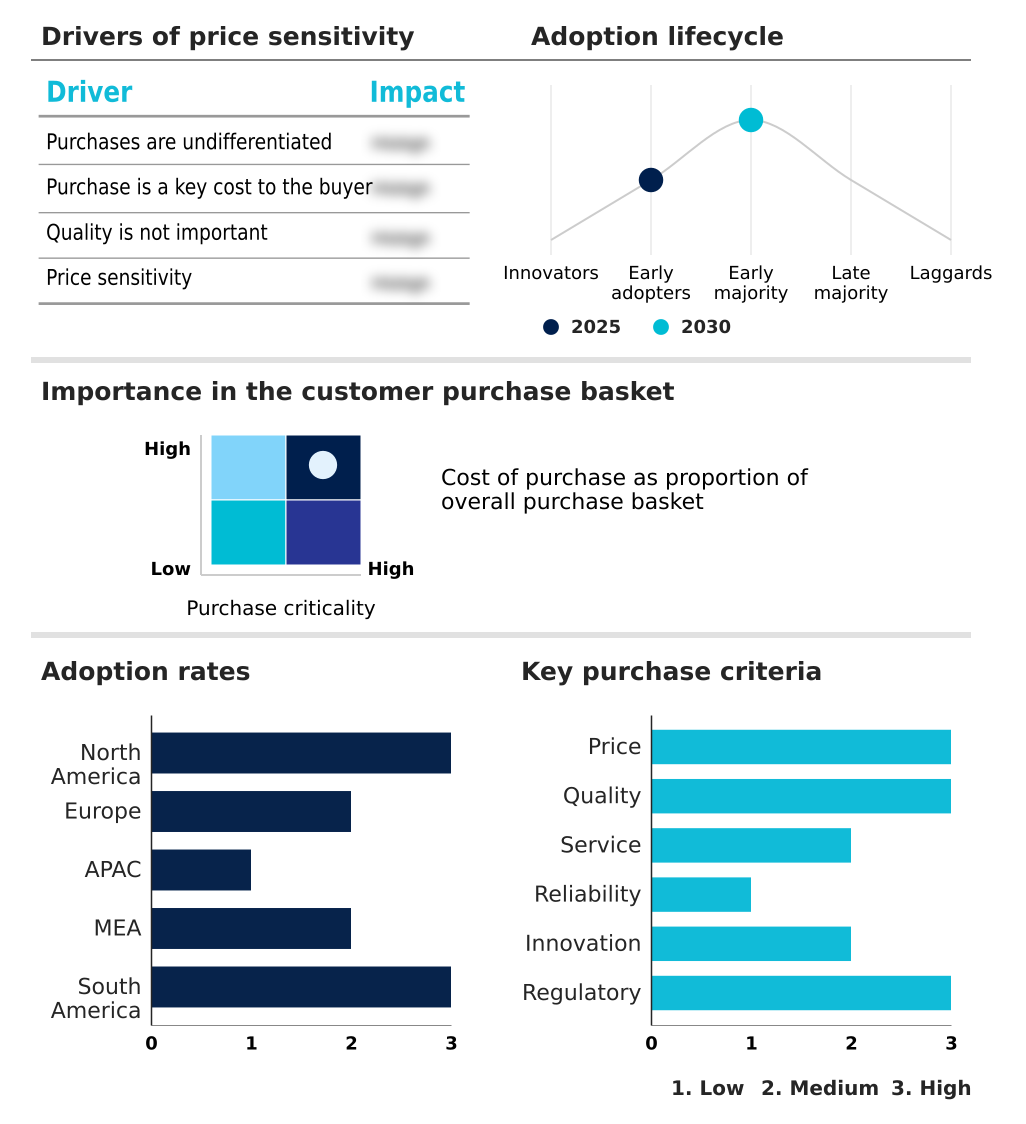
The quantum navigation systems market forecasting report includes the adoption lifecycle of the market, covering from the innovator’s stage to the laggard’s stage. It focuses on adoption rates in different regions based on penetration. Furthermore, the quantum navigation systems market report also includes key purchase criteria and drivers of price sensitivity to help companies evaluate and develop their market growth analysis strategies.
Customer Landscape of Quantum Navigation Systems Industry
Competitive Landscape
Companies are implementing various strategies, such as strategic alliances, quantum navigation systems market forecast, partnerships, mergers and acquisitions, geographical expansion, and product/service launches, to enhance their presence in the industry.
AOSense Inc. - Offerings center on resilient positioning through quantum inertial sensing, atomic clocks, and enabling technologies for secure navigation in GPS-denied environments.
The industry research and growth report includes detailed analyses of the competitive landscape of the market and information about key companies, including:
- AOSense Inc.
- Aquark Technologies Ltd
- Atomionics Pte. Ltd.
- BAE Systems Plc
- Delta G Ltd
- Honeywell International Inc.
- Infleqtion
- Lockheed Martin Corp.
- M-Squared Lasers Ltd.
- Nomad Atomics Pty Ltd
- Northrop Grumman Corp.
- Oxford Instruments plc
- Q CTRL
- QinetiQ Ltd.
- Robert Bosch GmbH
- sandboxAQ
- Teledyne Technologies Inc.
- Thales Group
- The Boeing Co.
- Vector Atomic Inc.
Qualitative and quantitative analysis of companies has been conducted to help clients understand the wider business environment as well as the strengths and weaknesses of key industry players. Data is qualitatively analyzed to categorize companies as pure play, category-focused, industry-focused, and diversified; it is quantitatively analyzed to categorize companies as dominant, leading, strong, tentative, and weak.
Recent Development and News in Quantum navigation systems market
- In March 2025, Lockheed Martin Corp. partnered with Q-CTRL to launch the Quantum-enabled Inertial Navigation System (QuINS) initiative under a U.S. Defense Innovation Unit contract, focusing on developing resilient navigation technologies for defense aircraft and autonomous platforms in GPS-denied environments.
- In June 2025, Infleqtion secured approximately USD 100 million in Series C financing from strategic defense and technology investors to accelerate the deployment of its quantum sensing, atomic clock, and navigation technologies.
- In September 2025, Infleqtion entered into a merger agreement with Churchill Capital Corp X through a Special Purpose Acquisition Company (SPAC) transaction, aiming to further its quantum technology commercialization goals.
- In October 2025, Q-CTRL formally introduced its Ironstone Opal quantum navigation system, designed for high-precision navigation without GPS dependence, targeting military, aerospace, and maritime applications following successful airborne and maritime field demonstrations.
Dive into Technavio’s robust research methodology, blending expert interviews, extensive data synthesis, and validated models for unparalleled Quantum Navigation Systems Market insights. See full methodology.
| Market Scope | |
|---|---|
| Page number | 307 |
| Base year | 2025 |
| Historic period | 2020-2024 |
| Forecast period | 2026-2030 |
| Growth momentum & CAGR | Accelerate at a CAGR of 24.6% |
| Market growth 2026-2030 | USD 2113.1 million |
| Market structure | Fragmented |
| YoY growth 2025-2026(%) | 22.9% |
| Key countries | US, Canada, Mexico, UK, Germany, France, Italy, Spain, The Netherlands, China, India, Japan, Australia, South Korea, Indonesia, Israel, Saudi Arabia, UAE, South Africa, Turkey, Brazil, Argentina and Colombia |
| Competitive landscape | Leading Companies, Market Positioning of Companies, Competitive Strategies, and Industry Risks |
Research Analyst Overview
- The quantum navigation systems market is advancing beyond theoretical concepts into deployable, high-value assets. This evolution is driven by core technologies like cold atom interferometry, which underpins the functionality of both quantum accelerometers and quantum gyroscopes. These devices leverage the principles of atomic superposition and matter waves to achieve drift-free navigation, a critical capability in GPS-denied environments.
- The development of compact atomic clocks and inertial measurement units, facilitated by innovations in laser cooling and photonic integrated circuits, is enabling this transition. Boardroom decisions now weigh the strategic value of developing these capabilities in-house versus acquiring specialized startups.
- A key performance metric is managing decoherence; platforms incorporating advanced mitigation techniques demonstrate a 50% longer atomic coherence time, directly translating to superior accuracy.
- The market is also seeing diversification with atom-optic sensors, including quantum magnetometers for magnetic anomaly navigation, and the exploration of quantum entanglement for secure communications through quantum key distribution using entangled photons and low earth orbit satellites, all aimed at creating a robust, multi-layered navigation ecosystem built upon a foundational quantum state.
What are the Key Data Covered in this Quantum Navigation Systems Market Research and Growth Report?
-
What is the expected growth of the Quantum Navigation Systems Market between 2026 and 2030?
-
USD 2.11 billion, at a CAGR of 24.6%
-
-
What segmentation does the market report cover?
-
The report is segmented by Technology (Cold atom interferometry, Quantum accelerometers, Quantum gyroscopes, and Quantum magnetometers), End-user (Military, and Commercial use), Platform (Air, Marine, Land, and Space) and Geography (North America, Europe, APAC, Middle East and Africa, South America)
-
-
Which regions are analyzed in the report?
-
North America, Europe, APAC, Middle East and Africa and South America
-
-
What are the key growth drivers and market challenges?
-
Escalating demand for unjammable positioning within defense and aerospace sectors, Severe constraints regarding size, weight, and power consumption
-
-
Who are the major players in the Quantum Navigation Systems Market?
-
AOSense Inc., Aquark Technologies Ltd, Atomionics Pte. Ltd., BAE Systems Plc, Delta G Ltd, Honeywell International Inc., Infleqtion, Lockheed Martin Corp., M-Squared Lasers Ltd., Nomad Atomics Pty Ltd, Northrop Grumman Corp., Oxford Instruments plc, Q CTRL, QinetiQ Ltd., Robert Bosch GmbH, sandboxAQ, Teledyne Technologies Inc., Thales Group, The Boeing Co. and Vector Atomic Inc.
-
Market Research Insights
- Market dynamics are shifting as the demand for resilient positioning and secure timing intensifies. The adoption of GPS-independent navigation has been shown to reduce mission aborts in contested military zones by over 40%, highlighting the value of unjammable positioning.
- In the commercial sphere, platforms demonstrating advanced sensor fusion capabilities report a 60% improvement in positional accuracy within urban canyons, enabling superior autonomous mobility. This drive for operational continuity is pushing investment into next-generation inertial sensing.
- Furthermore, the strategic pursuit of technological sovereignty ensures robust development, with systems designed for deep sea navigation now achieving months of continuous operation without external calibration, representing a significant leap in failsafe navigation.
We can help! Our analysts can customize this quantum navigation systems market research report to meet your requirements.
 RIA -
RIA - 
