Radiation Detection Monitoring And Safety Market Size 2025-2029
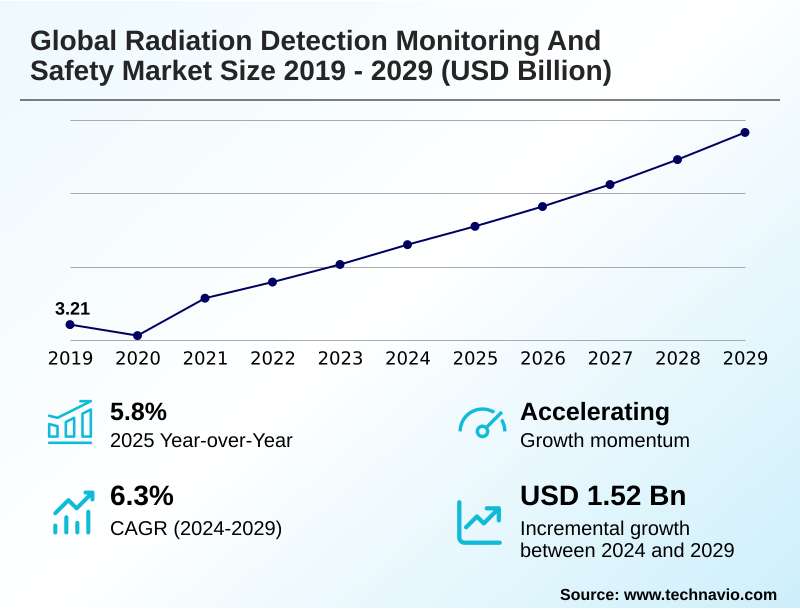
The radiation detection monitoring and safety market size is valued to increase by USD 1.52 billion, at a CAGR of 6.3% from 2024 to 2029. Increasing military expenditure will drive the radiation detection monitoring and safety market.
Major Market Trends & Insights
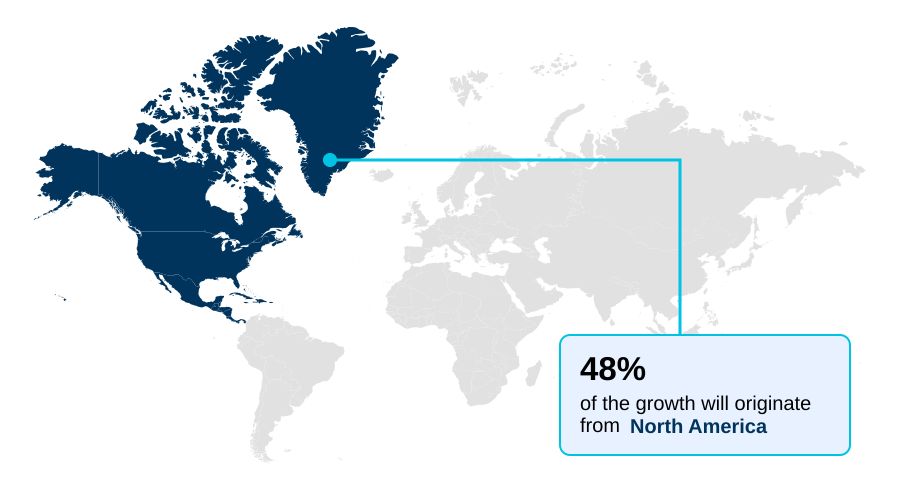
- North America dominated the market and accounted for a 48% growth during the forecast period.
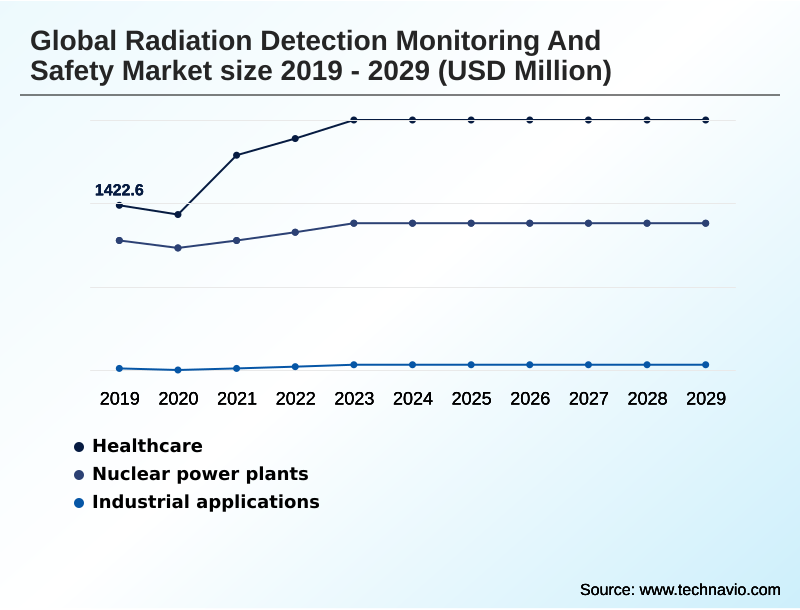
- By Application - Healthcare segment was valued at USD 2.04 billion in 2023
- By Product - Detection and monitoring products segment accounted for the largest market revenue share in 2023
Market Size & Forecast
- Market Opportunities: USD 2.62 billion
- Market Future Opportunities: USD 1.52 billion
- CAGR from 2024 to 2029 : 6.3%
Market Summary
- The radiation detection monitoring and safety market is fundamentally driven by the need for regulatory compliance and the mitigation of radiological risks across healthcare, industrial, and defense sectors. Growth is supported by stringent safety mandates and an increasing reliance on radiation-based technologies.
- Key trends include the integration of artificial intelligence for predictive analytics and the miniaturization of portable detectors, enhancing their deployment in field applications. For instance, a nuclear facility can leverage a network of real-time monitors to continuously analyze environmental data, enabling automated alerts and optimizing maintenance schedules based on predictive failure analysis, which significantly improves operational uptime and safety compliance.
- However, the high capital investment required for advanced systems remains a significant consideration for many organizations, balancing the need for state-of-the-art protection against budgetary constraints.
- The market's evolution is shaped by this interplay between technological innovation, regulatory pressures, and economic practicalities, pushing for more efficient and accessible solutions to manage radiation exposure effectively and ensure a secure environment for both personnel and the public.
What will be the Size of the Radiation Detection Monitoring And Safety Market during the forecast period?
Get Key Insights on Market Forecast (PDF) Get Free Sample
How is the Radiation Detection Monitoring And Safety Market Segmented?
The radiation detection monitoring and safety industry research report provides comprehensive data (region-wise segment analysis), with forecasts and estimates in "USD million" for the period 2025-2029, as well as historical data from 2019-2023 for the following segments.
- Application
- Healthcare
- Nuclear power plants
- Homeland security and defense
- Industrial applications
- Product
- Detection and monitoring products
- Safety products
- Technology
- Gas-filled detectors
- Scintillators
- Solid-state detectors
- Geography
- North America
- US
- Canada
- Mexico
- Europe
- Germany
- France
- UK
- APAC
- China
- Japan
- India
- Middle East and Africa
- Saudi Arabia
- UAE
- Turkey
- South America
- Brazil
- Argentina
- Colombia
- Rest of World (ROW)
- North America
By Application Insights
The healthcare segment is estimated to witness significant growth during the forecast period.
The healthcare segment is driven by the increasing integration of radiation-based technologies in diagnostics and therapeutics.
Advanced systems for radiation dose monitoring are crucial for ensuring medical radiation safety and patient dose management, particularly during procedures involving computed tomography (CT) and positron emission tomography (PET).
Adherence to the as low as reasonably achievable (ALARA) principle necessitates the use of personal dosimeters, including thermoluminescent dosimeter (TLD) models, and real-time monitoring systems to manage radiation exposure control.
Institutions employ radiation protection officers (RPO) to oversee radiological imaging safety protocols and ensure radiation therapy quality assurance.
This reliance on sophisticated radiation safety equipment for medical physics support has resulted in systems that improve dose accuracy by over 15%, enhancing both patient outcomes and occupational safety.
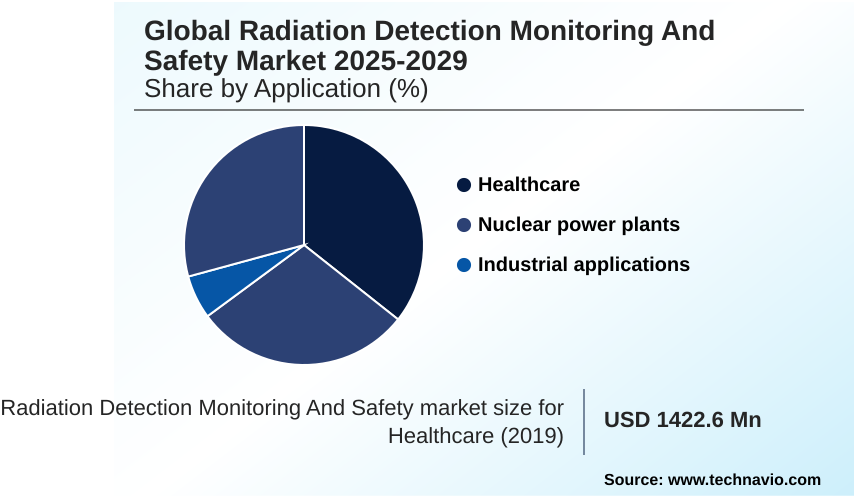
The Healthcare segment was valued at USD 2.04 billion in 2023 and showed a gradual increase during the forecast period.
Regional Analysis
North America is estimated to contribute 48% to the growth of the global market during the forecast period.Technavio’s analysts have elaborately explained the regional trends and drivers that shape the market during the forecast period.
See How Radiation Detection Monitoring And Safety Market Demand is Rising in North America Get Free Sample
The geographic landscape is led by North America, which accounts for nearly 48% of the market's incremental growth, with the US representing a market size more than four times that of Canada.
This dominance is sustained by robust regulatory compliance frameworks and high investment in nuclear facility decommissioning and cargo screening systems.
In these mature regions, the adoption of advanced radiation protection solutions, including fixed and portable radiation detectors for environmental monitoring, is about 20% faster than in regions with developing standards.
Key applications such as nuclear power plant monitoring and radiological dispersal device (RDD) detection drive demand.
The emphasis on established radiation safety protocols and preparedness for a nuclear accident response ensures consistent investment in sophisticated radiation detection equipment across the continent, solidifying its market leadership.
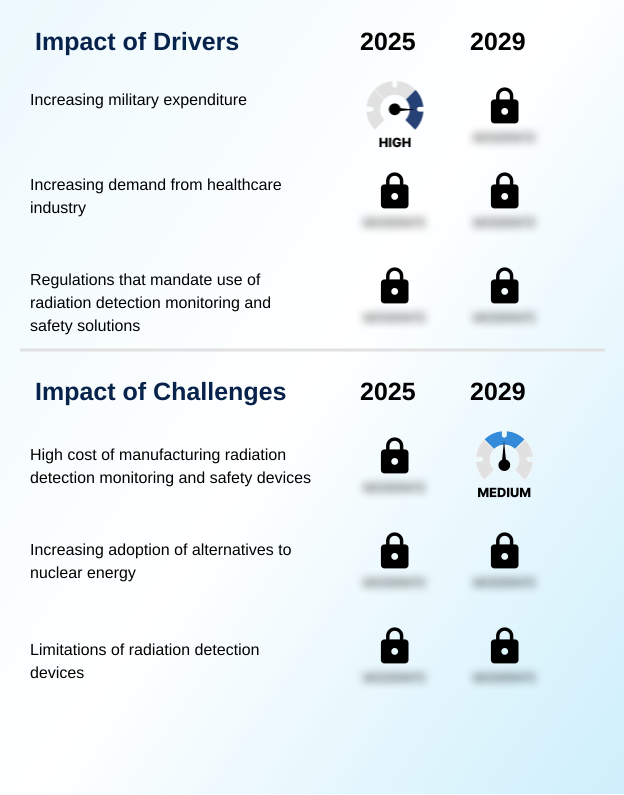
Market Dynamics
Our researchers analyzed the data with 2024 as the base year, along with the key drivers, trends, and challenges. A holistic analysis of drivers will help companies refine their marketing strategies to gain a competitive advantage.
- Advancements in the market are increasingly specialized, focusing on specific operational needs and technological capabilities. The foundational gas-filled detector ionization principle analysis continues to inform the design of robust instruments, while scintillator-based gamma spectroscopy systems offer enhanced energy resolution for complex environments. The development of solid-state detectors for neutron monitoring is critical for security and research applications.
- For personnel safety, real-time personal electronic dosimeter usage is becoming standard practice, with many organizations exploring AI integration in radiation monitoring to improve predictive threat assessment. In logistics and border control, radiation portal monitors for cargo inspection are essential. Healthcare is seeing a significant shift toward wearable dosimetry for healthcare workers and the implementation of advanced radiological imaging safety protocols.
- For high-security scenarios, active interrogation systems for nuclear materials and the deployment of unmanned systems for radiation mapping offer new capabilities. Strategic planning now includes environmental radiation monitoring network design and enhancing portable isotope identification device performance. Advanced techniques like Compton suppression spectrometry techniques and beta-gamma coincidence counting methods are improving laboratory analysis.
- Other key areas include neutron activation analysis applications, ensuring quality assurance in radiation therapy, and utilizing digital signal processing for detectors. These developments, which also support radiation detection for first responders and improve cybersecurity for nuclear monitoring systems, show that facilities adopting such integrated systems report a nearly two-fold improvement in early anomaly detection compared to legacy methods.
What are the key market drivers leading to the rise in the adoption of Radiation Detection Monitoring And Safety Industry?
- Increasing global military expenditure serves as a key driver, stimulating demand and fostering growth within the radiation detection, monitoring, and safety market.
- Market growth is significantly driven by heightened regulatory pressures and expanding applications in critical sectors.
- The enforcement of stringent occupational safety standards compels industries to invest in reliable systems for managing ionizing radiation, with facilities adopting comprehensive radiation hazard management programs reporting up to a 15% reduction in safety incidents.
- Increased spending on homeland security applications has boosted demand for area radiation monitors and tools for nuclear material categorization. In healthcare, the growing use of radiopharmaceutical applications requires precise radiation measurement instruments and effective x-ray radiation shielding.
- The need for emergency response preparedness also fuels investment in portable technologies like Geiger-Muller tubes for rapid radiation source identification, ensuring safety across industrial radiography and beyond.
What are the market trends shaping the Radiation Detection Monitoring And Safety Industry?
- Technological advancements in radiation detection are a key emerging market trend. These innovations are significantly enhancing the precision, responsiveness, and predictive capabilities of modern safety and monitoring systems.
- Key trends are reshaping the market, driven by the adoption of advanced technologies that offer superior performance. The integration of AI and machine learning into spectroscopy systems is a primary catalyst, enabling more accurate radiation threat detection and background radiation analysis. Innovations in solid-state detectors and high-purity germanium detectors are improving the precision of alpha, beta, and gamma radiation detection.
- This allows for the development of more compact and effective handheld survey meters. These advancements have demonstrated the ability to enhance detection sensitivity by over 25% in complex environments. Moreover, the focus on radiation hardened electronics is extending the operational life of devices used in demanding settings like space exploration, where analysis of space radiation effects is critical.
What challenges does the Radiation Detection Monitoring And Safety Industry face during its growth?
- The high cost associated with manufacturing sophisticated radiation detection, monitoring, and safety devices presents a key challenge that affects widespread industry adoption and growth.
- The primary market challenge remains the high upfront cost and total cost of ownership for advanced detection systems. The capital investment for sophisticated devices utilizing scintillators or gas-filled detectors, such as ionization chambers and proportional counters, can be substantial. For example, the initial outlay for comprehensive radiation dosimetry services and equipment can increase departmental budgets by over 30%.
- Furthermore, the expense of specialized radiation shielding materials and systems for radioactive isotope identification adds to the financial burden. This high cost structure can slow adoption, particularly for smaller entities or in regions with limited budgets, even as the threat of dirty bomb prevention and the need for nuclear non-proliferation monitoring grow.
- Consequently, managing radioactive waste management costs alongside equipment acquisition remains a significant hurdle.
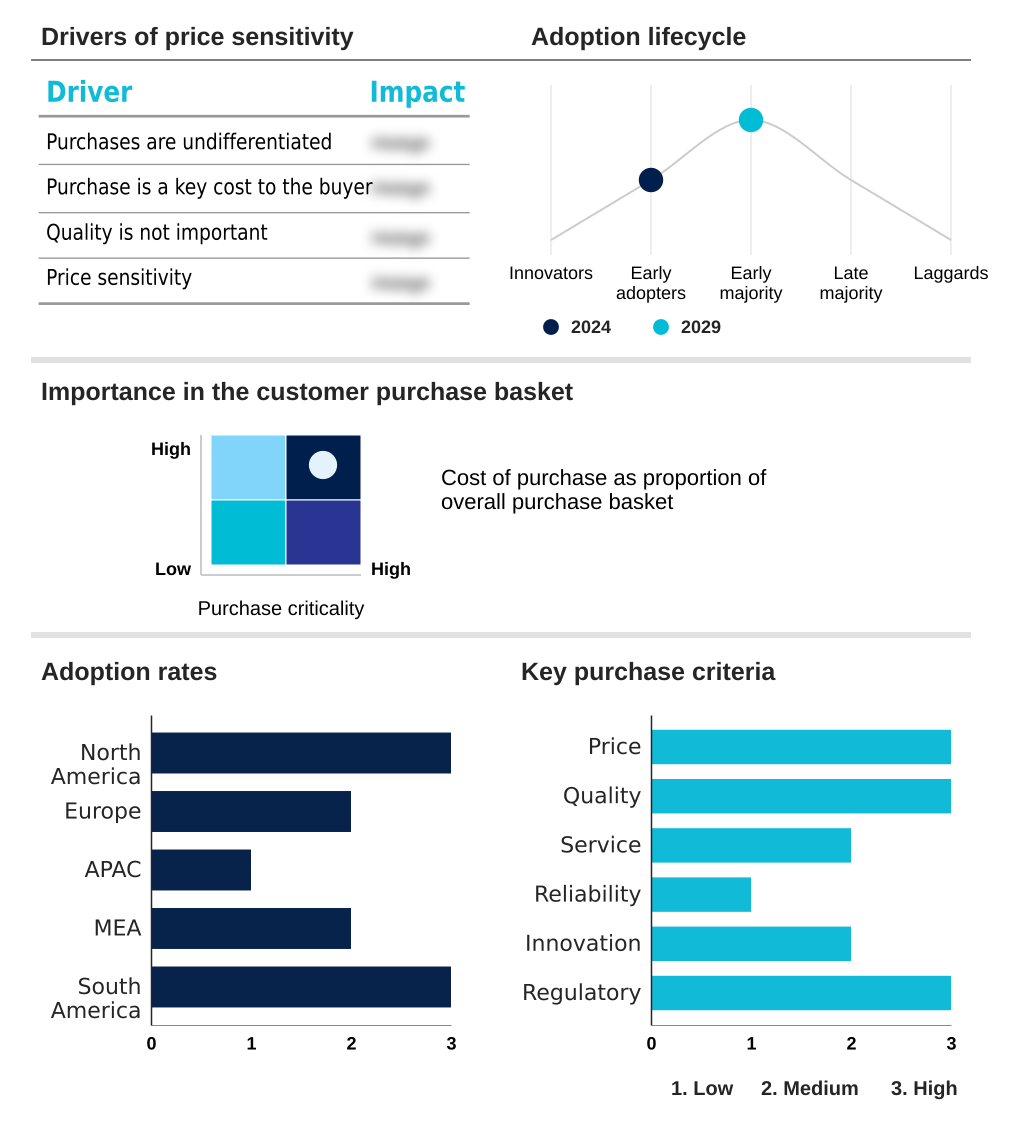
Exclusive Technavio Analysis on Customer Landscape
The radiation detection monitoring and safety market forecasting report includes the adoption lifecycle of the market, covering from the innovator’s stage to the laggard’s stage. It focuses on adoption rates in different regions based on penetration. Furthermore, the radiation detection monitoring and safety market report also includes key purchase criteria and drivers of price sensitivity to help companies evaluate and develop their market growth analysis strategies.
Customer Landscape of Radiation Detection Monitoring And Safety Industry
Competitive Landscape
Companies are implementing various strategies, such as strategic alliances, radiation detection monitoring and safety market forecast, partnerships, mergers and acquisitions, geographical expansion, and product/service launches, to enhance their presence in the industry.
Amray Medical - Offerings include advanced dosimetry systems and personal protective equipment, providing comprehensive radiation protection solutions for safety in high-exposure environments.
The industry research and growth report includes detailed analyses of the competitive landscape of the market and information about key companies, including:
- Amray Medical
- Arktis Radiation Detectors Ltd.
- Baker Hughes Co.
- Centronic Ltd.
- ECOTEST
- Fuji Electric Co. Ltd.
- Honeywell International Inc.
- International Medcom Inc.
- John Caunt Scientific Ltd.
- LANDAUER
- Ludlum Measurements Inc.
- Mirion Technologies Inc.
- ORTEC
- Rapiscan Systems Inc.
- S.E. International Inc.
- Teledyne Technologies Inc.
- Thermo Fisher Scientific Inc.
- UAB Polimaster Europe
- Unfors RaySafe AB
Qualitative and quantitative analysis of companies has been conducted to help clients understand the wider business environment as well as the strengths and weaknesses of key industry players. Data is qualitatively analyzed to categorize companies as pure play, category-focused, industry-focused, and diversified; it is quantitatively analyzed to categorize companies as dominant, leading, strong, tentative, and weak.
Recent Development and News in Radiation detection monitoring and safety market
- In August, 2024, Mirion Technologies Inc. announced the launch of its new Instadose VUE wireless dosimeter, which provides real-time dose data and monitoring for occupational radiation safety, enhancing connectivity through a proprietary cloud-based platform.
- In November, 2024, Thermo Fisher Scientific Inc. entered into a strategic collaboration with an AI software developer to integrate machine learning algorithms into its RadEye spectroscopic personal radiation detectors, aiming to improve threat identification and reduce false alarms.
- In February, 2025, Honeywell International Inc. completed the acquisition of a specialized developer of advanced solid-state detector technologies, a move intended to bolster its portfolio for the aerospace and defense sectors.
- In May, 2025, Teledyne Technologies Inc. received regulatory certification from the US Nuclear Regulatory Commission for its new FLIR Griffin G510x environmental monitoring system, validating its use for continuous, autonomous radiation detection at nuclear facilities.
Dive into Technavio’s robust research methodology, blending expert interviews, extensive data synthesis, and validated models for unparalleled Radiation Detection Monitoring And Safety Market insights. See full methodology.
| Market Scope | |
|---|---|
| Page number | 287 |
| Base year | 2024 |
| Historic period | 2019-2023 |
| Forecast period | 2025-2029 |
| Growth momentum & CAGR | Accelerate at a CAGR of 6.3% |
| Market growth 2025-2029 | USD 1523.8 million |
| Market structure | Fragmented |
| YoY growth 2024-2025(%) | 5.8% |
| Key countries | US, Canada, Mexico, Germany, France, UK, Italy, Spain, Russia, China, Japan, India, South Korea, Australia, Indonesia, Saudi Arabia, UAE, Turkey, South Africa, Egypt, Brazil, Argentina and Colombia |
| Competitive landscape | Leading Companies, Market Positioning of Companies, Competitive Strategies, and Industry Risks |
Research Analyst Overview
- The radiation detection monitoring and safety market is characterized by continuous innovation aimed at enhancing safety and operational efficiency. The development of advanced radiation detection equipment, from handheld survey meters and thermoluminescent dosimeter (TLD) technology to complex spectroscopy systems and high-purity germanium detectors, addresses diverse needs.
- Core technologies like gas-filled detectors, including ionization chambers and Geiger-Muller tubes, coexist with advanced scintillators and solid-state detectors. Boardroom decisions increasingly weigh the capital expenditure for real-time monitoring systems against the operational benefits of automated radiation dose monitoring, which has been shown to reduce manual reporting errors by over 90%.
- Key applications range from personal dosimeters for radiation exposure control and area radiation monitors for facility-wide safety to specialized radiation portal monitors for security. The market provides critical radiation protection solutions for radiological imaging safety, radiation therapy quality assurance, and environmental monitoring.
- The ability to perform radioactive isotope identification, neutron detection, and categorize nuclear material is essential for both commercial and government end-users, who rely on these radiation measurement instruments and dosimetry services to manage ionizing radiation risks.
What are the Key Data Covered in this Radiation Detection Monitoring And Safety Market Research and Growth Report?
-
What is the expected growth of the Radiation Detection Monitoring And Safety Market between 2025 and 2029?
-
USD 1.52 billion, at a CAGR of 6.3%
-
-
What segmentation does the market report cover?
-
The report is segmented by Application (Healthcare, Nuclear power plants, Industrial applications, Nuclear power plants), Product (Detection and monitoring products, Safety products), Technology (Gas-filled detectors, Scintillators, Solid-state detectors) and Geography (North America, Europe, APAC, Middle East and Africa, South America)
-
-
Which regions are analyzed in the report?
-
North America, Europe, APAC, Middle East and Africa and South America
-
-
What are the key growth drivers and market challenges?
-
Increasing military expenditure, High cost of manufacturing radiation detection monitoring and safety devices
-
-
Who are the major players in the Radiation Detection Monitoring And Safety Market?
-
Amray Medical, Arktis Radiation Detectors Ltd., Baker Hughes Co., Centronic Ltd., ECOTEST, Fuji Electric Co. Ltd., Honeywell International Inc., International Medcom Inc., John Caunt Scientific Ltd., LANDAUER, Ludlum Measurements Inc., Mirion Technologies Inc., ORTEC, Rapiscan Systems Inc., S.E. International Inc., Teledyne Technologies Inc., Thermo Fisher Scientific Inc., UAB Polimaster Europe and Unfors RaySafe AB
-
Market Research Insights
- The market is shaped by a dynamic interplay of technological innovation and stringent regulatory demands. The adoption of advanced radiation safety protocols is now standard, driven by a need to exceed occupational safety standards. For instance, integrated systems for radiation hazard management can improve threat identification accuracy by over 25%.
- Furthermore, automated industrial radiography safety solutions reduce manual compliance reporting time by 40%, directly impacting operational efficiency. The expansion of radiopharmaceutical applications continues to fuel demand for specialized equipment.
- This constant evolution underscores the market's focus on delivering solutions that not only ensure safety but also provide quantifiable improvements in operational workflows and adherence to complex compliance frameworks, with a significant portion of new investments directed toward these goals.
We can help! Our analysts can customize this radiation detection monitoring and safety market research report to meet your requirements.
 RIA -
RIA - 
