
Real Time Payments Market Size 2025-2029
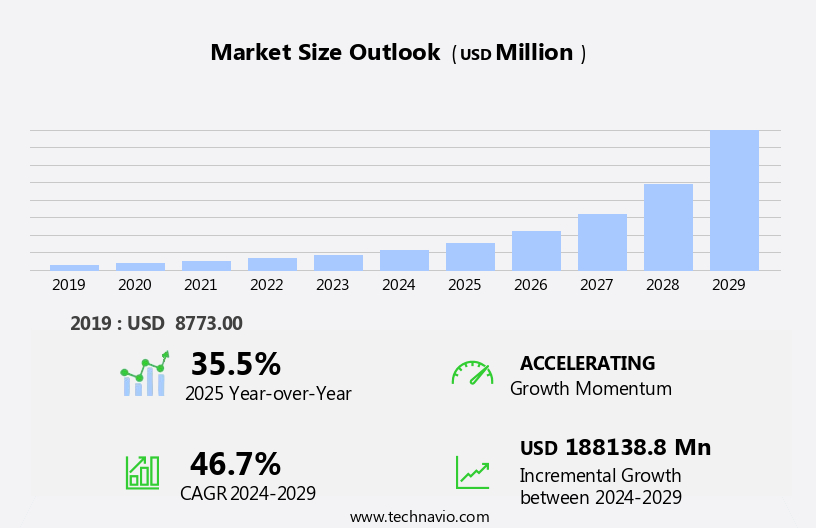
The real time payments market size is forecast to increase by USD 188.14 billion at a CAGR of 46.7% between 2024 and 2029.
- The Real Time Payments (RTP) market is experiencing significant growth, driven by the increasing adoption of smartphones and access to high-speed Internet. The digitalization of payments is accelerating, with consumers and businesses seeking faster and more convenient transaction processing. However, this rapid growth comes with challenges. Security concerns, particularly the rise in data breaches, are a major challenge for the RTP market. As more money transactions move online, ensuring the security and privacy of sensitive financial information becomes increasingly important. Companies must invest in robust security measures to mitigate these risks and build trust with their customers.
- Additionally, regulatory compliance and interoperability between different payment systems are also key challenges. Despite these hurdles, the RTP market presents significant opportunities for innovation and growth. Companies that can effectively address security concerns and navigate regulatory complexities will be well-positioned to capitalize on the market's momentum and meet the evolving needs of digital consumers and businesses.
What will be the Size of the Real Time Payments Market during the forecast period?
- Payment service providers play a crucial role in the dynamic payment market, offering various solutions such as payment user interfaces, payment processors, virtual cards payment, and payment facilitators. Embedded finance is a growing trend, integrating financial services into non-financial industries through these providers. Mobile banking and digital identity are key components of this evolving payment ecosystem. Payment processors ensure seamless transactions, while payment orchestration optimizes the use of multiple processors. Payment fraud detection and risk management are essential for maintaining security standards, including PCI DSS. Faster payments, such as real-time risk assessment and account-to-account transactions, are driving the market.
- Distributed ledger technology and digital banking innovations, like request to pay and push payments, are transforming the payment landscape. Payment transaction costs, processing time, and user experience are critical factors influencing consumer preferences. Payment gateway aggregation and network connectivity enhance payment network interoperability, enabling SWIFT gpi and frictionless payments. Payment transaction volume and success rate are essential metrics for businesses, with pull payments and payment rejection rate impacting approval rates. Payment network interoperability and seamless payments contribute to a better user experience. Payment data analytics provide valuable insights, improving overall payment processing efficiency.
How is this Real Time Payments Industry segmented?
The real time payments industry research report provides comprehensive data (region-wise segment analysis), with forecasts and estimates in "USD million" for the period 2025-2029, as well as historical data from 2019-2023 for the following segments.
- Component
- Solutions
- Services
- Deployment
- On-premises
- Cloud
- Sector
- Large enterprises
- SMEs
- Geography
- North America
- US
- Canada
- Europe
- France
- Germany
- Italy
- UK
- Middle East and Africa
- APAC
- China
- India
- Singapore
- Thailand
- South America
- Rest of World (ROW)
- North America
By Component Insights
The solutions segment is estimated to witness significant growth during the forecast period.
In the dynamic realm of financial transactions, advanced payment solutions have become integral components of modern business operations. These solutions encompass payment gateway systems, wallet solutions, and point-of-sale systems. Payment gateways serve as secure and real-time digital payment acceptance platforms, enabling seamless transactions between merchants, shoppers, and financial institutions. The proliferation of the Internet and its decreasing costs have fueled the digital and technological shift in various sectors, including retail, education, agriculture, logistics, finance, and healthcare. This transformation has led to a significant surge in digital payments across multiple industries worldwide. Payment wallet solutions, consisting of mobile wallets and peer-to-peer (P2P) payments, have gained immense popularity due to their convenience and accessibility.
The integration of cloud computing, application programming interfaces (APIs), and API integration has streamlined payment processing and authentication, enhancing the overall customer experience. Biometric authentication, two-factor authentication, and fraud prevention measures ensure the security of these transactions. Moreover, the advent of open banking, real-time data, and artificial intelligence has enabled instant payments, payment optimization, and payment settlement. Financial institutions and payment networks have adopted these advanced technologies to provide faster and more secure payment solutions. Digital wallets and payment clearing have further simplified the payment process, while payment gateways and routing have ensured seamless payment acceptance. The continuous innovation in payment solutions, including mobile wallets and instant payments, is expected to further revolutionize the way businesses manage their financial transactions.

Get a glance at the market report of share of various segments Request Free Sample
The Solutions segment was valued at USD 7.54 billion in 2019 and showed a gradual increase during the forecast period.
Regional Analysis
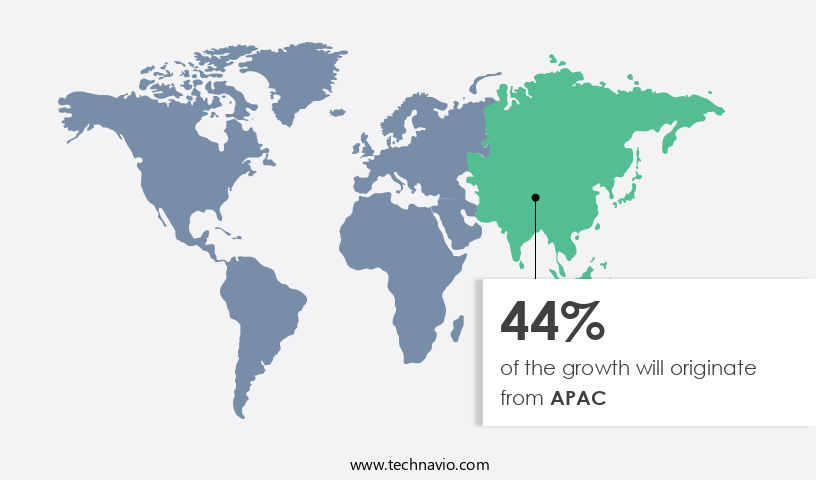
APAC is estimated to contribute 44% to the growth of the global market during the forecast period.Technavio's analysts have elaborately explained the regional trends and drivers that shape the market during the forecast period.
For more insights on the market size of various regions, Request Free Sample
In the dynamic realm of global payment systems, the real-time payments market is witnessing substantial expansion, particularly in the Asia Pacific (APAC) region. This growth is fueled by the increasing preference for digital payment solutions and technological advancements in financial infrastructure. Financial institutions in APAC are embracing innovative technologies, such as machine learning, artificial intelligence, and open banking, to expedite transaction processing and bolster security. Regulatory frameworks are also playing a pivotal role in facilitating this expansion, ensuring compliance and fostering a competitive landscape. Collaborative efforts between financial entities and technology providers are accelerating the development and implementation of real-time payment systems.
Moreover, the customer-centric focus in APAC is driving the adoption of these systems, as consumers increasingly demand faster and more reliable payment methods. Payment networks, payment gateways, and payment processing solutions are being optimized to facilitate instant transactions. Biometric authentication, two-factor authentication, and digital wallets are becoming standard features to enhance security and convenience. Cloud computing, API integration, and mobile payments are transforming the way businesses and consumers manage their financial transactions. Payment clearing and settlement processes are being streamlined to ensure real-time data availability and reconciliation. The integration of cross-border payments, international payments, and payment services into these systems is expanding their reach and utility.
Data security remains a top priority, with advanced encryption and fraud prevention measures being employed to protect sensitive financial information. Overall, the real-time payments market is poised for significant growth, as it continues to adapt and innovate to meet the evolving needs of businesses and consumers.
Market Dynamics
Our researchers analyzed the data with 2024 as the base year, along with the key drivers, trends, and challenges. A holistic analysis of drivers will help companies refine their marketing strategies to gain a competitive advantage.
What are the key market drivers leading to the rise in the adoption of Real Time Payments Industry?
- Increasing adoption of smartphones and access to high-speed Internet is the key driver of the market.
- The real-time payments market has witnessed significant growth due to the increasing usage of smartphones and the proliferation of 3G, 4G, and soon-to-be-widely-adopted 5G networks. These technological advancements enable seamless transactions on mobile devices, making real-time payments an increasingly convenient option for clients worldwide. The widespread distribution networks of major smartphone brands, such as Samsung Electronics Co Ltd, Xiaomi Corp, and Guangdong Oppo Mobile Telecommunications Corp., Ltd, have made these devices accessible to a larger population, including those in rural areas, thereby expanding the reach of real-time payment solutions.
- The 5G network's growing popularity in North America, APAC, Europe, and the Middle East is expected to further accelerate the industry's expansion.
What are the market trends shaping the Real Time Payments Industry?
- Rapid digitalization in payments sector is the upcoming market trend.
- In the evolving post-pandemic landscape, digital currencies, biometrics, and real-time payments are gaining traction among consumers as alternatives to cash. According to a recent report by PYMNTS.Com, a leading provider of payment data, news, and insights, technology is expanding to novel use cases, enabling contactless transactions for restaurants and retailers in the UK. Moreover, the emergence of dynamic real-time payment credit empowers merchants to scan customer codes, with the system automatically detecting fraud.
- These advancements and activities in digitalized payments are poised to create potential growth opportunities for the global real-time payments market. By embracing real-time payments, businesses can streamline transactions, enhance security, and cater to consumer preferences for quick and convenient payment solutions.
What challenges does the Real Time Payments Industry face during its growth?
- Rise in data breaches and security issues while conducting payments is a key challenge affecting the industry growth.
- Real-time payments market growth is driven by the increasing adoption of innovative payment technologies, which offer significant benefits in terms of convenience and speed. However, market expansion is being hindered by rising security concerns and data breaches. Consumers are increasingly wary of making payments through real-time networks due to the potential risks of third-party mobile service providers accessing their financial information. The threat of identity theft and data breaches is also projected to escalate in the coming years, owing to the widespread use of public Wi-Fi, weak passwords, and phishing attacks.
- Additionally, scammers are exploiting real-time payment systems by substituting merchant codes with their own, resulting in customers inadvertently paying fraudsters instead. These factors are expected to pose significant challenges to the market's growth during the forecast period.
Exclusive Customer Landscape
The real time payments market forecasting report includes the adoption lifecycle of the market, covering from the innovator's stage to the laggard's stage. It focuses on adoption rates in different regions based on penetration. Furthermore, the real time payments market report also includes key purchase criteria and drivers of price sensitivity to help companies evaluate and develop their market growth analysis strategies.
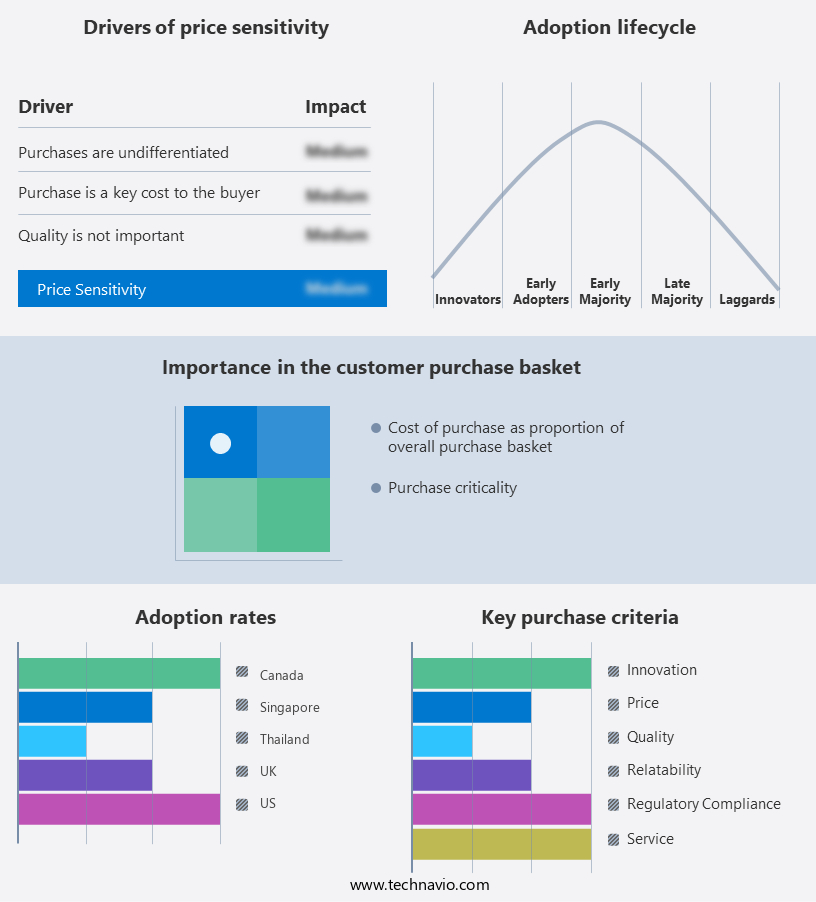
Customer Landscape
Key Companies & Market Insights
Companies are implementing various strategies, such as strategic alliances, real time payments market forecast, partnerships, mergers and acquisitions, geographical expansion, and product/service launches, to enhance their presence in the industry.
ACE Software Solutions Inc. - Companies provide real-time payment processing services, essential for Business-to-Business transactions, including supplier payments and refund adjustments. This efficient solution streamlines financial operations, enhancing overall business productivity. By leveraging advanced technology, these services ensure secure and accurate payment processing in real time, enabling seamless business interactions on a global scale.
The industry research and growth report includes detailed analyses of the competitive landscape of the market and information about key companies, including:
- ACE Software Solutions Inc.
- ACI Worldwide Inc.
- Ant Group
- Apple Inc.
- Cognizant Technology Solutions Corp.
- Fidelity National Information Services Inc.
- Finastra
- Fiserv Inc.
- Icon Solutions Ltd.
- Mastercard Inc.
- Microsoft Corp.
- Mindgate Solutions Pvt. Ltd.
- Montran Corp.
- PayPal Holdings Inc.
- Ripple Labs Inc.
- Sila Inc.
- Tata Consultancy Services Ltd.
- Temenos AG
- Visa Inc.
- Volante Technologies Inc.
Qualitative and quantitative analysis of companies has been conducted to help clients understand the wider business environment as well as the strengths and weaknesses of key industry players. Data is qualitatively analyzed to categorize companies as pure play, category-focused, industry-focused, and diversified; it is quantitatively analyzed to categorize companies as dominant, leading, strong, tentative, and weak.
Research Analyst Overview
The real-time payments market continues to experience significant growth and innovation, driven by the increasing demand for faster and more secure transactions. One of the key trends shaping the market is the adoption of advanced authorization methods, such as two-factor authentication and biometric authentication, to enhance payment security. Another significant development is the integration of big data and machine learning algorithms into payment processing systems. This enables financial institutions to analyze transaction data in real-time, identify patterns, and prevent fraud more effectively. The use of cloud computing and application programming interfaces (APIs) also facilitates seamless integration of payment services into various applications and platforms.
The customer experience is another critical factor influencing the real-time payments market. Mobile payments and digital wallets have gained immense popularity due to their convenience and ease of use. Instant payments and real-time data processing have become essential features for meeting the demands of today's consumers. Payment optimization and settlement are also crucial aspects of the real-time payments market. Payment networks and infrastructure play a vital role in ensuring efficient and secure transaction processing. Payment gateways and routing systems facilitate the seamless transfer of funds between financial institutions and businesses. Open banking and API integration have disrupted traditional payment processing models, enabling new payment solutions and services.
Payment innovation continues to be a key driver of growth in the market, with new technologies and business models emerging regularly. Despite the numerous benefits of real-time payments, there are also challenges that need to be addressed. Data security remains a major concern, with the need for robust security measures to protect sensitive payment information. Payment reconciliation and settlement processes also require optimization to ensure accuracy and efficiency. The real-time payments market is undergoing rapid transformation, driven by advances in technology, changing consumer preferences, and the need for faster and more secure transactions. Financial institutions and payment service providers must stay abreast of these trends and adapt to meet the evolving needs of their customers.
The market is expected to continue growing, with new technologies and business models set to disrupt traditional payment processing models further.
|
Market Scope |
|
|
Report Coverage |
Details |
|
Page number |
202 |
|
Base year |
2024 |
|
Historic period |
2019-2023 |
|
Forecast period |
2025-2029 |
|
Growth momentum & CAGR |
Accelerate at a CAGR of 46.7% |
|
Market growth 2025-2029 |
USD 188138.8 million |
|
Market structure |
Fragmented |
|
YoY growth 2024-2025(%) |
35.5 |
|
Key countries |
US, Thailand, Singapore, Germany, China, Canada, India, UK, France, and Italy |
|
Competitive landscape |
Leading Companies, Market Positioning of Companies, Competitive Strategies, and Industry Risks |
What are the Key Data Covered in this Real Time Payments Market Research and Growth Report?
- CAGR of the Real Time Payments industry during the forecast period
- Detailed information on factors that will drive the growth and forecasting between 2025 and 2029
- Precise estimation of the size of the market and its contribution of the industry in focus to the parent market
- Accurate predictions about upcoming growth and trends and changes in consumer behaviour
- Growth of the market across APAC, North America, Europe, South America, and Middle East and Africa
- Thorough analysis of the market's competitive landscape and detailed information about companies
- Comprehensive analysis of factors that will challenge the real time payments market growth of industry companies
We can help! Our analysts can customize this real time payments market research report to meet your requirements.
 RIA -
RIA - 
