Virtual Cards Market Size 2025-2029
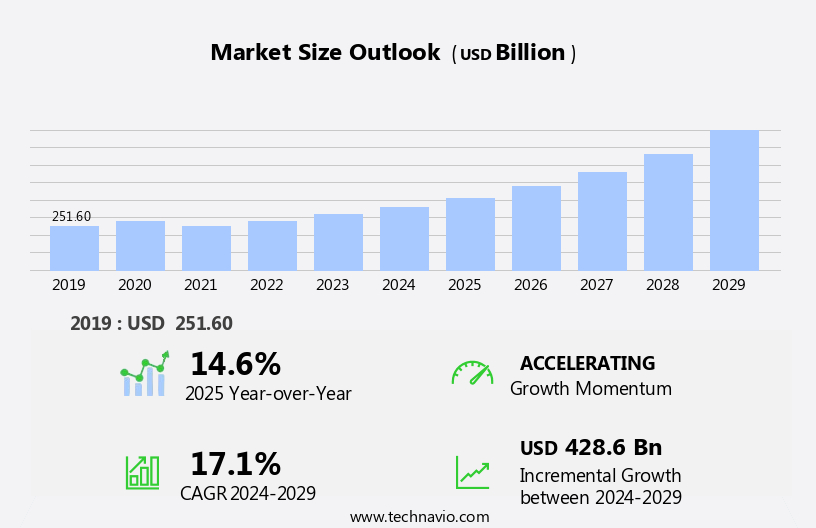
The virtual cards market size is forecast to increase by USD 428.6 billion, at a CAGR of 17.1% between 2024 and 2029.
- The market is experiencing significant growth, driven by the increasing demand for contactless payment solutions and the emergence of Near Field Communication (NFC) technology. Virtual Cards offer customers the convenience of making transactions without the need for physical cards, making them an attractive alternative in today's digital age. This trend is further fueled by the growing acceptance of contactless payment transactions, which are becoming increasingly common in various industries, from retail to transportation. However, the market faces challenges, including regulatory compliance. As contactless payment transactions become more prevalent, regulations are being put in place to ensure security and consumer protection.
- Companies must navigate these regulations to effectively capitalize on market opportunities and maintain high customer satisfaction. Additionally, ensuring the security of virtual card transactions is crucial, as data breaches can lead to significant reputational and financial damage. Therefore, investing in robust security measures is essential for market success. Companies seeking to capitalize on the market's potential must focus on innovation, regulatory compliance, and customer satisfaction to stay competitive in this dynamic market.
What will be the Size of the Virtual Cards Market during the forecast period?

Get Key Insights on Market Forecast (PDF)
Request Free Sample
- Human reliability knowledge studies in virtual card systems emphasize performance, compliance, and end-user protection across critical digital infrastructure. Key functions like card number generation, expiration date management, and virtual account linking directly influence payment authorization request accuracy. Security token integration, payment data encryption, and fraud prevention measures are essential to mitigate risks, while transaction record keeping, account balance inquiry, and customer data privacy ensure transparency and trust.
- Efficient transaction history reporting, spending limit adjustments, and the card replacement process rely on a resilient database management system and scalable system architecture design. Developers utilize a robust software development kit and detailed API documentation to enable seamless integration and fast transaction processing speed. Prioritized payment error handling and accessible customer support channels support operational continuity.
- Compliance is maintained via compliance regulations, routine system security audits, and secure data backup procedures. Optimizing user interface design, user experience, and tracking customer service metrics contribute to a reliable and responsive digital payment environment.
How is this Virtual Cards Industry segmented?
The virtual cards industry research report provides comprehensive data (region-wise segment analysis), with forecasts and estimates in "USD billion" for the period 2025-2029, as well as historical data from 2019-2023 for the following segments.
- Product
- B2B virtual cards
- B2C remote payment virtual cards
- B2C POS virtual cards
- Service
- Business use
- Consumer use
- Card Type
- Credit Card
- Debit Card
- Prepaid Card
- End-Use Industry
- Banking, Financial Services, and Insurance (BFSI)
- E-commerce
- Hospitality
- Geography
- North America
- Europe
- APAC
- Rest of World (ROW)
By Product Insights
The B2B virtual cards segment is poised for significant expansion, driven by increasing adoption of real-time digital disbursements and the growing reliance on mobile platforms enabled by broad Internet access. Industries such as banking, financial services, and insurance (BFSI), e-commerce, healthcare, education, and retail are key drivers, actively integrating NFC chips to facilitate contactless payments and enhance consumer utility. These cards empower suppliers with tools to generate and track potential leads, reinforcing long-term business relationships.
Security remains a critical differentiator, with widespread implementation of fraud detection algorithms, dynamic CVV generation, and real-time transaction monitoring. The segment also demands robust compliance certifications, secure data encryption, digital identity verification, and streamlined transaction reconciliation processes.
Operational features like spending limit controls, user authentication protocols, and optimized account provisioning contribute to a secure and user-centric experience. With these innovations, it's projected that by 2025, 50% of all B2B transactions will be conducted digitally, cementing the segment’s pivotal role in the evolving virtual payments ecosystem.

Request Free Sample
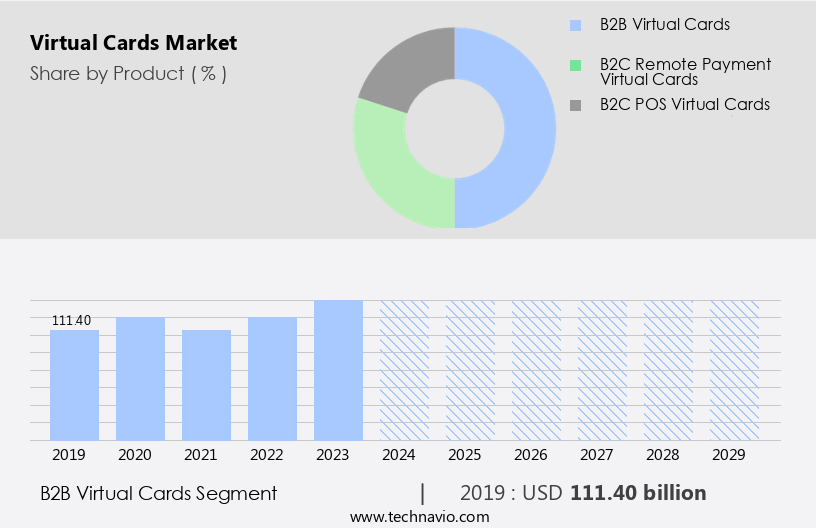
The B2B virtual cards segment was valued at USD 111.40 billion in 2019 and showed a gradual increase during the forecast period.
Regional Analysis
Europe is estimated to contribute 29% to the growth of the global market during the forecast period.Technavio’s analysts have elaborately explained the regional trends and drivers that shape the market during the forecast period.

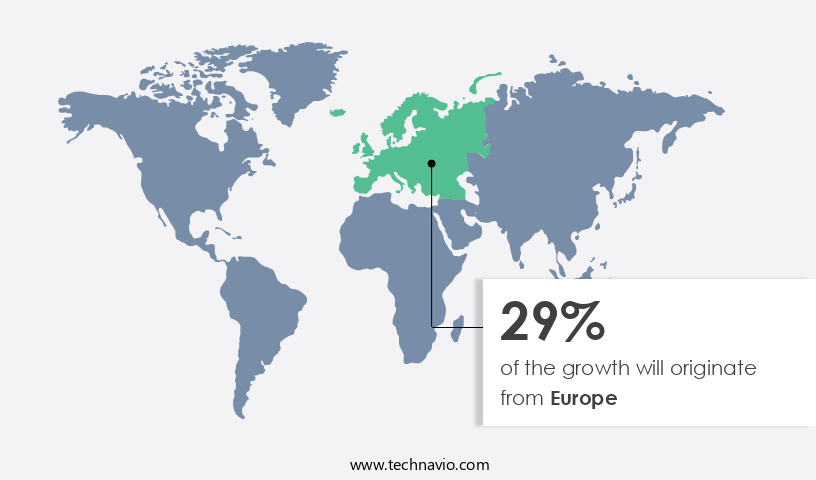
See How virtual cards market Demand is Rising in Europe Request Free Sample
The market in North America is experiencing significant growth, driven by the increasing adoption of digital wallet technology and contactless payments. In 2023, the US and Canada were the market leaders, with major players like Mastercard, American Express, and JPMorgan Chase leading the charge. These companies offer virtual cards, which provide benefits such as improved efficiency and convenience for businesses. For example, American Express Go is a virtual card solution designed for businesses, enabling automated payments and reducing manual processing time. Virtual cards also offer advanced features such as fraud detection algorithms, dynamic CVV generation, multi-currency support, multifactor authentication and real-time transaction monitoring.
Compliance certifications, transaction reconciliation, secure data encryption, and chargeback management systems are other essential components. Virtual card provisioning, customer onboarding workflow, and user authentication protocols ensure a seamless experience for businesses and their employees. Moreover, virtual cards offer spending limit controls, mobile wallet integration, and risk assessment models, providing businesses with enhanced security and financial management capabilities. The market is expected to grow at a steady pace, with industry experts estimating a 15% increase in virtual card transactions by 2026. These trends underscore the market's potential to revolutionize the way businesses manage their payments and finances.
Market Dynamics
Our researchers analyzed the data with 2024 as the base year, along with the key drivers, trends, and challenges. A holistic analysis of drivers will help companies refine their marketing strategies to gain a competitive advantage.
The global virtual card market continues to evolve, driven by innovations in virtual card platform integration process and secure virtual card number generation method. Financial institutions are deploying real-time transaction authorization system design and dynamic CVV generation for enhanced security, bolstered by advanced fraud detection algorithms for virtual card transactions. A seamless customer onboarding workflow for virtual card issuance combined with mobile wallet integration with virtual card functionality supports rapid adoption. Back-end advancements include virtual card usage analytics dashboard development, compliance certifications for virtual card payment systems, and robust user authentication protocols for secure virtual card access. Institutions apply a risk assessment model for virtual card transaction security and adopt data breach prevention strategies for virtual card data.
Key optimizations involve payment network connectivity for virtual card processing, virtual card spending limit control and management system, and recurring billing system integration with virtual cards. Enhancing backend infrastructure, players now prioritize account provisioning process optimization for virtual cards and payment gateway API integration with virtual cards to streamline services. The emphasis on virtual card lifecycle management best practices ensures operational continuity, while transaction reconciliation process for virtual cards and virtual card account closure procedures and compliance support full-spectrum control and regulatory adherence.
What are the key market drivers leading to the rise in the adoption of Virtual Cards Industry?
- The global virtual cards market is undergoing a steady transformation, led by advancements in virtual card payment processing and the integration of tokenization security protocols to protect digital transactions. Enterprises are leveraging a centralized card issuance platform and sophisticated virtual account management tools to enhance operational flow. With features like embossed card design, seamless card activation methods, and responsive customer support portal, businesses are focusing on elevating the user experience.
- A comparison of recent figures reveals that retailers experienced a 25% increase in sales following the implementation of virtual cards, highlighting their commercial impact. Simultaneously, the industry anticipates a growth of over 15% in the coming years, reinforcing its trajectory. Strategies such as refined transaction dispute resolution, integrated chargeback management system, and dynamic card control features are now essential for sustaining competitiveness and addressing evolving customer demands.
What are the market trends shaping the Virtual Cards Industry?
- The emergence of Near Field Communication (NFC) technology is shaping the market trend in payment systems. NFC-based payment technology is set to dominate the market in the near future.
- NFC technology, which facilitates data exchange between devices within a few centimeters, is revolutionizing various industries. One-way communication, where a reader or powered device interacts with an NFC chip, is commonly used in contactless payments and transportation systems. For instance, a 15% increase in contactless transactions was observed after the implementation of NFC technology in a major US city's public transportation system. The market, a significant segment of the NFC industry, is projected to expand significantly. According to recent reports, the market is expected to grow by over 20% in the upcoming years.
- Two-way communication, enabling data transfer between two NFC-enabled devices, is gaining popularity in areas like mobile payments and data sharing. This technology's potential is vast, offering convenience, security, and efficiency.
What challenges does the Virtual Cards Industry face during its growth?
- The growth of the industry is significantly influenced by the regulatory challenges surrounding contactless payment transactions. Specifically, adhering to the regulations imposed on such transactions poses a key hurdle for businesses and financial institutions alike.
- Contactless payment transactions continue to gain popularity worldwide, driven by the need for convenience and the increasing acceptance of digital payments. However, regulations play a significant role in shaping the market dynamics. In the European Union, the Revised Payment Services Directive 2 and the General Data Protection Regulation (GDPR) ensure security and privacy in contactless transactions by mandating strong customer authentication and safeguarding user data. In the US, the Payment Card Industry Data Security Standard (PCI DSS) sets security requirements for organizations handling cardholder information, impacting contactless payment systems implementation. The Dodd-Frank Wall Street Reform and Consumer Protection Act emphasizes consumer protection and fair practices, influencing how contactless payments are offered and regulated.
- According to recent reports, the contactless payment market is expected to grow by over 20% annually, reaching a value of USD3.6 trillion by 2026. For instance, contactless payment usage in the UK has increased by 150% since the onset of the pandemic, highlighting the market's potential.
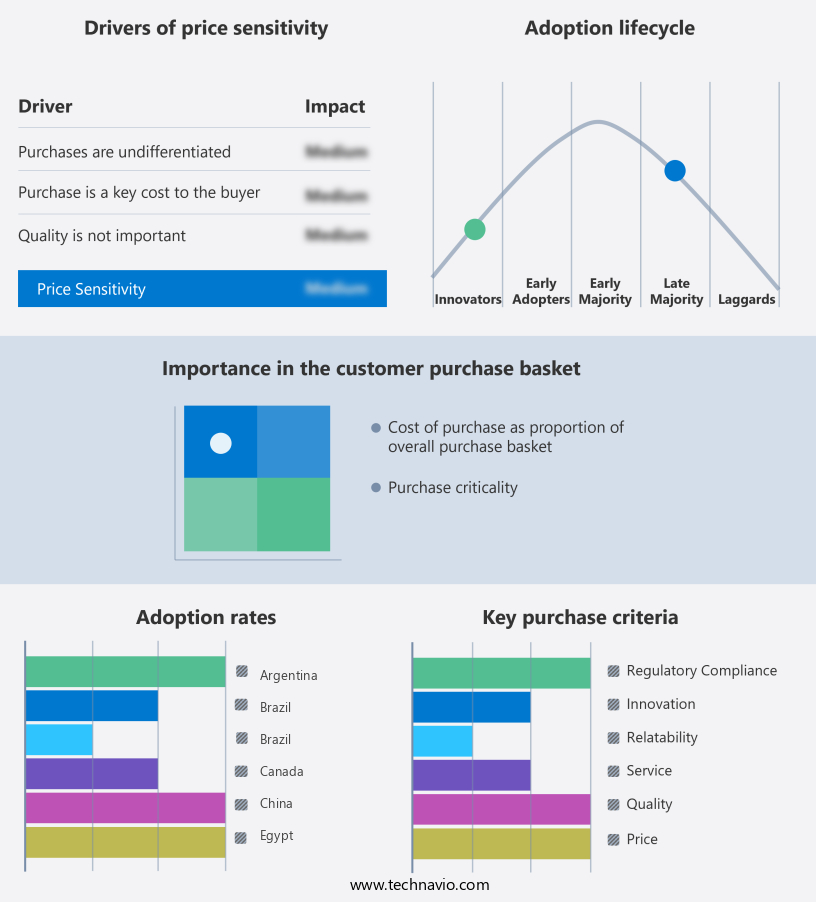
Exclusive Customer Landscape
The virtual cards market forecasting report includes the adoption lifecycle of the market, covering from the innovator’s stage to the laggard’s stage. It focuses on adoption rates in different regions based on penetration. Furthermore, the virtual cards market report also includes key purchase criteria and drivers of price sensitivity to help companies evaluate and develop their market growth analysis strategies.

Customer Landscape
Key Companies & Market Insights
Companies are implementing various strategies, such as strategic alliances, virtual cards market forecast, partnerships, mergers and acquisitions, geographical expansion, and product/service launches, to enhance their presence in the industry.
Adyen NV - The company provides virtual card solutions, including Adyen Master virtual cards. These cards function as single-use or recurring payment instruments, enhancing transaction security and streamlining financial operations for businesses.
The industry research and growth report includes detailed analyses of the competitive landscape of the market and information about key companies, including:
- Adyen NV
- Alipay.com Co Ltd.
- American Express Co.
- BTRS Holdings Inc.
- Caxton FX Ltd.
- Citigroup Inc.
- Edenred SE
- Green Dot Corp.
- HSBC Holdings Plc
- JPMorgan Chase & Co.
- Marqeta Inc.
- Mastercard Inc.
- MineralTree Inc.
- Paysafe Ltd.
- Stripe Inc.
- Travelex International Ltd.
- U.S. Bancorp
- Visa Inc.
- WEX Inc.
- Wise Payments Ltd.
Qualitative and quantitative analysis of companies has been conducted to help clients understand the wider business environment as well as the strengths and weaknesses of key industry players. Data is qualitatively analyzed to categorize companies as pure play, category-focused, industry-focused, and diversified; it is quantitatively analyzed to categorize companies as dominant, leading, strong, tentative, and weak.
Recent Development and News in Virtual Cards Market
- In January 2024, Mastercard announced the launch of its new Mastercard Send for Virtual Cards solution, enabling businesses to make one-time payments to companies and employees using virtual cards (Mastercard press release).
- In March 2024, Visa partnered with Stripe to offer virtual card solutions for e-commerce merchants, expanding Visa's reach in the digital payments sector (Visa press release).
- In April 2025, American Express secured a strategic partnership with PayPal to allow small businesses to issue virtual cards for online payments, strengthening Amex's presence in the digital payments market (American Express press release).
- In May 2025, Discover Financial Services acquired a significant stake in ZestFinance, a leading artificial intelligence lending platform, to enhance Discover's virtual card offerings and improve underwriting capabilities (Discover Financial Services press release).
Research Analyst Overview
- The market continues to evolve, with new applications emerging across various sectors, including e-commerce, travel, and finance. User experience optimization and payment error handling are key areas of focus, with compliance regulations driving the need for virtual account linking and robust customer support channels. Customer service metrics, data backup procedures, and customer data privacy are essential elements of virtual card offerings, while system architecture design and expiration date management ensure seamless transaction processing. One notable example of market activity is a leading financial institution reporting a 25% increase in virtual card usage due to enhanced security features and transaction processing speed.
- Industry growth is expected to reach 15% annually, with ongoing investments in software development kits, fraud prevention measures, user interface design, and transaction record keeping. API documentation, account balance inquiry, security token integration, database management systems, system security audits, payment authorization requests, and payment data encryption are critical components of virtual card systems, all contributing to their increasing popularity and adoption.
Dive into Technavio’s robust research methodology, blending expert interviews, extensive data synthesis, and validated models for unparalleled Virtual Cards Market insights. See full methodology.
Market Scope
|
Report Coverage
|
Details
|
Page number
|
200
|
Base year
|
2024
|
Historic period
|
2019-2023 |
Forecast period
|
2025-2029
|
Growth momentum & CAGR
|
Accelerate at a CAGR of 17.1%
|
Market growth 2025-2029
|
USD 428.6 billion
|
Market structure
|
Fragmented
|
YoY growth 2024-2025(%)
|
14.6
|
Key countries
|
US, China, Germany, Canada, and Japan
|
Competitive landscape
|
Leading Companies, Market Positioning of Companies, Competitive Strategies, and Industry Risks
|
Request Free Sample
What are the Key Data Covered in this Virtual Cards Market Research and Growth Report?
- CAGR of the Virtual Cards industry during the forecast period
- Detailed information on factors that will drive the growth and forecasting between 2025 and 2029
- Precise estimation of the size of the market and its contribution of the industry in focus to the parent market
- Accurate predictions about upcoming growth and trends and changes in consumer behaviour
- Growth of the market across North America, Europe, APAC, South America, and Middle East and Africa
- Thorough analysis of the market’s competitive landscape and detailed information about companies
- Comprehensive analysis of factors that will challenge the virtual cards market growth of industry companies
We can help! Our analysts can customize this virtual cards market research report to meet your requirements.
Get in touch
1 Executive Summary
- 1.1 Market overview
- Executive Summary - Chart on Market Overview
- Executive Summary - Data Table on Market Overview
- Executive Summary - Chart on Global Market Characteristics
- Executive Summary - Chart on Market by Geography
- Executive Summary - Chart on Market Segmentation by Product
- Executive Summary - Chart on Market Segmentation by Service
- Executive Summary - Chart on Incremental Growth
- Executive Summary - Data Table on Incremental Growth
- Executive Summary - Chart on Company Market Positioning
2 Technavio Analysis
- 2.1 Analysis of price sensitivity, lifecycle, customer purchase basket, adoption rates, and purchase criteria
- Analysis of price sensitivity, lifecycle, customer purchase basket, adoption rates, and purchase criteria
- 2.2 Criticality of inputs and Factors of differentiation
- Overview on criticality of inputs and factors of differentiation
- 2.3 Factors of disruption
- Overview on factors of disruption
- 2.4 Impact of drivers and challenges
- Impact of drivers and challenges in 2024 and 2029
3 Market Landscape
- 3.1 Market ecosystem
- Parent Market
- Data Table on - Parent Market
- 3.2 Market characteristics
- Market characteristics analysis
4 Market Sizing
- 4.1 Market definition
- Offerings of companies included in the market definition
- 4.2 Market segment analysis
- 4.4 Market outlook: Forecast for 2024-2029
- Chart on Global - Market size and forecast 2024-2029 ($ billion)
- Data Table on Global - Market size and forecast 2024-2029 ($ billion)
- Chart on Global Market: Year-over-year growth 2024-2029 (%)
- Data Table on Global Market: Year-over-year growth 2024-2029 (%)
5 Historic Market Size
- 5.1 Global Virtual Cards Market 2019 - 2023
- Historic Market Size - Data Table on Global Virtual Cards Market 2019 - 2023 ($ billion)
- 5.2 Product segment analysis 2019 - 2023
- Historic Market Size - Product Segment 2019 - 2023 ($ billion)
- 5.3 Service segment analysis 2019 - 2023
- Historic Market Size - Service Segment 2019 - 2023 ($ billion)
- 5.4 Geography segment analysis 2019 - 2023
- Historic Market Size - Geography Segment 2019 - 2023 ($ billion)
- 5.5 Country segment analysis 2019 - 2023
- Historic Market Size - Country Segment 2019 - 2023 ($ billion)
6 Qualitative Analysis
- 6.1 Impact of AI on the Global Virtual Cards Market
7 Five Forces Analysis
- 7.1 Five forces summary
- Five forces analysis - Comparison between 2024 and 2029
- 7.2 Bargaining power of buyers
- Bargaining power of buyers - Impact of key factors 2024 and 2029
- 7.3 Bargaining power of suppliers
- Bargaining power of suppliers - Impact of key factors in 2024 and 2029
- 7.4 Threat of new entrants
- Threat of new entrants - Impact of key factors in 2024 and 2029
- 7.5 Threat of substitutes
- Threat of substitutes - Impact of key factors in 2024 and 2029
- 7.6 Threat of rivalry
- Threat of rivalry - Impact of key factors in 2024 and 2029
- 7.7 Market condition
- Chart on Market condition - Five forces 2024 and 2029
8 Market Segmentation by Product
- 8.1 Market segments
- Chart on Product - Market share (2024-2029) (%)
- Data Table on Product - Market share (2024-2029) (%)
- 8.2 Comparison by Product
- Chart on Comparison by Product
- Data Table on Comparison by Product
- 8.3 B2B virtual cards - Market size and forecast (2024-2029)
- Chart on B2B virtual cards - Market size and forecast (2024-2029) ($ billion)
- Data Table on B2B virtual cards - Market size and forecast (2024-2029) ($ billion)
- Chart on B2B virtual cards - Year-over-year growth (2024-2029) (%)
- Data Table on B2B virtual cards - Year-over-year growth (2024-2029) (%)
- 8.4 B2C remote payment virtual cards - Market size and forecast (2024-2029)
- Chart on B2C remote payment virtual cards - Market size and forecast (2024-2029) ($ billion)
- Data Table on B2C remote payment virtual cards - Market size and forecast (2024-2029) ($ billion)
- Chart on B2C remote payment virtual cards - Year-over-year growth (2024-2029) (%)
- Data Table on B2C remote payment virtual cards - Year-over-year growth (2024-2029) (%)
- 8.5 B2C POS virtual cards - Market size and forecast (2024-2029)
- Chart on B2C POS virtual cards - Market size and forecast (2024-2029) ($ billion)
- Data Table on B2C POS virtual cards - Market size and forecast (2024-2029) ($ billion)
- Chart on B2C POS virtual cards - Year-over-year growth (2024-2029) (%)
- Data Table on B2C POS virtual cards - Year-over-year growth (2024-2029) (%)
- 8.6 Market opportunity by Product
- Market opportunity by Product ($ billion)
- Data Table on Market opportunity by Product ($ billion)
9 Market Segmentation by Service
- 9.1 Market segments
- Chart on Service - Market share (2024-2029) (%)
- Data Table on Service - Market share (2024-2029) (%)
- 9.2 Comparison by Service
- Chart on Comparison by Service
- Data Table on Comparison by Service
- 9.3 Business use - Market size and forecast (2024-2029)
- Chart on Business use - Market size and forecast (2024-2029) ($ billion)
- Data Table on Business use - Market size and forecast (2024-2029) ($ billion)
- Chart on Business use - Year-over-year growth (2024-2029) (%)
- Data Table on Business use - Year-over-year growth (2024-2029) (%)
- 9.4 Consumer use - Market size and forecast (2024-2029)
- Chart on Consumer use - Market size and forecast (2024-2029) ($ billion)
- Data Table on Consumer use - Market size and forecast (2024-2029) ($ billion)
- Chart on Consumer use - Year-over-year growth (2024-2029) (%)
- Data Table on Consumer use - Year-over-year growth (2024-2029) (%)
- 9.5 Market opportunity by Service
- Market opportunity by Service ($ billion)
- Data Table on Market opportunity by Service ($ billion)
10 Market Segmentation by Card Type
- 10.1 Market segments
- Chart on Card Type - Market share (2024-2029) (%)
- Data Table on Card Type - Market share (2024-2029) (%)
- 10.2 Comparison by Card Type
- Chart on Comparison by Card Type
- Data Table on Comparison by Card Type
- 10.3 Credit Card - Market size and forecast (2024-2029)
- Chart on Credit Card - Market size and forecast (2024-2029) ($ billion)
- Data Table on Credit Card - Market size and forecast (2024-2029) ($ billion)
- Chart on Credit Card - Year-over-year growth (2024-2029) (%)
- Data Table on Credit Card - Year-over-year growth (2024-2029) (%)
- 10.4 Debit Card - Market size and forecast (2024-2029)
- Chart on Debit Card - Market size and forecast (2024-2029) ($ billion)
- Data Table on Debit Card - Market size and forecast (2024-2029) ($ billion)
- Chart on Debit Card - Year-over-year growth (2024-2029) (%)
- Data Table on Debit Card - Year-over-year growth (2024-2029) (%)
- 10.5 Prepaid Card - Market size and forecast (2024-2029)
- Chart on Prepaid Card - Market size and forecast (2024-2029) ($ billion)
- Data Table on Prepaid Card - Market size and forecast (2024-2029) ($ billion)
- Chart on Prepaid Card - Year-over-year growth (2024-2029) (%)
- Data Table on Prepaid Card - Year-over-year growth (2024-2029) (%)
- 10.6 Market opportunity by Card Type
- Market opportunity by Card Type ($ billion)
- Data Table on Market opportunity by Card Type ($ billion)
11 Market Segmentation by End-Use Industry
- 11.1 Market segments
- Chart on End-Use Industry - Market share (2024-2029) (%)
- Data Table on End-Use Industry - Market share (2024-2029) (%)
- 11.2 Comparison by End-Use Industry
- Chart on Comparison by End-Use Industry
- Data Table on Comparison by End-Use Industry
- 11.3 Banking, Financial Services, and Insurance (BFSI) - Market size and forecast (2024-2029)
- Chart on Banking, Financial Services, and Insurance (BFSI) - Market size and forecast (2024-2029) ($ billion)
- Data Table on Banking, Financial Services, and Insurance (BFSI) - Market size and forecast (2024-2029) ($ billion)
- Chart on Banking, Financial Services, and Insurance (BFSI) - Year-over-year growth (2024-2029) (%)
- Data Table on Banking, Financial Services, and Insurance (BFSI) - Year-over-year growth (2024-2029) (%)
- 11.4 E-commerce - Market size and forecast (2024-2029)
- Chart on E-commerce - Market size and forecast (2024-2029) ($ billion)
- Data Table on E-commerce - Market size and forecast (2024-2029) ($ billion)
- Chart on E-commerce - Year-over-year growth (2024-2029) (%)
- Data Table on E-commerce - Year-over-year growth (2024-2029) (%)
- 11.5 Hospitality - Market size and forecast (2024-2029)
- Chart on Hospitality - Market size and forecast (2024-2029) ($ billion)
- Data Table on Hospitality - Market size and forecast (2024-2029) ($ billion)
- Chart on Hospitality - Year-over-year growth (2024-2029) (%)
- Data Table on Hospitality - Year-over-year growth (2024-2029) (%)
- 11.6 Market opportunity by End-Use Industry
- Market opportunity by End-Use Industry ($ billion)
- Data Table on Market opportunity by End-Use Industry ($ billion)
12 Customer Landscape
- 12.1 Customer landscape overview
- Analysis of price sensitivity, lifecycle, customer purchase basket, adoption rates, and purchase criteria
13 Geographic Landscape
- 13.1 Geographic segmentation
- Chart on Market share by geography 2024-2029 (%)
- Data Table on Market share by geography 2024-2029 (%)
- 13.2 Geographic comparison
- Chart on Geographic comparison
- Data Table on Geographic comparison
- 13.3 North America - Market size and forecast 2024-2029
- Chart on North America - Market size and forecast 2024-2029 ($ billion)
- Data Table on North America - Market size and forecast 2024-2029 ($ billion)
- Chart on North America - Year-over-year growth 2024-2029 (%)
- Data Table on North America - Year-over-year growth 2024-2029 (%)
- 13.4 Europe - Market size and forecast 2024-2029
- Chart on Europe - Market size and forecast 2024-2029 ($ billion)
- Data Table on Europe - Market size and forecast 2024-2029 ($ billion)
- Chart on Europe - Year-over-year growth 2024-2029 (%)
- Data Table on Europe - Year-over-year growth 2024-2029 (%)
- 13.5 APAC - Market size and forecast 2024-2029
- Chart on APAC - Market size and forecast 2024-2029 ($ billion)
- Data Table on APAC - Market size and forecast 2024-2029 ($ billion)
- Chart on APAC - Year-over-year growth 2024-2029 (%)
- Data Table on APAC - Year-over-year growth 2024-2029 (%)
- 13.6 South America - Market size and forecast 2024-2029
- Chart on South America - Market size and forecast 2024-2029 ($ billion)
- Data Table on South America - Market size and forecast 2024-2029 ($ billion)
- Chart on South America - Year-over-year growth 2024-2029 (%)
- Data Table on South America - Year-over-year growth 2024-2029 (%)
- 13.7 Middle East and Africa - Market size and forecast 2024-2029
- Chart on Middle East and Africa - Market size and forecast 2024-2029 ($ billion)
- Data Table on Middle East and Africa - Market size and forecast 2024-2029 ($ billion)
- Chart on Middle East and Africa - Year-over-year growth 2024-2029 (%)
- Data Table on Middle East and Africa - Year-over-year growth 2024-2029 (%)
- 13.8 US - Market size and forecast 2024-2029
- Chart on US - Market size and forecast 2024-2029 ($ billion)
- Data Table on US - Market size and forecast 2024-2029 ($ billion)
- Chart on US - Year-over-year growth 2024-2029 (%)
- Data Table on US - Year-over-year growth 2024-2029 (%)
- 13.9 China - Market size and forecast 2024-2029
- Chart on China - Market size and forecast 2024-2029 ($ billion)
- Data Table on China - Market size and forecast 2024-2029 ($ billion)
- Chart on China - Year-over-year growth 2024-2029 (%)
- Data Table on China - Year-over-year growth 2024-2029 (%)
- 13.10 Germany - Market size and forecast 2024-2029
- Chart on Germany - Market size and forecast 2024-2029 ($ billion)
- Data Table on Germany - Market size and forecast 2024-2029 ($ billion)
- Chart on Germany - Year-over-year growth 2024-2029 (%)
- Data Table on Germany - Year-over-year growth 2024-2029 (%)
- 13.11 Canada - Market size and forecast 2024-2029
- Chart on Canada - Market size and forecast 2024-2029 ($ billion)
- Data Table on Canada - Market size and forecast 2024-2029 ($ billion)
- Chart on Canada - Year-over-year growth 2024-2029 (%)
- Data Table on Canada - Year-over-year growth 2024-2029 (%)
- 13.12 Japan - Market size and forecast 2024-2029
- Chart on Japan - Market size and forecast 2024-2029 ($ billion)
- Data Table on Japan - Market size and forecast 2024-2029 ($ billion)
- Chart on Japan - Year-over-year growth 2024-2029 (%)
- Data Table on Japan - Year-over-year growth 2024-2029 (%)
- 13.13 India - Market size and forecast 2024-2029
- Chart on India - Market size and forecast 2024-2029 ($ billion)
- Data Table on India - Market size and forecast 2024-2029 ($ billion)
- Chart on India - Year-over-year growth 2024-2029 (%)
- Data Table on India - Year-over-year growth 2024-2029 (%)
- 13.14 South Korea - Market size and forecast 2024-2029
- Chart on South Korea - Market size and forecast 2024-2029 ($ billion)
- Data Table on South Korea - Market size and forecast 2024-2029 ($ billion)
- Chart on South Korea - Year-over-year growth 2024-2029 (%)
- Data Table on South Korea - Year-over-year growth 2024-2029 (%)
- 13.15 UK - Market size and forecast 2024-2029
- Chart on UK - Market size and forecast 2024-2029 ($ billion)
- Data Table on UK - Market size and forecast 2024-2029 ($ billion)
- Chart on UK - Year-over-year growth 2024-2029 (%)
- Data Table on UK - Year-over-year growth 2024-2029 (%)
- 13.16 France - Market size and forecast 2024-2029
- Chart on France - Market size and forecast 2024-2029 ($ billion)
- Data Table on France - Market size and forecast 2024-2029 ($ billion)
- Chart on France - Year-over-year growth 2024-2029 (%)
- Data Table on France - Year-over-year growth 2024-2029 (%)
- 13.17 Brazil - Market size and forecast 2024-2029
- Chart on Brazil - Market size and forecast 2024-2029 ($ billion)
- Data Table on Brazil - Market size and forecast 2024-2029 ($ billion)
- Chart on Brazil - Year-over-year growth 2024-2029 (%)
- Data Table on Brazil - Year-over-year growth 2024-2029 (%)
- 13.18 Market opportunity by geography
- Market opportunity by geography ($ billion)
- Data Tables on Market opportunity by geography ($ billion)
- 13.19 Rest of World (ROW) - Market size and forecast (2024-2029)
- Chart on Rest of World (ROW) - Market size and forecast (2024-2029) ($ billion)
- Data Table on Rest of World (ROW) - Market size and forecast (2024-2029) ($ billion)
- Chart on Rest of World (ROW) - Year-over-year growth (2024-2029) (%)
- Data Table on Rest of World (ROW) - Year-over-year growth (2024-2029) (%)
14 Drivers, Challenges, and Opportunity/Restraints
- 14.3 Impact of drivers and challenges
- Impact of drivers and challenges in 2024 and 2029
- 14.4 Market opportunities/restraints
15 Competitive Landscape
- 15.2 Competitive Landscape
- Overview on criticality of inputs and factors of differentiation
- 15.3 Landscape disruption
- Overview on factors of disruption
- 15.4 Industry risks
- Impact of key risks on business
16 Competitive Analysis
- 16.2 Market positioning of companies
- Matrix on companies position and classification
- 16.3 Adyen NV
- Adyen NV - Overview
- Adyen NV - Product / Service
- Adyen NV - Key offerings
- 16.4 Alipay.com Co Ltd.
- Alipay.com Co Ltd. - Overview
- Alipay.com Co Ltd. - Product / Service
- Alipay.com Co Ltd. - Key offerings
- 16.5 American Express Co.
- American Express Co. - Overview
- American Express Co. - Product / Service
- American Express Co. - Key offerings
- 16.6 BTRS Holdings Inc.
- BTRS Holdings Inc. - Overview
- BTRS Holdings Inc. - Product / Service
- BTRS Holdings Inc. - Key offerings
- 16.7 Caxton FX Ltd.
- Caxton FX Ltd. - Overview
- Caxton FX Ltd. - Product / Service
- Caxton FX Ltd. - Key offerings
- 16.8 Citigroup Inc.
- Citigroup Inc. - Overview
- Citigroup Inc. - Product / Service
- Citigroup Inc. - Key offerings
- 16.9 Edenred SE
- Edenred SE - Overview
- Edenred SE - Product / Service
- Edenred SE - Key offerings
- 16.10 Green Dot Corp.
- Green Dot Corp. - Overview
- Green Dot Corp. - Product / Service
- Green Dot Corp. - Key offerings
- 16.11 HSBC Holdings Plc
- HSBC Holdings Plc - Overview
- HSBC Holdings Plc - Product / Service
- HSBC Holdings Plc - Key offerings
- 16.12 JPMorgan Chase & Co.
- JPMorgan Chase & Co. - Overview
- JPMorgan Chase & Co. - Product / Service
- JPMorgan Chase & Co. - Key offerings
- 16.13 Marqeta Inc.
- Marqeta Inc. - Overview
- Marqeta Inc. - Product / Service
- Marqeta Inc. - Key offerings
- 16.14 Mastercard Inc.
- Mastercard Inc. - Overview
- Mastercard Inc. - Product / Service
- Mastercard Inc. - Key offerings
- 16.15 MineralTree Inc.
- MineralTree Inc. - Overview
- MineralTree Inc. - Product / Service
- MineralTree Inc. - Key offerings
- 16.16 Paysafe Ltd.
- Paysafe Ltd. - Overview
- Paysafe Ltd. - Product / Service
- Paysafe Ltd. - Key offerings
- 16.17 Stripe Inc.
- Stripe Inc. - Overview
- Stripe Inc. - Product / Service
- Stripe Inc. - Key offerings
- 16.18 Travelex International Ltd.
- Travelex International Ltd. - Overview
- Travelex International Ltd. - Product / Service
- Travelex International Ltd. - Key offerings
- 16.19 U.S. Bancorp
- U.S. Bancorp - Overview
- U.S. Bancorp - Product / Service
- U.S. Bancorp - Key offerings
- 16.20 Visa Inc.
- Visa Inc. - Overview
- Visa Inc. - Product / Service
- Visa Inc. - Key offerings
- 16.21 WEX Inc.
- WEX Inc. - Overview
- WEX Inc. - Product / Service
- WEX Inc. - Key offerings
- 16.22 Wise Payments Ltd.
- Wise Payments Ltd. - Overview
- Wise Payments Ltd. - Product / Service
- Wise Payments Ltd. - Key offerings
- 16.23 Adyen NV
- Adyen NV - Overview
- Adyen NV - Product / Service
- Adyen NV - Key offerings
- 16.24 American Express Co.
- American Express Co. - Overview
- American Express Co. - Product / Service
- American Express Co. - Key offerings
- 16.25 BTRS Holdings Inc.
- BTRS Holdings Inc. - Overview
- BTRS Holdings Inc. - Product / Service
- BTRS Holdings Inc. - Key offerings
- 16.26 Caxton FX Ltd.
- Caxton FX Ltd. - Overview
- Caxton FX Ltd. - Product / Service
- Caxton FX Ltd. - Key offerings
- 16.27 Citigroup Inc.
- Citigroup Inc. - Overview
- Citigroup Inc. - Product / Service
- Citigroup Inc. - Key offerings
- 16.28 Edenred SE
- Edenred SE - Overview
- Edenred SE - Product / Service
- Edenred SE - Key offerings
- 16.29 Green Dot Corp.
- Green Dot Corp. - Overview
- Green Dot Corp. - Product / Service
- Green Dot Corp. - Key offerings
- 16.30 HSBC Holdings Plc
- HSBC Holdings Plc - Overview
- HSBC Holdings Plc - Product / Service
- HSBC Holdings Plc - Key offerings
- 16.31 JPMorgan Chase and Co.
- JPMorgan Chase and Co. - Overview
- JPMorgan Chase and Co. - Product / Service
- JPMorgan Chase and Co. - Key offerings
- 16.32 Marqeta Inc.
- Marqeta Inc. - Overview
- Marqeta Inc. - Product / Service
- Marqeta Inc. - Key offerings
- 16.33 Mastercard Inc.
- Mastercard Inc. - Overview
- Mastercard Inc. - Product / Service
- Mastercard Inc. - Key offerings
- 16.34 Paysafe Ltd.
- Paysafe Ltd. - Overview
- Paysafe Ltd. - Product / Service
- Paysafe Ltd. - Key offerings
- 16.35 Stripe Inc.
- Stripe Inc. - Overview
- Stripe Inc. - Product / Service
- Stripe Inc. - Key offerings
- 16.36 Travelex International Ltd.
- Travelex International Ltd. - Overview
- Travelex International Ltd. - Product / Service
- Travelex International Ltd. - Key offerings
- 16.37 U.S. Bancorp
- U.S. Bancorp - Overview
- U.S. Bancorp - Product / Service
- U.S. Bancorp - Key offerings
- 16.38 Visa Inc.
- Visa Inc. - Overview
- Visa Inc. - Product / Service
- Visa Inc. - Key offerings
- 16.39 Walmart Inc.
- Walmart Inc. - Overview
- Walmart Inc. - Product / Service
- Walmart Inc. - Key offerings
- 16.40 Western Union Holdings Inc.
- Western Union Holdings Inc. - Overview
- Western Union Holdings Inc. - Product / Service
- Western Union Holdings Inc. - Key offerings
- 16.41 WEX Inc.
- WEX Inc. - Overview
- WEX Inc. - Product / Service
- WEX Inc. - Key offerings
- 16.42 Wise Payments Ltd.
- Wise Payments Ltd. - Overview
- Wise Payments Ltd. - Product / Service
- Wise Payments Ltd. - Key offerings
17 Appendix
- 17.2 Inclusions and exclusions checklist
- Inclusions checklist
- Exclusions checklist
- 17.3 Currency conversion rates for US$
- Currency conversion rates for US$
- 17.4 Research methodology
- 17.7 Validation techniques employed for market sizing
- Validation techniques employed for market sizing
- 17.9 360 degree market analysis
- 360 degree market analysis
- 17.10 List of abbreviations