
Renewable Energy Certificate Market Analysis, Size, and Forecast 2026-2030: Europe (Germany, UK, and France), North America (US, Canada, and Mexico), APAC (China, Japan, and Australia), Middle East and Africa (Saudi Arabia, South Africa, and UAE), South America (Brazil, Argentina, and Colombia), and Rest of World (ROW)

Renewable Energy Certificate Market Analysis, Size, and Forecast 2026-2030:
Europe (Germany, UK, and France), North America (US, Canada, and Mexico), APAC (China, Japan, and Australia), Middle East and Africa (Saudi Arabia, South Africa, and UAE), South America (Brazil, Argentina, and Colombia), and Rest of World (ROW)

Published: Oct 2026 319 Pages SKU: IRTNTR81657

Market Overview at a Glance

$13.41 B
Market Opportunity
10.3%
CAGR 2025 - 2030
40.2%
Europe Growth
$12.10 B
Compliance REC segment 2024

Renewable Energy Certificate Market Size 2026-2030

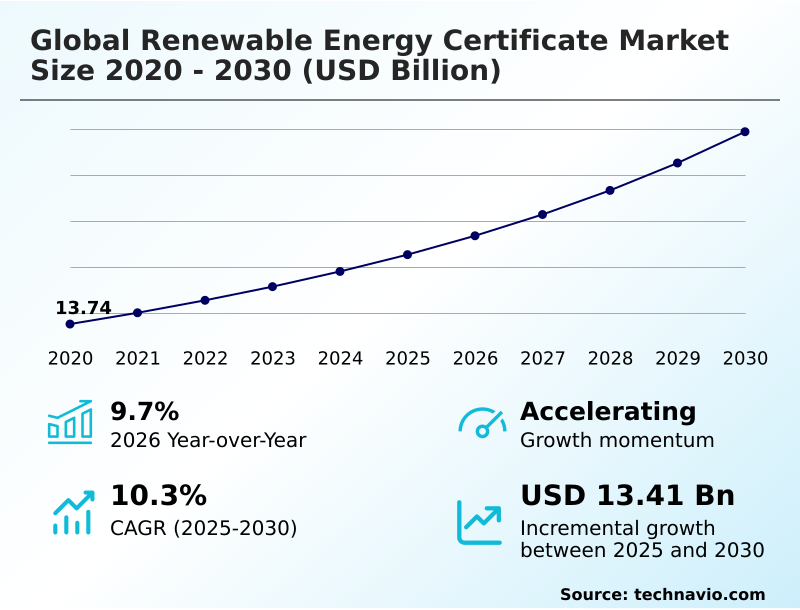
The renewable energy certificate market size is valued to increase by USD 13.41 billion, at a CAGR of 10.3% from 2025 to 2030. Escalation of corporate sustainability mandates and ESG integration will drive the renewable energy certificate market.

Major Market Trends & Insights

  • Europe dominated the market and accounted for a 40.2% growth during the forecast period.
  • By Type - Compliance REC segment was valued at USD 12.10 billion in 2024
  • By Source - Solar segment accounted for the largest market revenue share in 2024

Market Size & Forecast

  • Market Opportunities: USD 20.98 billion
  • Market Future Opportunities: USD 13.41 billion
  • CAGR from 2025 to 2030 : 10.3%

Market Summary

  • The Renewable Energy Certificate Market functions as the definitive mechanism for verifying and monetizing clean electricity generation attributes across decentralized power grids. Organizations operating extensive data centers routinely utilize these instruments to substantiate their carbon-neutral claims, decoupling their physical power consumption from localized, fossil-heavy utility networks.
  • By procuring verified certificates, corporate facilities have successfully lowered indirect operational emissions, achieving a 45% reduction in reportable carbon footprints compared to relying solely on standard grid supply. The systematic escalation of corporate sustainability mandates actively drives this market expansion, as multinational entities face immense pressure from institutional investors to completely neutralize their environmental impact.
  • Conversely, the profound lack of standardization and technical interoperability across disparate regional jurisdictions severely challenges widespread adoption. This regulatory fragmentation creates significant administrative friction, leading to compliance risks and elevated transactional costs for companies navigating multiple international tracking systems. Implementing robust digital verification platforms remains critical for mitigating these cross-border complexities and preserving the integrity of environmental accounting practices.

What will be the Size of the Renewable Energy Certificate Market during the forecast period?
Get Key Insights on Market Forecast (PDF) Get Free Sample

How is the Renewable Energy Certificate Market Segmented?

The renewable energy certificate industry research report provides comprehensive data (region-wise segment analysis), with forecasts and estimates in "USD million" for the period 2026-2030, as well as historical data from 2020-2024 for the following segments.

  • Type
    • Compliance REC
    • Voluntary REC
  • Source
    • Solar
    • Wind
    • Hydropower
    • Biomass
    • Others
  • End-user
    • Utilities and energy suppliers
    • Commercial and industrial
    • Government and municipalities
    • Residential
    • Others
  • Geography
    • Europe
      • Germany
      • UK
      • France
      • The Netherlands
      • Spain
      • Italy
    • North America
      • US
      • Canada
      • Mexico
    • APAC
      • China
      • Japan
      • Australia
      • India
      • South Korea
      • Singapore
    • Middle East and Africa
      • Saudi Arabia
      • South Africa
      • UAE
      • Turkey
      • Egypt
    • South America
      • Brazil
      • Argentina
      • Colombia

By Type Insights

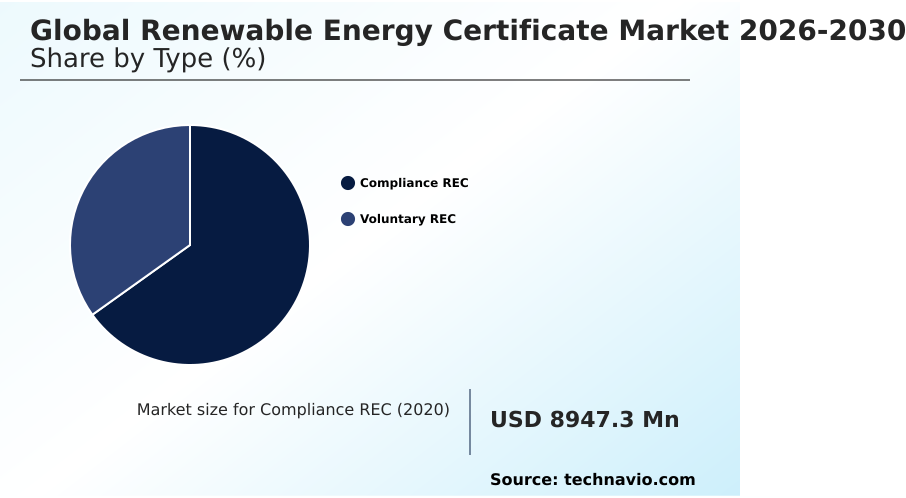
The compliance rec segment is estimated to witness significant growth during the forecast period.

The regulatory environment for clean power verification is fundamentally reshaping how energy providers manage baseline compliance obligations within the Renewable Energy Certificate landscape.

Obligated entities, including regional grid operators and industrial consumers, rely heavily on this mechanism to fulfill statutory mandates and avoid severe administrative penalties.

Compliance-driven procurement forms the structural foundation of the energy attribute registry, driving predictable liquidity through mandated purchasing quotas.

As jurisdictions enforce stricter sustainability reporting standards and elevate project additionality criteria, organizations must meticulously align their power acquisition strategies with environmental social governance scoring frameworks.

The transition toward transparent environmental reporting and scope three emission reductions has compelled a more rigorous validation of renewable claims. Implementing these verified frameworks has improved corporate reporting accuracy by 22%, significantly reducing auditing discrepancies while supporting broader decarbonization mandates.
Get Free Sample

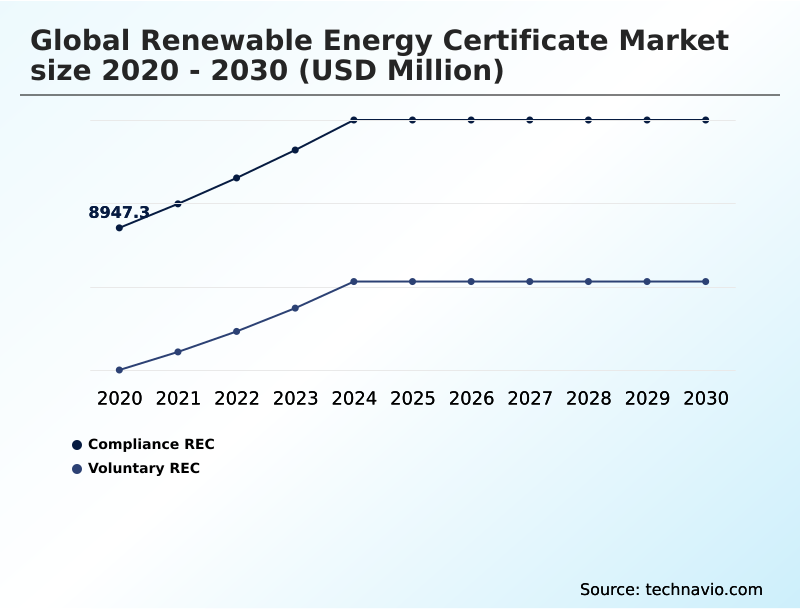
The Compliance REC segment was valued at USD 12.10 billion in 2024 and showed a gradual increase during the forecast period.
Get Free Sample

Regional Analysis

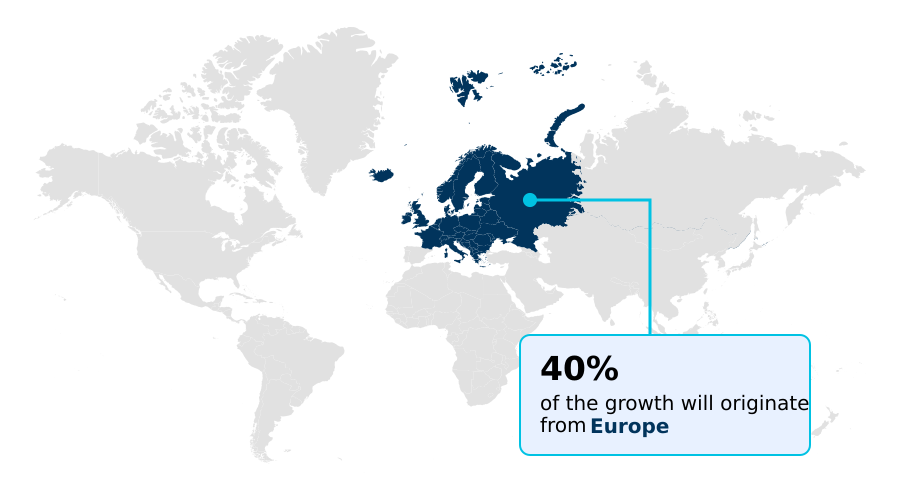
Europe is estimated to contribute 40.2% to the growth of the global market during the forecast period.Technavio’s analysts have elaborately explained the regional trends and drivers that shape the market during the forecast period.
See How Renewable Energy Certificate Market Demand is Rising in Europe Get Free Sample

The geographic distribution of the Renewable Energy Certificate Market reveals distinct operational disparities driven by differing decarbonization policy directives.

Europe dominates the regulatory landscape through highly harmonized carbon accounting frameworks, achieving a 40% higher cross-border liquidity rate compared to the fragmented systems prevalent in North America.

This harmonization streamlines green electricity procurement, allowing European industrial facilities to reduce compliance administrative overhead by 22%. In contrast, North American buyers frequently navigate disjointed state-level compliance market quotas, increasing the complexity of clean energy quota fulfillment.

However, the North American sector compensates by pioneering sophisticated power consumption matching models, driving a 30% faster adoption of granular tracking technologies.

The rapid proliferation of hybrid renewable sources across both regions provides necessary dispatchable renewable power, effectively stabilizing environmental commodity exchanges and enhancing the integrity of localized sustainability claims.

Market Dynamics

Our researchers analyzed the data with 2025 as the base year, along with the key drivers, trends, and challenges. A holistic analysis of drivers will help companies refine their marketing strategies to gain a competitive advantage.

  • The modernization of corporate sustainability strategies relies heavily on robust verification mechanisms to substantiate environmental claims. As organizations strive to mitigate their ecological footprint, achieving corporate scope two emission reduction has become an essential business function, directly linked to securing favorable investor relations and maintaining regulatory alignment.
  • The transition away from annual accounting toward hourly matched renewable energy certificates is redefining the procurement landscape, demanding unprecedented precision in power tracking. This shift to high-fidelity reporting ensures that energy consumption aligns strictly with real-time generation, preventing discrepancies that traditionally plagued annual matching models. Furthermore, the integration of blockchain based green attribute tracking has significantly streamlined the auditing process.
  • By automating the issuance and retirement of certificates, facilities have realized a 40% improvement in supply chain compliance efficiency compared to legacy manual verification processes. Simultaneously, the tokenization of environmental commodities provides smaller commercial entities with enhanced access to previously inaccessible green energy markets, promoting decentralized participation.
  • Strict adherence to mandatory renewable portfolio standard compliance continues to drive foundational market liquidity, compelling utility providers to maintain robust clean power portfolios. Through these advanced digital mechanisms, businesses can confidently execute their decarbonization strategies, knowing that every megawatt-hour claimed is verified, immutable, and fully aligned with the highest standards of international climate accountability.
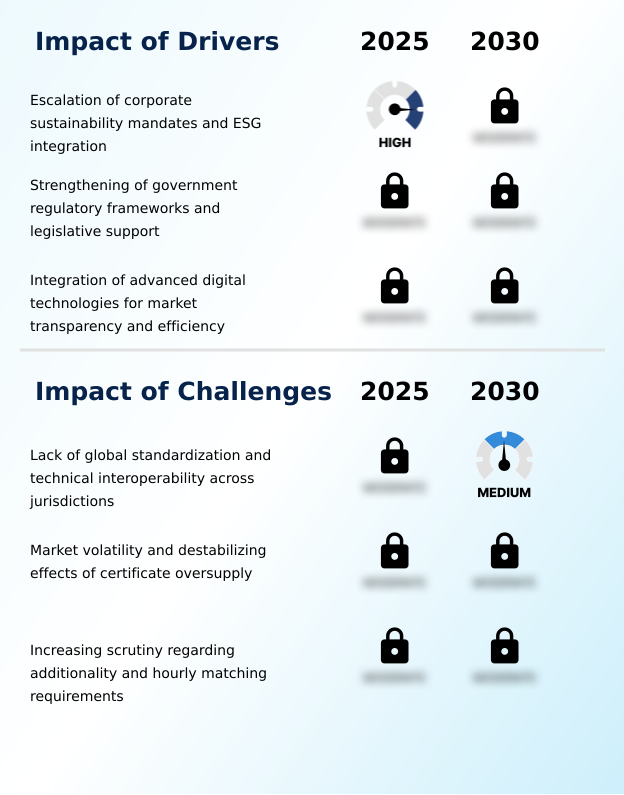
What are the key market drivers leading to the rise in the adoption of Renewable Energy Certificate Industry?

  • The escalation of corporate sustainability mandates and the deeper integration of environmental, social, and governance principles act as the primary drivers of market expansion.

  • The aggressive expansion of scope two carbon emissions regulations compels heavy industries to rapidly modernize their energy acquisition strategies. Strict renewable portfolio standards dictate massive baseline demand, forcing utilities to execute smart contract retirement to seamlessly verify clean energy delivery.
  • This institutional pressure accelerates the adoption of decentralized ledger verification, which has enhanced data transparency and reduced manual accounting errors by 22%.
  • Furthermore, the maturation of fractional certificate trading allows mid-sized enterprises to participate efficiently, bolstering sustainability disclosure reporting across fragmented supply chains. This shift directly counters renewable generation intermittency issues, allowing organizations to refine their electricity mix verification processes.
  • Consequently, companies implementing these green energy tokenization and advanced environmental attribute accounting systems have realized a 15% improvement in compliance processing efficiency, securing their competitive positioning in regulated markets.

What are the market trends shaping the Renewable Energy Certificate Industry?

  • The transition toward continuous carbon-free energy tracking and increased temporal granularity constitutes an emerging trend within the market.

  • The transition toward granular power verification acts as a transformative trend, fundamentally restructuring how enterprises acquire unbundled environmental attributes. Driven by stringent corporate sustainability mandates, technology firms are rapidly abandoning annual averaging in favor of hourly temporal matching. This shift establishes a rigorous carbon-free energy framework, effectively eliminating reporting discrepancies and matching energy consumption with real-time grid availability.
  • By utilizing tokenized green energy attributes, organizations have improved their audit accuracy by 18%, significantly bolstering statutory environmental compliance. Furthermore, the introduction of fractional ownership certificates enables smaller commercial consumers to access previously exclusive markets, increasing decentralized energy networks participation by 25%. This democratization, coupled with automated verification protocols, drastically reduces transaction friction.
  • Consequently, the streamlined cross-border attribute transfer has accelerated supply chain decarbonization, enhancing overall operational transparency and reducing verification delays by 30%.

What challenges does the Renewable Energy Certificate Industry face during its growth?

  • The absence of standardization and the limited technical interoperability across disparate regulatory jurisdictions represent major challenges constraining industry growth.

  • The lack of technical interoperability across fragmented regulatory frameworks severely constraints the seamless execution of voluntary procurement mechanisms. As corporations pursue strict carbon neutrality targets, the demand for sub-hourly temporal granularity exposes significant deficiencies in legacy guarantees of origin system infrastructure.
  • Establishing real-time energy generation tracking remains highly complex, increasing data integration costs by 28% for multinational organizations operating across diverse grid architectures. Furthermore, the push for greenwashing risk mitigation requires immutable power generation records, yet disparate national standards complicate reliable energy origin certification.
  • These structural bottlenecks impede effective environmental claim defense, delaying compliance approvals by an average of 15% in cross-border transactions. Ultimately, resolving these standardization deficits is essential to reducing administrative friction and ensuring the long-term credibility of corporate net-zero commitments.

Exclusive Technavio Analysis on Customer Landscape

The renewable energy certificate market forecasting report includes the adoption lifecycle of the market, covering from the innovator’s stage to the laggard’s stage. It focuses on adoption rates in different regions based on penetration. Furthermore, the renewable energy certificate market report also includes key purchase criteria and drivers of price sensitivity to help companies evaluate and develop their market growth analysis strategies.
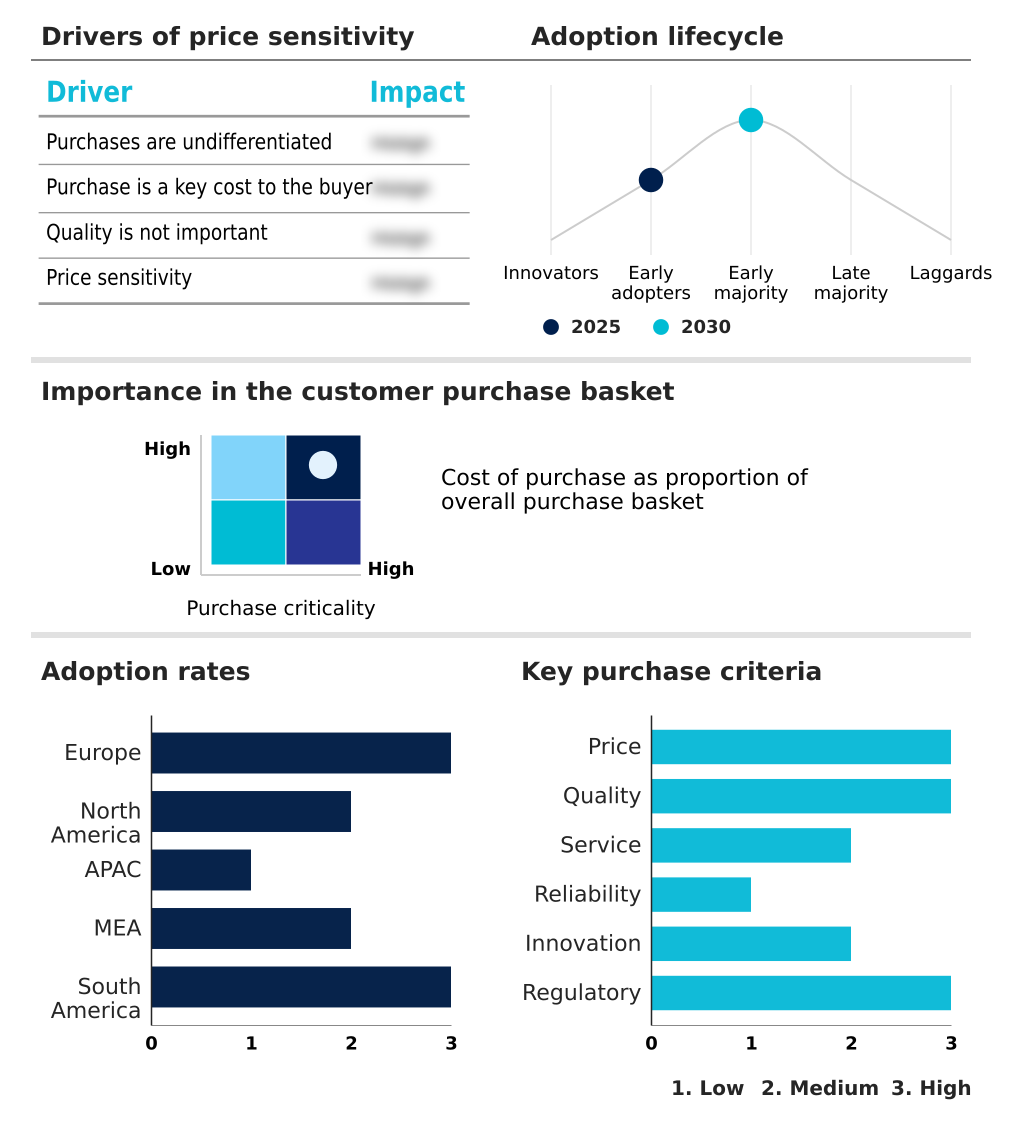
Customer Landscape of Renewable Energy Certificate Industry

Competitive Landscape

Companies are implementing various strategies, such as strategic alliances, renewable energy certificate market forecast, partnerships, mergers and acquisitions, geographical expansion, and product/service launches, to enhance their presence in the industry.

3Degrees Group Inc. - The portfolio encompasses advanced green power instruments, rigorous carbon offset solutions, and strategic environmental commodity procurement services designed to facilitate verifiable corporate decarbonization initiatives.

The industry research and growth report includes detailed analyses of the competitive landscape of the market and information about key companies, including:

  • 3Degrees Group Inc.
  • Acciona SA
  • ACT Group
  • Anew Climate LLC
  • BayWa r.e. AG
  • Brookfield Business Partners LP
  • Constellation Energy Corp.
  • Eneco B.V.
  • ENGIE SA
  • Iberdrola SA
  • Nextera Energy Inc.
  • Redshaw Advisors Ltd.
  • RWE AG
  • Schneider Electric SE
  • Shell plc
  • South Pole
  • Statkraft AS
  • STX Group
  • TotalEnergies SE
  • Vattenfall AB

Qualitative and quantitative analysis of companies has been conducted to help clients understand the wider business environment as well as the strengths and weaknesses of key industry players. Data is qualitatively analyzed to categorize companies as pure play, category-focused, industry-focused, and diversified; it is quantitatively analyzed to categorize companies as dominant, leading, strong, tentative, and weak.

Recent Development and News in Renewable energy certificate market

  • In the Renewable Electricity industry, the aggressive deployment of utility-scale solar arrays has expanded baseline generation capacity by over 15%, directly impacting Renewable Energy Certificate demand by increasing the availability of unbundled environmental attributes.
  • The integration of smart grid infrastructure and automated verification protocols has enabled 24-hour tracking of decentralized energy networks, enhancing the credibility of fractional certificate trading for commercial buyers.
  • Strict corporate sustainability mandates and statutory environmental compliance requirements have forced heavy industrial consumers to restructure green electricity procurement, creating a 100% renewable target baseline for verified carbon-free energy claims.
  • The adoption of cross-border attribute transfer mechanisms and tokenized green energy attributes has reduced administrative friction by nearly 20% across interconnected grids, allowing organizations to satisfy decarbonization policy directives efficiently.

Dive into Technavio’s robust research methodology, blending expert interviews, extensive data synthesis, and validated models for unparalleled Renewable Energy Certificate Market insights. See full methodology.

Market Scope
Page number 319
Base year 2025
Historic period 2020-2024
Forecast period 2026-2030
Growth momentum & CAGR Accelerate at a CAGR of 10.3%
Market growth 2026-2030 USD 13411.8 million
Market structure Fragmented
YoY growth 2025-2026(%) 9.7%
Key countries Germany, UK, France, The Netherlands, Spain, Italy, US, Canada, Mexico, China, Japan, Australia, India, South Korea, Singapore, Saudi Arabia, South Africa, UAE, Turkey, Egypt, Brazil, Argentina and Colombia
Competitive landscape Leading Companies, Market Positioning of Companies, Competitive Strategies, and Industry Risks

Request Free Sample

Research Analyst Overview

  • The modernization of environmental attribute tracking fundamentally dictates the operational and compliance strategies of heavy industrial and technology sectors. Organizations increasingly leverage precise energy verification instruments to validate their sustainability credentials, directly influencing critical boardroom decisions regarding supply chain design and facility location.
  • The definitive shift toward high-frequency, time-stamped energy tracking fundamentally alters corporate procurement strategies, compelling businesses to adopt dynamic pricing models and robust digital accounting frameworks. By implementing automated registry systems, enterprises have secured a 30% reduction in processing time for compliance auditing, substantially lowering administrative overhead while minimizing regulatory exposure.
  • This technological maturation completely eliminates the risks associated with manual data entry and double-counting across interconnected utility networks. Consequently, integrating verified green energy assets into enterprise resource planning software provides decision-makers with the necessary transparency to navigate evolving legislative mandates confidently.
  • The continuous refinement of these tracking ecosystems ensures that capital flows efficiently toward sustainable infrastructure, driving systemic improvements in regional power grid reliability and long-term decarbonization efforts.

What are the Key Data Covered in this Renewable Energy Certificate Market Research and Growth Report?

  • What is the expected growth of the Renewable Energy Certificate Market between 2026 and 2030?

    • USD 13.41 billion, at a CAGR of 10.3%

  • What segmentation does the market report cover?

    • The report is segmented by Type (Compliance REC, and Voluntary REC), Source (Solar, Wind, Hydropower, Biomass, and Others), End-user (Utilities and energy suppliers, Commercial and industrial, Government and municipalities, Residential, and Others) and Geography (Europe, North America, APAC, Middle East and Africa, South America)

  • Which regions are analyzed in the report?

    • Europe, North America, APAC, Middle East and Africa and South America

  • What are the key growth drivers and market challenges?

    • Escalation of corporate sustainability mandates and ESG integration, Lack of global standardization and technical interoperability across jurisdictions

  • Who are the major players in the Renewable Energy Certificate Market?

    • 3Degrees Group Inc., Acciona SA, ACT Group, Anew Climate LLC, BayWa r.e. AG, Brookfield Business Partners LP, Constellation Energy Corp., Eneco B.V., ENGIE SA, Iberdrola SA, Nextera Energy Inc., Redshaw Advisors Ltd., RWE AG, Schneider Electric SE, Shell plc, South Pole, Statkraft AS, STX Group, TotalEnergies SE and Vattenfall AB

Market Research Insights

  • The Renewable Energy Certificate Market facilitates transparent environmental reporting by unbundling clean power generation from physical electricity delivery. Industrial organizations utilizing energy origin certification have improved their regulatory alignment by 35%, ensuring precise electricity mix verification across disparate operational hubs.
  • The implementation of grid balancing services tied to certificate issuance has augmented system reliability, decreasing energy waste by 18% during peak generation periods. By adopting these instruments, multinational enterprises successfully satisfy rigorous corporate sustainability mandates, accelerating their progression toward carbon neutrality targets.
  • Furthermore, the integration of digital tracking bolsters greenwashing risk mitigation, yielding a 25% increase in verified environmental claim defense capabilities during external compliance audits.

We can help! Our analysts can customize this renewable energy certificate market research report to meet your requirements.

Get in touch

1. Executive Summary

1.1 Market overview

Executive Summary - Chart on Market Overview
Executive Summary - Data Table on Market Overview
Executive Summary - Chart on Global Market Characteristics
Executive Summary - Chart on Market by Geography
Executive Summary - Chart on Market Segmentation by Type
Executive Summary - Chart on Market Segmentation by Source
Executive Summary - Chart on Market Segmentation by End-user
Executive Summary - Chart on Incremental Growth
Executive Summary - Data Table on Incremental Growth
Executive Summary - Chart on Company Market Positioning

2. Technavio Analysis

2.1 Analysis of price sensitivity, lifecycle, customer purchase basket, adoption rates, and purchase criteria

2.2 Criticality of inputs and Factors of differentiation

Chart on Overview on criticality of inputs and factors of differentiation

2.3 Factors of disruption

Chart on Overview on factors of disruption

2.4 Impact of drivers and challenges

Chart on Impact of drivers and challenges in 2025 and 2030

3. Market Landscape

3.1 Market ecosystem

Chart on Parent Market
Data Table on - Parent Market

3.2 Market characteristics

Chart on Market characteristics analysis

3.3 Value chain analysis

Chart on Value chain analysis

4. Market Sizing

4.1 Market definition

Data Table on Offerings of companies included in the market definition

4.2 Market segment analysis

Market segments

4.3 Market size 2025

4.4 Market outlook: Forecast for 2025-2030

Chart on Global - Market size and forecast 2025-2030 ($ million)
Data Table on Global - Market size and forecast 2025-2030 ($ million)
Chart on Global Market: Year-over-year growth 2025-2030 (%)
Data Table on Global Market: Year-over-year growth 2025-2030 (%)

5. Historic Market Size

5.1 Global Renewable Energy Certificate Market 2020 - 2024

Historic Market Size - Data Table on Global Renewable Energy Certificate Market 2020 - 2024 ($ million)

5.2 Type segment analysis 2020 - 2024

Historic Market Size - Type Segment 2020 - 2024 ($ million)

5.3 Source segment analysis 2020 - 2024

Historic Market Size - Source Segment 2020 - 2024 ($ million)

5.4 End-user segment analysis 2020 - 2024

Historic Market Size - End-user Segment 2020 - 2024 ($ million)

5.5 Geography segment analysis 2020 - 2024

Historic Market Size - Geography Segment 2020 - 2024 ($ million)

5.6 Country segment analysis 2020 - 2024

Historic Market Size - Country Segment 2020 - 2024 ($ million)

6. Qualitative Analysis

6.1 Impact of AI on Global Renewable Energy Certificate Market

6.2 Impact of geopolitical conflicts on Global Renewable Energy Certificate Market

7. Five Forces Analysis

7.1 Five forces summary

Five forces analysis - Comparison between 2025 and 2030

7.2 Bargaining power of buyers

Bargaining power of buyers - Impact of key factors 2025 and 2030

7.3 Bargaining power of suppliers

Bargaining power of suppliers - Impact of key factors in 2025 and 2030

7.4 Threat of new entrants

Threat of new entrants - Impact of key factors in 2025 and 2030

7.5 Threat of substitutes

Threat of substitutes - Impact of key factors in 2025 and 2030

7.6 Threat of rivalry

Threat of rivalry - Impact of key factors in 2025 and 2030

7.7 Market condition

Chart on Market condition - Five forces 2025 and 2030

8. Market Segmentation by Type

8.1 Market segments

Chart on Type - Market share 2025-2030 (%)
Data Table on Type - Market share 2025-2030 (%)

8.2 Comparison by Type

Chart on Comparison by Type
Data Table on Comparison by Type

8.3 Compliance REC - Market size and forecast 2025-2030

Chart on Compliance REC - Market size and forecast 2025-2030 ($ million)
Data Table on Compliance REC - Market size and forecast 2025-2030 ($ million)
Chart on Compliance REC - Year-over-year growth 2025-2030 (%)
Data Table on Compliance REC - Year-over-year growth 2025-2030 (%)

8.4 Voluntary REC - Market size and forecast 2025-2030

Chart on Voluntary REC - Market size and forecast 2025-2030 ($ million)
Data Table on Voluntary REC - Market size and forecast 2025-2030 ($ million)
Chart on Voluntary REC - Year-over-year growth 2025-2030 (%)
Data Table on Voluntary REC - Year-over-year growth 2025-2030 (%)

8.5 Market opportunity by Type

Market opportunity by Type ($ million)
Data Table on Market opportunity by Type ($ million)

9. Market Segmentation by Source

9.1 Market segments

Chart on Source - Market share 2025-2030 (%)
Data Table on Source - Market share 2025-2030 (%)

9.2 Comparison by Source

Chart on Comparison by Source
Data Table on Comparison by Source

9.3 Solar - Market size and forecast 2025-2030

Chart on Solar - Market size and forecast 2025-2030 ($ million)
Data Table on Solar - Market size and forecast 2025-2030 ($ million)
Chart on Solar - Year-over-year growth 2025-2030 (%)
Data Table on Solar - Year-over-year growth 2025-2030 (%)

9.4 Wind - Market size and forecast 2025-2030

Chart on Wind - Market size and forecast 2025-2030 ($ million)
Data Table on Wind - Market size and forecast 2025-2030 ($ million)
Chart on Wind - Year-over-year growth 2025-2030 (%)
Data Table on Wind - Year-over-year growth 2025-2030 (%)

9.5 Hydropower - Market size and forecast 2025-2030

Chart on Hydropower - Market size and forecast 2025-2030 ($ million)
Data Table on Hydropower - Market size and forecast 2025-2030 ($ million)
Chart on Hydropower - Year-over-year growth 2025-2030 (%)
Data Table on Hydropower - Year-over-year growth 2025-2030 (%)

9.6 Biomass - Market size and forecast 2025-2030

Chart on Biomass - Market size and forecast 2025-2030 ($ million)
Data Table on Biomass - Market size and forecast 2025-2030 ($ million)
Chart on Biomass - Year-over-year growth 2025-2030 (%)
Data Table on Biomass - Year-over-year growth 2025-2030 (%)

9.7 Others - Market size and forecast 2025-2030

Chart on Others - Market size and forecast 2025-2030 ($ million)
Data Table on Others - Market size and forecast 2025-2030 ($ million)
Chart on Others - Year-over-year growth 2025-2030 (%)
Data Table on Others - Year-over-year growth 2025-2030 (%)

9.8 Market opportunity by Source

Market opportunity by Source ($ million)
Data Table on Market opportunity by Source ($ million)

10. Market Segmentation by End-user

10.1 Market segments

Chart on End-user - Market share 2025-2030 (%)
Data Table on End-user - Market share 2025-2030 (%)

10.2 Comparison by End-user

Chart on Comparison by End-user
Data Table on Comparison by End-user

10.3 Utilities and energy suppliers - Market size and forecast 2025-2030

Chart on Utilities and energy suppliers - Market size and forecast 2025-2030 ($ million)
Data Table on Utilities and energy suppliers - Market size and forecast 2025-2030 ($ million)
Chart on Utilities and energy suppliers - Year-over-year growth 2025-2030 (%)
Data Table on Utilities and energy suppliers - Year-over-year growth 2025-2030 (%)

10.4 Commercial and industrial - Market size and forecast 2025-2030

Chart on Commercial and industrial - Market size and forecast 2025-2030 ($ million)
Data Table on Commercial and industrial - Market size and forecast 2025-2030 ($ million)
Chart on Commercial and industrial - Year-over-year growth 2025-2030 (%)
Data Table on Commercial and industrial - Year-over-year growth 2025-2030 (%)

10.5 Government and municipalities - Market size and forecast 2025-2030

Chart on Government and municipalities - Market size and forecast 2025-2030 ($ million)
Data Table on Government and municipalities - Market size and forecast 2025-2030 ($ million)
Chart on Government and municipalities - Year-over-year growth 2025-2030 (%)
Data Table on Government and municipalities - Year-over-year growth 2025-2030 (%)

10.6 Residential - Market size and forecast 2025-2030

Chart on Residential - Market size and forecast 2025-2030 ($ million)
Data Table on Residential - Market size and forecast 2025-2030 ($ million)
Chart on Residential - Year-over-year growth 2025-2030 (%)
Data Table on Residential - Year-over-year growth 2025-2030 (%)

10.7 Others - Market size and forecast 2025-2030

Chart on Others - Market size and forecast 2025-2030 ($ million)
Data Table on Others - Market size and forecast 2025-2030 ($ million)
Chart on Others - Year-over-year growth 2025-2030 (%)
Data Table on Others - Year-over-year growth 2025-2030 (%)

10.8 Market opportunity by End-user

Market opportunity by End-user ($ million)
Data Table on Market opportunity by End-user ($ million)

11. Customer Landscape

11.1 Customer landscape overview

Analysis of price sensitivity, lifecycle, customer purchase basket, adoption rates, and purchase criteria

12. Geographic Landscape

12.1 Geographic segmentation

Chart on Market share by geography 2025-2030 (%)
Data Table on Market share by geography 2025-2030 (%)

12.2 Geographic comparison

Chart on Geographic comparison
Data Table on Geographic comparison

12.3 Europe - Market size and forecast 2025-2030

Chart on Europe - Market size and forecast 2025-2030 ($ million)
Data Table on Europe - Market size and forecast 2025-2030 ($ million)
Chart on Europe - Year-over-year growth 2025-2030 (%)
Data Table on Europe - Year-over-year growth 2025-2030 (%)
Chart on Regional Comparison - Europe
Data Table on Regional Comparison - Europe

12.3.1 Germany - Market size and forecast 2025-2030

Chart on Germany - Market size and forecast 2025-2030 ($ million)
Data Table on Germany - Market size and forecast 2025-2030 ($ million)
Chart on Germany - Year-over-year growth 2025-2030 (%)
Data Table on Germany - Year-over-year growth 2025-2030 (%)

12.3.2 UK - Market size and forecast 2025-2030

Chart on UK - Market size and forecast 2025-2030 ($ million)
Data Table on UK - Market size and forecast 2025-2030 ($ million)
Chart on UK - Year-over-year growth 2025-2030 (%)
Data Table on UK - Year-over-year growth 2025-2030 (%)

12.3.3 France - Market size and forecast 2025-2030

Chart on France - Market size and forecast 2025-2030 ($ million)
Data Table on France - Market size and forecast 2025-2030 ($ million)
Chart on France - Year-over-year growth 2025-2030 (%)
Data Table on France - Year-over-year growth 2025-2030 (%)

12.3.4 The Netherlands - Market size and forecast 2025-2030

Chart on The Netherlands - Market size and forecast 2025-2030 ($ million)
Data Table on The Netherlands - Market size and forecast 2025-2030 ($ million)
Chart on The Netherlands - Year-over-year growth 2025-2030 (%)
Data Table on The Netherlands - Year-over-year growth 2025-2030 (%)

12.3.5 Spain - Market size and forecast 2025-2030

Chart on Spain - Market size and forecast 2025-2030 ($ million)
Data Table on Spain - Market size and forecast 2025-2030 ($ million)
Chart on Spain - Year-over-year growth 2025-2030 (%)
Data Table on Spain - Year-over-year growth 2025-2030 (%)

12.3.6 Italy - Market size and forecast 2025-2030

Chart on Italy - Market size and forecast 2025-2030 ($ million)
Data Table on Italy - Market size and forecast 2025-2030 ($ million)
Chart on Italy - Year-over-year growth 2025-2030 (%)
Data Table on Italy - Year-over-year growth 2025-2030 (%)

12.4 North America - Market size and forecast 2025-2030

Chart on North America - Market size and forecast 2025-2030 ($ million)
Data Table on North America - Market size and forecast 2025-2030 ($ million)
Chart on North America - Year-over-year growth 2025-2030 (%)
Data Table on North America - Year-over-year growth 2025-2030 (%)
Chart on Regional Comparison - North America
Data Table on Regional Comparison - North America

12.4.1 US - Market size and forecast 2025-2030

Chart on US - Market size and forecast 2025-2030 ($ million)
Data Table on US - Market size and forecast 2025-2030 ($ million)
Chart on US - Year-over-year growth 2025-2030 (%)
Data Table on US - Year-over-year growth 2025-2030 (%)

12.4.2 Canada - Market size and forecast 2025-2030

Chart on Canada - Market size and forecast 2025-2030 ($ million)
Data Table on Canada - Market size and forecast 2025-2030 ($ million)
Chart on Canada - Year-over-year growth 2025-2030 (%)
Data Table on Canada - Year-over-year growth 2025-2030 (%)

12.4.3 Mexico - Market size and forecast 2025-2030

Chart on Mexico - Market size and forecast 2025-2030 ($ million)
Data Table on Mexico - Market size and forecast 2025-2030 ($ million)
Chart on Mexico - Year-over-year growth 2025-2030 (%)
Data Table on Mexico - Year-over-year growth 2025-2030 (%)

12.5 APAC - Market size and forecast 2025-2030

Chart on APAC - Market size and forecast 2025-2030 ($ million)
Data Table on APAC - Market size and forecast 2025-2030 ($ million)
Chart on APAC - Year-over-year growth 2025-2030 (%)
Data Table on APAC - Year-over-year growth 2025-2030 (%)
Chart on Regional Comparison - APAC
Data Table on Regional Comparison - APAC

12.5.1 China - Market size and forecast 2025-2030

Chart on China - Market size and forecast 2025-2030 ($ million)
Data Table on China - Market size and forecast 2025-2030 ($ million)
Chart on China - Year-over-year growth 2025-2030 (%)
Data Table on China - Year-over-year growth 2025-2030 (%)

12.5.2 Japan - Market size and forecast 2025-2030

Chart on Japan - Market size and forecast 2025-2030 ($ million)
Data Table on Japan - Market size and forecast 2025-2030 ($ million)
Chart on Japan - Year-over-year growth 2025-2030 (%)
Data Table on Japan - Year-over-year growth 2025-2030 (%)

12.5.3 Australia - Market size and forecast 2025-2030

Chart on Australia - Market size and forecast 2025-2030 ($ million)
Data Table on Australia - Market size and forecast 2025-2030 ($ million)
Chart on Australia - Year-over-year growth 2025-2030 (%)
Data Table on Australia - Year-over-year growth 2025-2030 (%)

12.5.4 India - Market size and forecast 2025-2030

Chart on India - Market size and forecast 2025-2030 ($ million)
Data Table on India - Market size and forecast 2025-2030 ($ million)
Chart on India - Year-over-year growth 2025-2030 (%)
Data Table on India - Year-over-year growth 2025-2030 (%)

12.5.5 South Korea - Market size and forecast 2025-2030

Chart on South Korea - Market size and forecast 2025-2030 ($ million)
Data Table on South Korea - Market size and forecast 2025-2030 ($ million)
Chart on South Korea - Year-over-year growth 2025-2030 (%)
Data Table on South Korea - Year-over-year growth 2025-2030 (%)

12.5.6 Singapore - Market size and forecast 2025-2030

Chart on Singapore - Market size and forecast 2025-2030 ($ million)
Data Table on Singapore - Market size and forecast 2025-2030 ($ million)
Chart on Singapore - Year-over-year growth 2025-2030 (%)
Data Table on Singapore - Year-over-year growth 2025-2030 (%)

12.6 Middle East and Africa - Market size and forecast 2025-2030

Chart on Middle East and Africa - Market size and forecast 2025-2030 ($ million)
Data Table on Middle East and Africa - Market size and forecast 2025-2030 ($ million)
Chart on Middle East and Africa - Year-over-year growth 2025-2030 (%)
Data Table on Middle East and Africa - Year-over-year growth 2025-2030 (%)
Chart on Regional Comparison - Middle East and Africa
Data Table on Regional Comparison - Middle East and Africa

12.6.1 Saudi Arabia - Market size and forecast 2025-2030

Chart on Saudi Arabia - Market size and forecast 2025-2030 ($ million)
Data Table on Saudi Arabia - Market size and forecast 2025-2030 ($ million)
Chart on Saudi Arabia - Year-over-year growth 2025-2030 (%)
Data Table on Saudi Arabia - Year-over-year growth 2025-2030 (%)

12.6.2 South Africa - Market size and forecast 2025-2030

Chart on South Africa - Market size and forecast 2025-2030 ($ million)
Data Table on South Africa - Market size and forecast 2025-2030 ($ million)
Chart on South Africa - Year-over-year growth 2025-2030 (%)
Data Table on South Africa - Year-over-year growth 2025-2030 (%)

12.6.3 UAE - Market size and forecast 2025-2030

Chart on UAE - Market size and forecast 2025-2030 ($ million)
Data Table on UAE - Market size and forecast 2025-2030 ($ million)
Chart on UAE - Year-over-year growth 2025-2030 (%)
Data Table on UAE - Year-over-year growth 2025-2030 (%)

12.6.4 Turkey - Market size and forecast 2025-2030

Chart on Turkey - Market size and forecast 2025-2030 ($ million)
Data Table on Turkey - Market size and forecast 2025-2030 ($ million)
Chart on Turkey - Year-over-year growth 2025-2030 (%)
Data Table on Turkey - Year-over-year growth 2025-2030 (%)

12.6.5 Egypt - Market size and forecast 2025-2030

Chart on Egypt - Market size and forecast 2025-2030 ($ million)
Data Table on Egypt - Market size and forecast 2025-2030 ($ million)
Chart on Egypt - Year-over-year growth 2025-2030 (%)
Data Table on Egypt - Year-over-year growth 2025-2030 (%)

12.7 South America - Market size and forecast 2025-2030

Chart on South America - Market size and forecast 2025-2030 ($ million)
Data Table on South America - Market size and forecast 2025-2030 ($ million)
Chart on South America - Year-over-year growth 2025-2030 (%)
Data Table on South America - Year-over-year growth 2025-2030 (%)
Chart on Regional Comparison - South America
Data Table on Regional Comparison - South America

12.7.1 Brazil - Market size and forecast 2025-2030

Chart on Brazil - Market size and forecast 2025-2030 ($ million)
Data Table on Brazil - Market size and forecast 2025-2030 ($ million)
Chart on Brazil - Year-over-year growth 2025-2030 (%)
Data Table on Brazil - Year-over-year growth 2025-2030 (%)

12.7.2 Argentina - Market size and forecast 2025-2030

Chart on Argentina - Market size and forecast 2025-2030 ($ million)
Data Table on Argentina - Market size and forecast 2025-2030 ($ million)
Chart on Argentina - Year-over-year growth 2025-2030 (%)
Data Table on Argentina - Year-over-year growth 2025-2030 (%)

12.7.3 Colombia - Market size and forecast 2025-2030

Chart on Colombia - Market size and forecast 2025-2030 ($ million)
Data Table on Colombia - Market size and forecast 2025-2030 ($ million)
Chart on Colombia - Year-over-year growth 2025-2030 (%)
Data Table on Colombia - Year-over-year growth 2025-2030 (%)

12.8 Market opportunity by geography

Market opportunity by geography ($ million)
Data Tables on Market opportunity by geography ($ million)

13. Drivers, Challenges, and Opportunity

13.1 Market drivers

Escalation of corporate sustainability mandates and ESG integration
Strengthening of government regulatory frameworks and legislative support
Integration of advanced digital technologies for market transparency and efficiency

13.2 Market challenges

Lack of global standardization and technical interoperability across jurisdictions
Market volatility and destabilizing effects of certificate oversupply
Increasing scrutiny regarding additionality and hourly matching requirements

13.3 Impact of drivers and challenges

Impact of drivers and challenges in 2025 and 2030

13.4 Market opportunities

Transition toward twenty-four-seven carbon-free energy and temporal granularity
Digitalization and tokenization of environmental assets via distributed ledger technology
Geographical diversification and rise of voluntary markets in global south

14. Competitive Landscape

14.1 Overview

14.2

Overview on criticality of inputs and factors of differentiation

14.3 Landscape disruption

Overview on factors of disruption

14.4 Industry risks

Impact of key risks on business

15. Competitive Analysis

15.1 Companies profiled

Companies covered

15.2 Company ranking index

15.3 Market positioning of companies

Matrix on companies position and classification

15.4 Acciona SA

Acciona SA - Overview
Acciona SA - Business segments
Acciona SA - Key offerings
Acciona SA - Segment focus
SWOT

15.5 ACT Group

ACT Group - Overview
ACT Group - Product / Service
ACT Group - Key offerings
SWOT

15.6 Anew Climate LLC

Anew Climate LLC - Overview
Anew Climate LLC - Product / Service
Anew Climate LLC - Key offerings
SWOT

15.7 BayWa r.e. AG

BayWa r.e. AG - Overview
BayWa r.e. AG - Product / Service
BayWa r.e. AG - Key offerings
SWOT

15.8 Brookfield Business Partners LP

Brookfield Business Partners LP - Overview
Brookfield Business Partners LP - Business segments
Brookfield Business Partners LP - Key offerings
Brookfield Business Partners LP - Segment focus
SWOT

15.9 Constellation Energy Corp.

Constellation Energy Corp. - Overview
Constellation Energy Corp. - Business segments
Constellation Energy Corp. - Key offerings
Constellation Energy Corp. - Segment focus
SWOT

15.10 Eneco B.V.

Eneco B.V. - Overview
Eneco B.V. - Product / Service
Eneco B.V. - Key offerings
SWOT

15.11 ENGIE SA

ENGIE SA - Overview
ENGIE SA - Business segments
ENGIE SA - Key news
ENGIE SA - Key offerings
ENGIE SA - Segment focus
SWOT

15.12 Iberdrola SA

Iberdrola SA - Overview
Iberdrola SA - Business segments
Iberdrola SA - Key offerings
Iberdrola SA - Segment focus
SWOT

15.13 Nextera Energy Inc.

Nextera Energy Inc. - Overview
Nextera Energy Inc. - Business segments
Nextera Energy Inc. - Key offerings
Nextera Energy Inc. - Segment focus
SWOT

15.14 RWE AG

RWE AG - Overview
RWE AG - Business segments
RWE AG - Key offerings
RWE AG - Segment focus
SWOT

15.15 Schneider Electric SE

Schneider Electric SE - Overview
Schneider Electric SE - Business segments
Schneider Electric SE - Key news
Schneider Electric SE - Key offerings
Schneider Electric SE - Segment focus
SWOT

15.16 Shell plc

Shell plc - Overview
Shell plc - Business segments
Shell plc - Key offerings
Shell plc - Segment focus
SWOT

15.17 STX Group

STX Group - Overview
STX Group - Product / Service
STX Group - Key offerings
SWOT

15.18 TotalEnergies SE

TotalEnergies SE - Overview
TotalEnergies SE - Business segments
TotalEnergies SE - Key news
TotalEnergies SE - Key offerings
TotalEnergies SE - Segment focus
SWOT

16. Appendix

16.1 Scope of the report

Market definition
Objectives
Notes and caveats

16.2 Inclusions and exclusions checklist

Inclusions checklist
Exclusions checklist

16.3 Currency conversion rates for US$

16.4 Research methodology

16.5 Data procurement

Information sources

16.6 Data validation

16.7 Validation techniques employed for market sizing

16.8 Data synthesis

16.9 360 degree market analysis

16.10 List of abbreviations

Research Methodology

Technavio presents a detailed picture of the market by way of study, synthesis, and summation of data from multiple sources. The analysts have presented the various facets of the market with a particular focus on identifying the key industry influencers. The data thus presented is comprehensive, reliable, and the result of extensive research, both primary and secondary.

INFORMATION SOURCES

Primary sources

  • Manufacturers and suppliers
  • Channel partners
  • Industry experts
  • Strategic decision makers

Secondary sources

  • Industry journals and periodicals
  • Government data
  • Financial reports of key industry players
  • Historical data
  • Press releases

DATA ANALYSIS

Data Synthesis

  • Collation of data
  • Estimation of key figures
  • Analysis of derived insights

Data Validation

  • Triangulation with data models
  • Reference against proprietary databases
  • Corroboration with industry experts

REPORT WRITING

Qualitative

  • Market drivers
  • Market challenges
  • Market trends
  • Five forces analysis

Quantitative

  • Market size and forecast
  • Market segmentation
  • Geographical insights
  • Competitive landscape

Interested in this report?

Get your sample now to see our research methodology and insights!

Download Now

Frequently Asked Questions

Renewable Energy Certificate market growth will increase by USD 13411.8 million during 2026-2030.

The Renewable Energy Certificate market is expected to grow at a CAGR of 10.3% during 2026-2030.

Renewable Energy Certificate market is segmented by Type (Compliance REC, Voluntary REC) Source (Solar, Wind, Hydropower, Biomass, Others) End-user (Utilities and energy suppliers, Commercial and industrial, Government and municipalities, Residential, Others)

3Degrees Group Inc., Acciona SA, ACT Group, Anew Climate LLC, BayWa r.e. AG, Brookfield Business Partners LP, Constellation Energy Corp., Eneco B.V., ENGIE SA, Iberdrola SA, Nextera Energy Inc., Redshaw Advisors Ltd., RWE AG, Schneider Electric SE, Shell plc, South Pole, Statkraft AS, STX Group, TotalEnergies SE, Vattenfall AB are a few of the key vendors in the Renewable Energy Certificate market.

Europe will register the highest growth rate of 40.2% among the other regions. Therefore, the Renewable Energy Certificate market in Europe is expected to garner significant business opportunities for the vendors during the forecast period.

Germany, UK, France, The Netherlands, Spain, Italy, US, Canada, Mexico, China, Japan, Australia, India, South Korea, Singapore, Saudi Arabia, South Africa, UAE, Turkey, Egypt, Brazil, Argentina, Colombia

  • Escalation of corporate sustainability mandates and ESG integration is the driving factor this market.

The Renewable Energy Certificate market vendors should focus on grabbing business opportunities from the Type segment as it accounted for the largest market share in the base year.
RIA - Research AI Assistant
Ask RIA
