
Renewable Energy Forecasting Software Market Size and Growth Forecast 2026-2030
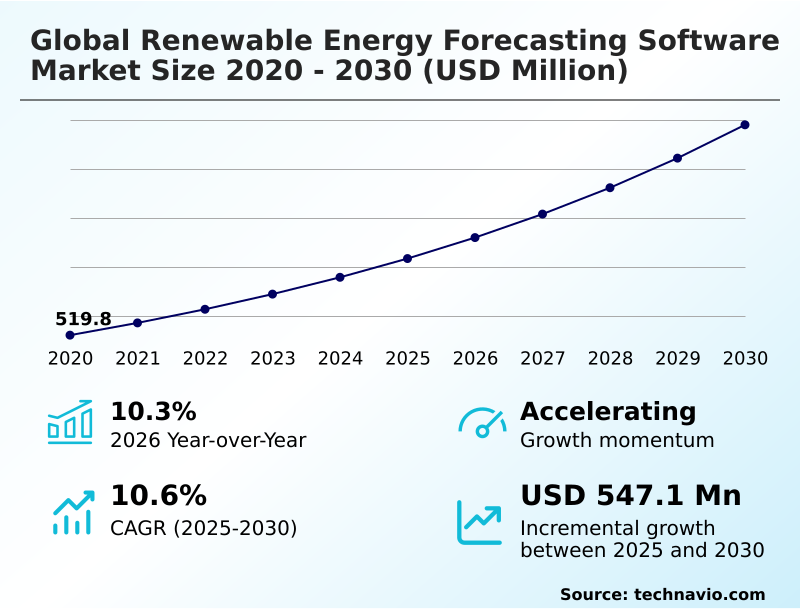
The Renewable Energy Forecasting Software Market size was valued at USD 833.2 million in 2025 growing at a CAGR of 10.6% during the forecast period 2026-2030.
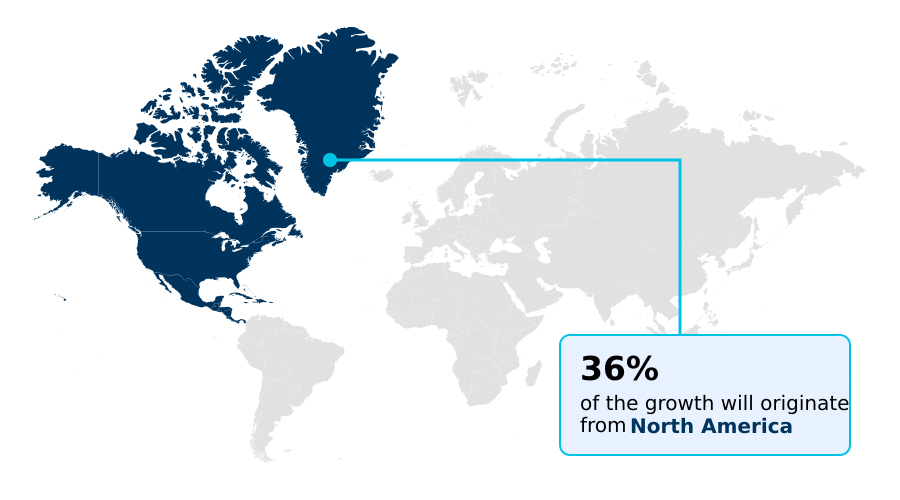
North America accounts for 35.6% of incremental growth during the forecast period. The Cloud based segment by Deployment was valued at USD 531.9 million in 2024, while the Grid operators segment holds the largest revenue share by End-user.
The market is projected to grow by USD 860.5 million from 2020 to 2030, with USD 547.1 million of the growth expected during the forecast period of 2025 to 2030.
Get Key Insights on Market Forecast (PDF) Request Free Sample
Renewable Energy Forecasting Software Market Overview
The renewable energy forecasting software market is defined by the critical need for grid stability management amidst rising variable generation. North America is set to contribute over 35% of the market's incremental growth, driven by grid modernization and the integration of distributed energy resources. Within this context, asset performance management has become a focal point. For instance, a transmission system operator in a region with high solar penetration, upon deploying a new forecasting suite integrating satellite imagery analysis and deep learning neural networks, can achieve more effective solar ramp event management. This deployment of smart grid technologies typically reduces reliance on spinning reserves by over 15% while improving grid frequency regulation. The software's ability to facilitate energy trading optimization and support demand-response programs is crucial for both utilities and independent power producers. As such, procurement decisions are increasingly based on the sophistication of machine learning algorithms and the platform's capacity for real-time data processing, ensuring that power generation output prediction meets stringent regulatory standards for grid reliability and financial performance.
Drivers, Trends, and Challenges in the Renewable Energy Forecasting Software Market
The strategic deployment of forecasting software for distributed energy resource management is increasingly governed by regulatory frameworks like the European Commission's revised guidelines for grid synchronization. These rules compel operators to adopt more sophisticated tools, moving beyond basic prediction.
For example, an independent power producer developing integrated forecasting for hybrid solar-plus-storage projects now utilizes generative ai for extreme weather scenario simulation to satisfy investor due diligence and secure financing, demonstrating project resilience. This requires a suite of ai-based solar and wind forecasting platforms, with cloud-based platforms for utility-scale renewable integration outpacing on-premise deployments by a significant margin.
The core challenge remains overcoming technical hurdles such as ensuring cybersecurity for renewable energy scada systems and establishing robust api integration for multi-vendor renewable assets. Success is measured by the ability to provide high-frequency forecasting for residential solar arrays and execute predictive analytics for energy arbitrage.
Ultimately, these systems are designed as forecasting tools for managing vre-induced grid instability and as software to minimize energy imbalance penalties, directly impacting the financial viability of power purchase agreements and enabling the use of digital twin for renewable asset performance management.
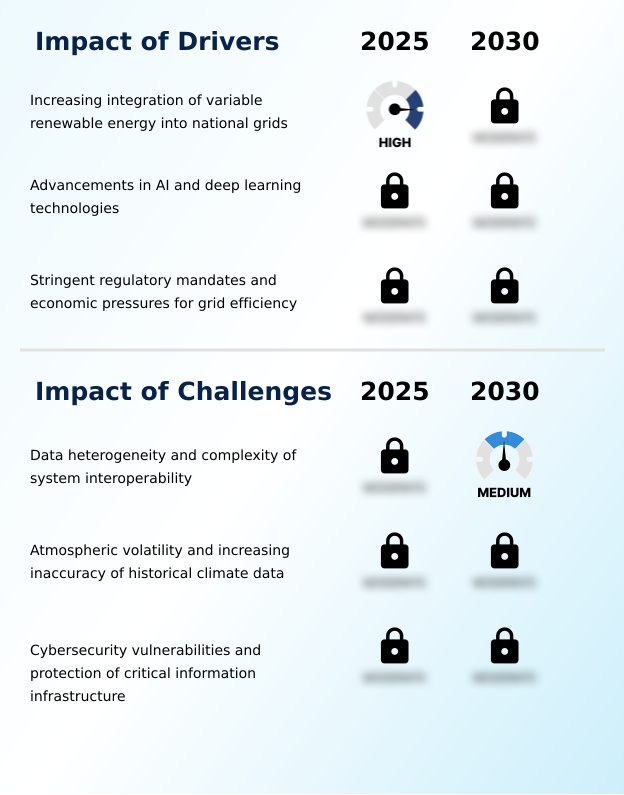
Primary Growth Driver: The increasing integration of variable renewable energy sources into national grids is a primary driver, creating a critical need for software that manages grid stability and balances intermittent power generation.
The market's year-over-year growth of 10.3% is primarily driven by the increasing integration of variable renewable energy, which elevates the need for advanced grid stability management.
As the share of intermittent sources grows, transmission system operator tools must evolve to handle the complexity. Advancements in generative artificial intelligence and edge computing are transforming forecasting capabilities, enabling hyper-local nowcasting and more accurate high-resolution atmospheric data analysis.
These technological leaps provide stakeholders with the confidence to invest in large-scale projects, knowing that the associated risks can be quantified and managed.
Furthermore, stringent regulatory mandates for grid efficiency and reporting, coupled with financial penalties for deviations, compel producers to adopt high-precision tools for power generation output prediction and regulatory compliance reporting.
Emerging Market Trend: The market is witnessing a fundamental shift from deterministic forecasts to probabilistic and risk-based modeling. This approach provides a more comprehensive understanding of prediction uncertainty, essential for advanced grid management.
A significant trend in the market is the shift toward integrated solutions for hybrid energy systems and battery energy storage systems. As the deployment of co-located solar, wind, and storage projects accelerates, there is a greater need for unified platforms that can optimize the entire energy value chain.
Modern software now combines wind power prediction with solar irradiance forecasting and predictive analytics to manage battery charge cycles, maximizing energy arbitrage optimization. This evolution supports the development of virtual power plants, where diverse assets are managed as a single controllable entity.
This trend is particularly beneficial for independent power producers, a segment that is rapidly expanding, as it allows them to maximize the returns on their complex asset portfolios through enhanced risk-based modeling and more precise power generation scheduling.
Key Industry Challenge: Data heterogeneity from diverse hardware and the complexity of system interoperability present a significant challenge, hindering seamless data integration and increasing implementation costs for forecasting solutions.
A primary market challenge is the technical complexity arising from data heterogeneity and a lack of system interoperability. Integrating forecasting software with legacy supervisory control and data acquisition systems from multiple vendors often requires expensive, custom middleware, hindering adoption, especially for on-premises systems.
This issue is compounded by cybersecurity vulnerabilities inherent in connecting previously isolated operational technology security systems to broader IT networks, a critical concern given tightening data sovereignty laws.
Moreover, the increasing volatility of weather patterns due to climate non-stationarity is diminishing the reliability of historical data, forcing developers to constantly recalibrate complex machine learning algorithms to maintain short-term forecasting accuracy and avoid significant financial penalties for energy imbalances.
Explore Full Market Dynamics Analysis Request Free Sample
Renewable Energy Forecasting Software Market Segmentation
The renewable energy forecasting software industry research report provides comprehensive data including region-wise segment analysis, with forecasts and analysis for the period 2026-2030, as well as historical data from 2020-2024 for the following segments.
Deployment Segment Analysis
The cloud based segment is estimated to witness significant growth during the forecast period.
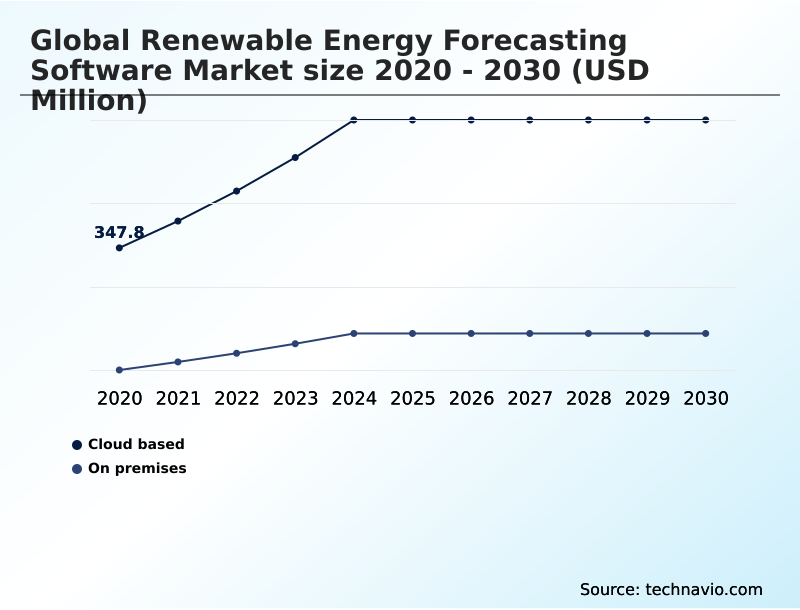
Cloud-based deployment models dominate the renewable energy forecasting software market, accounting for the majority of new installations.
This preference is driven by the inherent scalability and reduced capital expenditure of software-as-a-service (SaaS) models, which enable organizations to process massive datasets without significant on-site hardware investments.
These cloud-native forecasting platforms are essential for real-time data processing and high-frequency data transmission from geographically dispersed assets.
Procurement decisions are increasingly influenced by the availability of robust api interoperability standards, which facilitate seamless integration with existing enterprise systems and third-party data sources.
The architecture of these systems supports the complex computational demands of machine learning algorithms, enabling more accurate power generation output prediction and grid stability management for utilities navigating the energy transition.
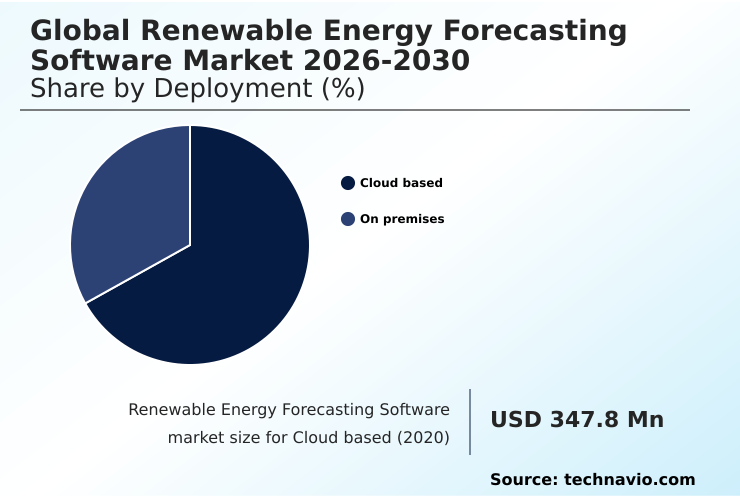
The Cloud based segment was valued at USD 531.9 million in 2024 and showed a gradual increase during the forecast period.
Renewable Energy Forecasting Software Market by Region: North America Leads with 35.6% Growth Share
North America is estimated to contribute 35.6% to the growth of the global market during the forecast period.
The geographic landscape of the renewable energy forecasting software market is characterized by distinct regional growth dynamics.
The APAC region is projected to expand at the highest rate, with a CAGR of 11.7%, driven by massive new wind and solar capacity installations in countries like China and India, necessitating foundational tools for grid integration and wind resource assessment.
In contrast, North America, contributing approximately 35.6% of the market’s incremental growth, reflects a more mature market focused on grid modernization.
In the US and Canada, the emphasis is on managing a high penetration of distributed energy resources and upgrading legacy systems.
This involves deploying advanced solutions for energy arbitrage optimization, load balancing analytics, and photovoltaic system monitoring to enhance the efficiency of an increasingly complex and decentralized power grid.
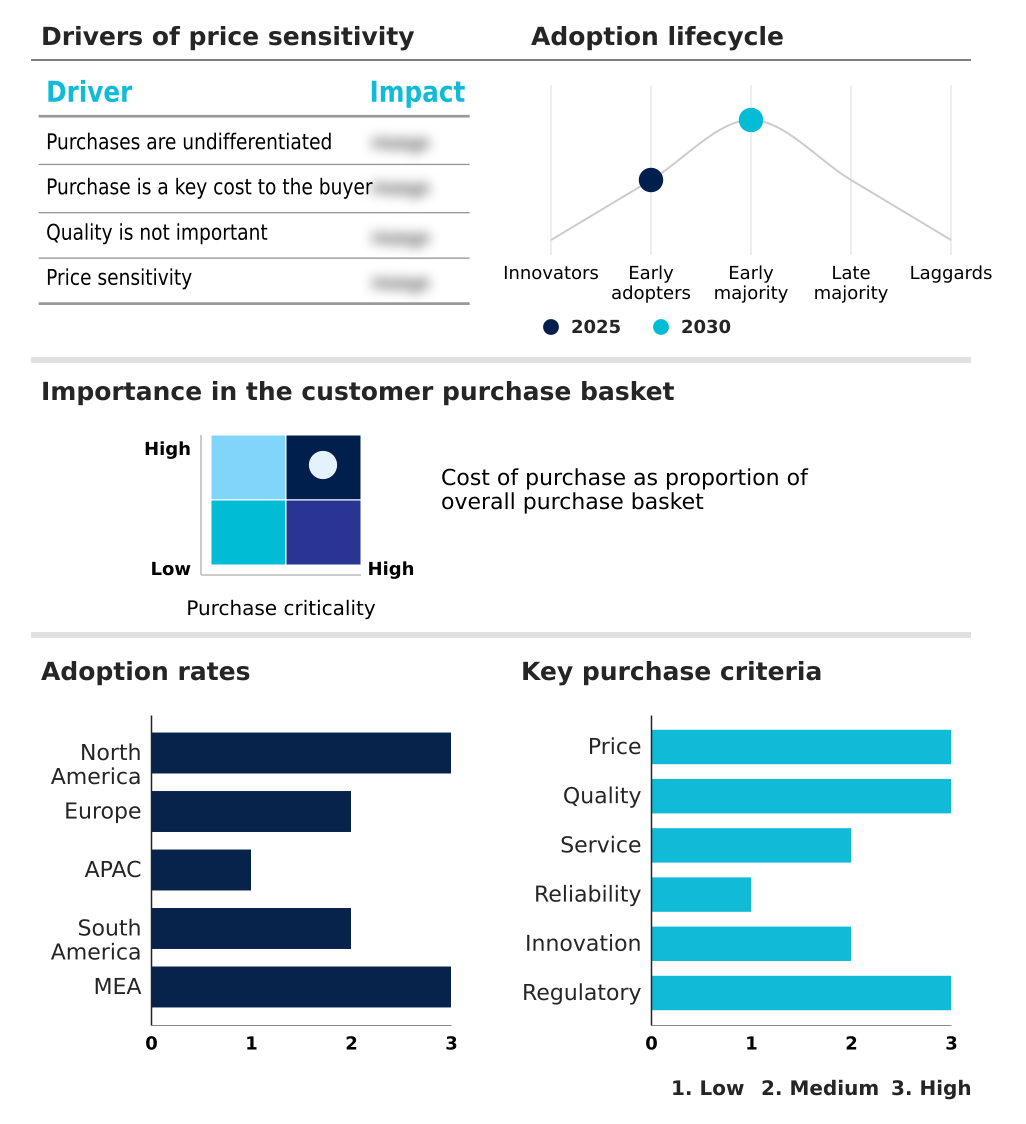
Customer Landscape Analysis for the Renewable Energy Forecasting Software Market
The renewable energy forecasting software market forecasting report includes the adoption lifecycle of the market, covering from the innovator’s stage to the laggard’s stage. It focuses on adoption rates in different regions based on penetration. Furthermore, the renewable energy forecasting software market report also includes key purchase criteria and drivers of price sensitivity to help companies evaluate and develop their market growth analysis strategies.
Competitive Landscape of the Renewable Energy Forecasting Software Market
Companies are implementing various strategies, such as strategic alliances, partnerships, mergers and acquisitions, geographical expansion, and product/service launches, to enhance their presence in the renewable energy forecasting software market industry.
ABB Ltd. - Key offerings focus on AI-driven platforms delivering predictive analytics for renewable energy forecasting, grid optimization, and energy trading to enhance operational efficiency and financial returns.
The industry research and growth report includes detailed analyses of the competitive landscape of the market and information about key companies, including:
- ABB Ltd.
- AccuWeather Inc.
- Clean Power Research L.L.C
- DNV Group AS
- Fulcrum3D Pty Ltd.
- GE Vernova Inc.
- IBM Corp.
- Itron Inc.
- MetDesk Ltd.
- meteocontrol GmbH
- Natural Power
- Reuniwatt
- RM Energy Weather GmbH
- Schneider Electric SE
- Siemens Gamesa Renewable Energy SA
- Solargis
- UL LLC.
- Vaisala Oyj
- Vestas Wind Systems AS
- VORTEX FACTORIA DE CAALCULS S.L.
Qualitative and quantitative analysis of companies has been conducted to help clients understand the wider business environment as well as the strengths and weaknesses of key industry players. Data is qualitatively analyzed to categorize companies as pure play, category-focused, industry-focused, and diversified; it is quantitatively analyzed to categorize companies as dominant, leading, strong, tentative, and weak.
Recent Developments in the Renewable Energy Forecasting Software Market
- In August 2025, a leading global aerospace and imaging corporation launched a specialized atmospheric monitoring service providing sub-five-minute solar irradiance level updates across the Asia-Pacific region, designed for integration into renewable energy management platforms.
- In June 2025, a prominent North American energy developer commissioned a comprehensive software suite for a large-scale solar-plus-storage project, utilizing predictive analytics to determine the optimal timing for energy arbitrage based on forecasted market prices.
- In July 2025, the European Commission introduced revised grid synchronization guidelines that mandate the use of digital predictive tools for all new renewable installations above a specified capacity, aiming to standardize data exchange between power producers and transmission system operators.
- In September 2025, a prominent international technology corporation launched a cloud-native platform that uses generative artificial intelligence to simulate thousands of weather scenarios, enabling more precise assessment of energy yields for offshore wind clusters under extreme conditions.
Research Analyst Overview: Renewable Energy Forecasting Software Market
The renewable energy forecasting software market is rapidly maturing, moving past simple deterministic predictions toward sophisticated probabilistic forecasting. This transition is not merely technological but is increasingly mandated by regulatory bodies, such as the new standard for offshore wind participants adopted in Northern Europe, which requires confidence intervals with production estimates.
Board-level decisions now weigh the total cost of ownership of these advanced systems, evaluating the operational flexibility of cloud subscriptions against the security of on-premise deployments, with power purchase agreements optimization serving as a critical KPI. The enabling technologies, including deep learning neural networks and advanced machine learning algorithms for digital twin modeling, are becoming vendor qualification criteria.
These tools are essential for achieving precise solar irradiance forecasting and wind power prediction, which are fundamental to maintaining grid stability. Consequently, the focus has shifted to asset performance management and ensuring operational technology security in an interconnected environment, reflecting a deeper integration of forecasting into core business strategy.
Dive into Technavio’s robust research methodology, blending expert interviews, extensive data synthesis, and validated models for unparalleled Renewable Energy Forecasting Software Market insights. See full methodology.
| Market Scope | |
|---|---|
| Page number | 306 |
| Base year | 2025 |
| Historic period | 2020-2024 |
| Forecast period | 2026-2030 |
| Growth momentum & CAGR | Accelerate at a CAGR of 10.6% |
| Market growth 2026-2030 | USD 547.1 million |
| Market structure | Fragmented |
| YoY growth 2025-2026(%) | 10.3% |
| Key countries | US, Canada, Mexico, Germany, UK, France, Spain, Italy, The Netherlands, China, Japan, India, Australia, South Korea, Indonesia, Brazil, Argentina, Chile, Saudi Arabia, UAE, South Africa, Israel and Turkey |
| Competitive landscape | Leading Companies, Market Positioning of Companies, Competitive Strategies, and Industry Risks |
Renewable Energy Forecasting Software Market: Key Questions Answered in This Report
-
What is the expected growth of the Renewable Energy Forecasting Software Market between 2026 and 2030?
-
The Renewable Energy Forecasting Software Market is expected to grow by USD 547.1 million during 2026-2030, registering a CAGR of 10.6%. Year-over-year growth in 2026 is estimated at 10.3%%. This acceleration is shaped by increasing integration of variable renewable energy into national grids, which is intensifying demand across multiple end-use verticals covered in the report.
-
-
What segmentation does the market report cover?
-
The report is segmented by Deployment (Cloud based, and On premises), End-user (Grid operators, Independent power producers, Energy traders, and Others), Technology (ML based forecasting, Advanced AI forecasting, and Traditional statistical methods) and Geography (North America, Europe, APAC, South America, Middle East and Africa). Among these, the Cloud based segment is estimated to witness significant growth during the forecast period, driven by rising adoption across key application areas. Each segment includes detailed qualitative and quantitative analysis, along with historical data from 2020-2024 and forecasts through 2030 with year-over-year growth rates.
-
-
Which regions are analyzed in the report?
-
The report covers North America, Europe, APAC, South America and Middle East and Africa. North America is estimated to contribute 35.6% to market growth during the forecast period. Country-level analysis includes US, Canada, Mexico, Germany, UK, France, Spain, Italy, The Netherlands, China, Japan, India, Australia, South Korea, Indonesia, Brazil, Argentina, Chile, Saudi Arabia, UAE, South Africa, Israel and Turkey, with dedicated market size tables and year-over-year growth for each.
-
-
What are the key growth drivers and market challenges?
-
The primary driver is increasing integration of variable renewable energy into national grids, which is accelerating investment and industry demand. The main challenge is data heterogeneity and complexity of system interoperability, creating operational barriers for key market participants. The report quantifies the impact of each driver and challenge across 2026 and 2030 with comparative analysis.
-
-
Who are the major players in the Renewable Energy Forecasting Software Market?
-
Key vendors include ABB Ltd., AccuWeather Inc., Clean Power Research L.L.C, DNV Group AS, Fulcrum3D Pty Ltd., GE Vernova Inc., IBM Corp., Itron Inc., MetDesk Ltd., meteocontrol GmbH, Natural Power, Reuniwatt, RM Energy Weather GmbH, Schneider Electric SE, Siemens Gamesa Renewable Energy SA, Solargis, UL LLC., Vaisala Oyj, Vestas Wind Systems AS and VORTEX FACTORIA DE CAALCULS S.L.. The report provides qualitative and quantitative analysis categorizing companies as dominant, leading, strong, tentative, and weak based on their market positioning. Company profiles include business segment analysis, SWOT assessment, key offerings, and recent strategic developments.
-
Renewable Energy Forecasting Software Market Research Insights
Evolving regulatory compliance reporting mandates, such as new grid interconnection standards, are compelling utilities to adopt more sophisticated analytical tools. This dynamic is reflected in deployment model preferences, where cloud-native forecasting platforms are growing at a faster rate than on-premise solutions due to their superior scalability and support for api interoperability standards.
These platforms are critical for managing distributed energy resources and optimizing day-ahead market bidding strategies. By leveraging long-term climate projections and supporting short-term forecasting accuracy, operators can enhance power generation scheduling and mitigate the financial risks of intermittency.
This shift enables more effective energy portfolio optimization, aligning asset management with the complex demands of modern, decentralized energy production networks and supporting the transition to more resilient grid infrastructures.
We can help! Our analysts can customize this renewable energy forecasting software market research report to meet your requirements.
 RIA -
RIA - 
