Zinc Dust, Powders, And Flakes Market Analysis APAC, Europe, North America, Middle East and Africa, South America - China, US, Germany, Japan, India - Size and Forecast 2024-2028

Zinc Dust, Powders, And Flakes Market Analysis APAC, Europe, North America, Middle East and Africa, South America - China, US, Germany, Japan, India - Size and Forecast 2024-2028

Published: Aug 2024 181 Pages SKU: IRTNTR76424

Market Overview at a Glance

$477.4 Mn
Market Opportunity
4.88%
CAGR
4.57
YoY growth 2023-2024(%)

Zinc Dust, Powders, And Flakes Market Size 2024-2028

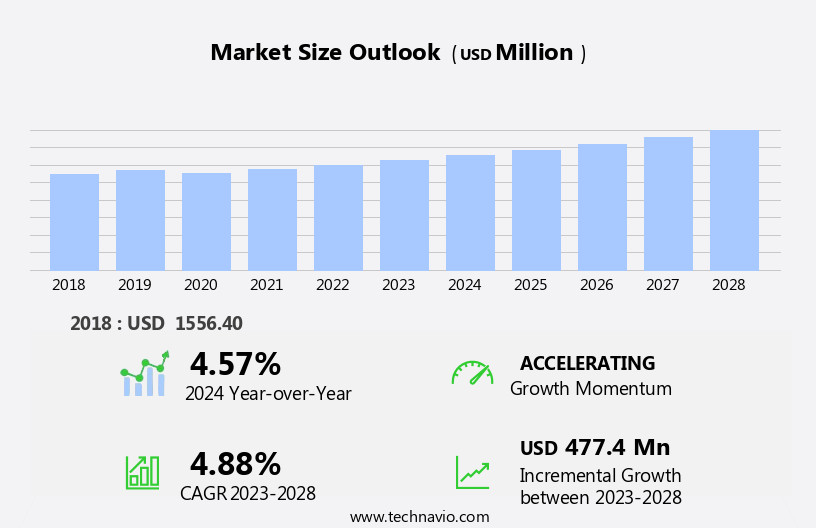
The zinc dust, powders, and flakes market size is forecast to increase by USD 477.4 million at a CAGR of 4.88% between 2023 and 2028.

  • The market is experiencing significant growth, driven primarily by the expansion of the global construction industry. This sector's increasing demand for zinc-based coatings and galvanized steel is fueling the market's momentum. Moreover, developing countries' economic growth and infrastructure development are contributing to increased market opportunities. However, market growth is not without challenges. The volatility in prices of raw materials, such as zinc ore and energy, poses a significant risk to market participants. Producers must navigate these price fluctuations to maintain profitability and competitiveness.
  • Additionally, stringent environmental regulations and increasing focus on sustainable production methods present challenges that companies must address to remain compliant and attractive to customers. To capitalize on market opportunities and navigate challenges effectively, companies must stay informed of industry trends and be agile in their business strategies. By focusing on cost efficiency, sustainability, and innovation, market participants can differentiate themselves and thrive in this dynamic market.

What will be the Size of the Zinc Dust, Powders, And Flakes Market during the forecast period?

Zinc Dust, Powders, And Flakes Market Size

 Request Free Sample

  • The market in the United States is experiencing significant growth due to the rapid industrialization and increased oil exploration activities. The market's sizeable volume is driven by the demand for zinc in various industries, including construction and oil production. In value terms, the zinc dust market holds the largest share, followed by the zinc powder and flakes markets. The export price of zinc dust and powders has been on an upward trend due to increasing demand from international markets. Moreover, the growing emphasis on green initiatives and the shift towards electric vehicles (EVs) is expected to boost the demand for zinc flakes in the battery industry.
  • Data analysis indicates that the import price of zinc and its derivatives has been fluctuating due to supply and demand dynamics. Overall, the market is poised for steady growth in the coming years.

How is this Zinc Dust, Powders, And Flakes Industry segmented?

The zinc dust, powders, and flakes industry research report provides comprehensive data (region-wise segment analysis), with forecasts and estimates in "USD million" for the period 2024-2028, as well as historical data from 2018-2022 for the following segments.
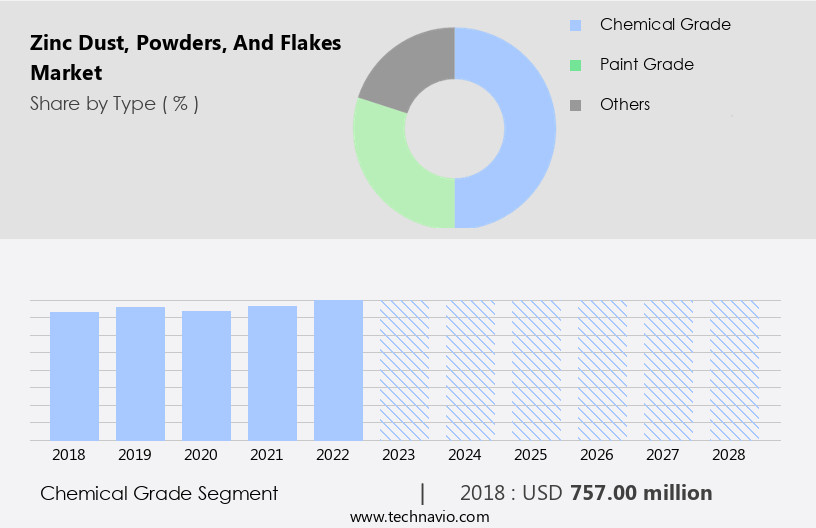
  • Type
    • Chemical grade
    • Paint grade
    • Others
  • Application
    • Chemicals
    • Paint
    • Pharmaceutical
    • Personal care and cosmetics
    • Others
  • Geography
    • APAC
      • China
      • India
      • Japan
    • Europe
      • Germany
    • North America
      • US
    • Middle East and Africa
      • South America

      By Type Insights

      The chemical grade segment is estimated to witness significant growth during the forecast period.

      Zinc dust, powders, and flakes are essential components in numerous chemical reactions, serving various applications in industries such as life sciences, precious metal recovery, and zinc metal production. In the realm of life sciences, these chemicals act as critical reagents for the synthesis of organozinc compounds. Moreover, they play a pivotal role in the recovery of precious metals like gold, silver, and platinum group metals. Additionally, zinc dust, powders, and flakes are integral to the purification process of leach solutions for zinc metal production. Chemical industries leverage these materials in their manufacturing processes to produce zinc stearate, zinc diacrylate, and zinc borate.

      These chemicals subsequently find applications in plastics, rubbers, and flame-retardant materials. The rapid industrialization and increasing green initiatives have fueled the demand for these chemicals in various sectors. Data analysis from reputable s reveals that the import and export prices for zinc dust, powders, and flakes have been fluctuating due to oil and gas exploration activities. The zinc powder market and flakes market have experienced significant growth, driven by the increasing demand for these chemicals in various industries. Analysts predict continued growth in the coming years, making it an attractive investment opportunity for businesses. company analysis indicates that the market is competitive, with several players offering a range of products and services.

      Companies must focus on value terms to differentiate themselves in the market and cater to the evolving needs of their customers. Overall, the market presents a promising landscape for businesses seeking to expand their footprint in the chemical industry.

      Zinc Dust, Powders, And Flakes Market Size

      Get a glance at the market report of share of various segments Request Free Sample

      The Chemical grade segment was valued at USD 757.00 million in 2018 and showed a gradual increase during the forecast period.

      Regional Analysis

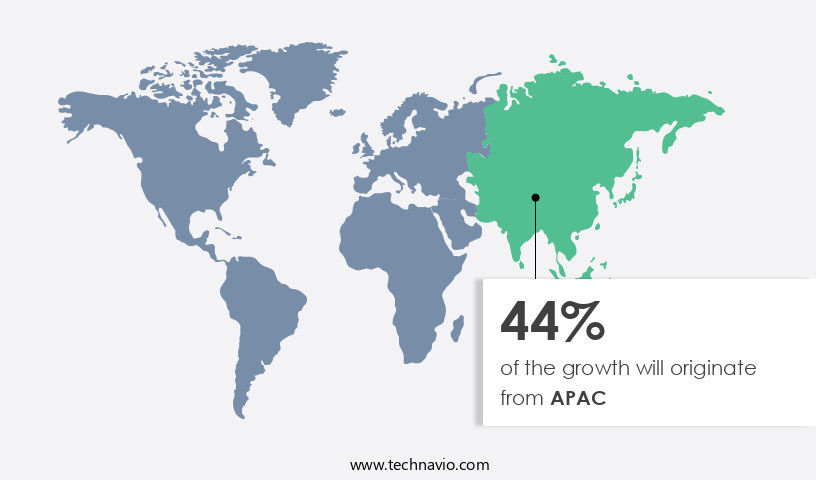
      APAC is estimated to contribute 44% to the growth of the global market during the forecast period.Technavio’s analysts have elaborately explained the regional trends and drivers that shape the market during the forecast period.

      Zinc Dust, Powders, And Flakes Market Share by Geography

      For more insights on the market size of various regions, Request Free Sample

      The market is experiencing significant growth, particularly in the Asia Pacific region. This expansion is primarily driven by the increasing demand from the construction and automotive industries. In the construction sector, zinc dust, powders, and flakes are utilized due to their beneficial properties, including their ability to withstand heavy loads, stress, and high pressure in various climatic conditions, as well as their low maintenance costs. These materials are essential in the construction of various structures such as buildings, pedestrian bridges, highway bridges, and railway bridges. Furthermore, the rapid industrialization and green initiatives in the region are contributing to the market's growth.

      In the oil and gas exploration activities, zinc flakes are used as a weighting agent in drilling mud, while zinc dust and powders are employed in the production of EVS (Electrogalvanized Steel) in the automotive industry. Data analysis reveals that the import and export prices of zinc dust, powders, and flakes have been fluctuating due to various market dynamics. company analysis indicates that the market is competitive, with several players offering these products. This study provides valuable insights into the market, including market size, volume, and trends.

      Market Dynamics

      Our researchers analyzed the data with 2023 as the base year, along with the key drivers, trends, and challenges. A holistic analysis of drivers will help companies refine their marketing strategies to gain a competitive advantage.

      What are the key market drivers leading to the rise in the adoption of Zinc Dust, Powders, And Flakes Industry?

      • Growth of global construction industry is the key driver of the market. 

      • The global construction industry has undergone substantial transformations over the past decade, with developed economies, including the US and the UK, grappling with aging infrastructure. This situation has necessitated an increased focus on maintenance and renovation projects, as well as a shift towards sustainable building development and retrofitting practices. The global economy's overall growth further bolsters the expansion of the construction industry. The market has gained significant traction from this industry's growth, as zinc is a crucial component in various construction applications, including galvanizing and paint additives.
      • The construction sector's transition towards sustainable and energy-efficient practices has led to increased demand for zinc products due to their corrosion-resistant properties. The market is poised for growth, driven by the construction industry's ongoing evolution.

      What are the market trends shaping the Zinc Dust, Powders, And Flakes Industry?

      • Growing demand from developing countries is the upcoming market trend. 

      • The market is experiencing notable expansion in developing economies, particularly China, India, Brazil, Indonesia, and Mexico. This growth is attributed to factors such as the accessibility of raw materials, affordable labor, minimal transportation costs, and lenient mining regulations in these countries. For instance, China, the world's largest producer of zinc, generated approximately 4.2 million metric tons of zinc in 2022. Consequently, it holds the leading position in the global zinc mining industry. Peru and Australia ranked second and third, respectively, with production volumes of around 1.3 million metric tons and 1.1 million metric tons, respectively, in the same year.
      • These countries' strategic advantages enable companies to optimize their operations and cater to the increasing demand for zinc dust, powders, and flakes.

      What challenges does the Zinc Dust, Powders, And Flakes Industry face during its growth?

      • Volatility in prices of raw materials is a key challenge affecting the industry growth. 

      • The market is subject to price volatility in raw materials, particularly zinc, which can negatively affect market growth. Zinc, a primary component in the production of these products, experiences significant price fluctuations. For instance, in April 2023, zinc prices dropped to their lowest levels in over two and a half years, plunging by more than 40% from their peak in April 2022. This sudden decrease in prices, which fell below USD2,500/ton for the first time since October 2020, can lead to increased production costs for market companies. In turn, manufacturers may struggle to absorb these higher costs, potentially decreasing their profit margins.
      • Consequently, price instability in raw materials poses a significant challenge to the growth of the market.

      Exclusive Customer Landscape

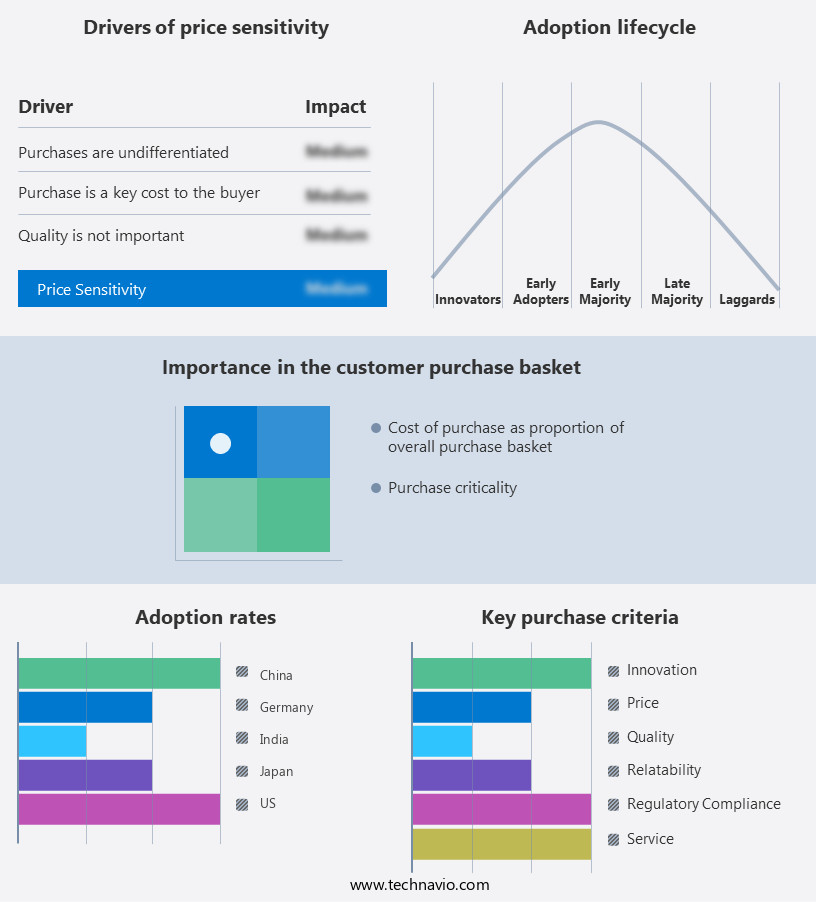
      The zinc dust, powders, and flakes market forecasting report includes the adoption lifecycle of the market, covering from the innovator’s stage to the laggard’s stage. It focuses on adoption rates in different regions based on penetration. Furthermore, the zinc dust, powders, and flakes market report also includes key purchase criteria and drivers of price sensitivity to help companies evaluate and develop their market growth analysis strategies.

      Zinc Dust, Powders, And Flakes Market Share by Geography

       Customer Landscape

      Key Companies & Market Insights

      Companies are implementing various strategies, such as strategic alliances, zinc dust, powders, and flakes market forecast, partnerships, mergers and acquisitions, geographical expansion, and product/service launches, to enhance their presence in the industry.

      Altana AG - Eckart, a subsidiary of our company, supplies zinc dust, powders, and flakes for optimal corrosion protection in powder coating primers. These offerings enhance the durability and longevity of various industries' products, ensuring superior resistance to environmental factors. By integrating zinc-rich coatings, manufacturers can mitigate the risk of rust and oxidation, ultimately improving their customers' satisfaction and trust.

      The industry research and growth report includes detailed analyses of the competitive landscape of the market and information about key companies, including:

      • Altana AG
      • AVL METAL POWDERS n.v.
      • Cynor Laboratories
      • EverZinc Group
      • Hakusui Tech Co. Ltd.
      • Hanchang Ind. Co. Ltd.
      • Innomet Powders
      • Jiangsu Shenlong Zinc Industry Co. Ltd.
      • Loba Chemie Pvt. Ltd.
      • Novamet Specialty Products Corp.
      • Otto Chemie Pvt. Ltd.
      • Pars Zinc Dust Manufacturing Co.
      • PARSHVA CHEMICALS
      • Sarda Industrial Enterprises
      • Shandong Xingyuan Zinc Technology Co. Ltd.
      • Silox India Pvt. Ltd.
      • The Metal Powder Co. Ltd.
      • Thermo Fisher Scientific Inc.
      • Toho Zinc Co. Ltd.
      • Zochem Inc.

      Qualitative and quantitative analysis of companies has been conducted to help clients understand the wider business environment as well as the strengths and weaknesses of key industry players. Data is qualitatively analyzed to categorize companies as pure play, category-focused, industry-focused, and diversified; it is quantitatively analyzed to categorize companies as dominant, leading, strong, tentative, and weak.

      Research Analyst Overview

      The global market for zinc dust, powders, and flakes has experienced significant growth in recent years, driven by the rapid industrialization in various sectors. This trend is expected to continue as green initiatives gain traction and value terms such as sustainability and efficiency become increasingly important. The study of the zinc market encompasses a wide range of applications, including the production of galvanized steel, rubber, paint, and plastics. In the energy sector, zinc flakes are used in the production of batteries, particularly those used in Electric Vehicles (EVs). The market dynamics of zinc dust, powders, and flakes are influenced by several factors.

      One of the primary drivers is the demand from the construction industry, which utilizes zinc in various applications such as roofing and coating. Another significant factor is the price trend of crude oil, as the production of zinc involves the extraction of zinc from zinc blende, which is often found in association with crude oil. The market for zinc dust, powders, and flakes is highly competitive, with numerous companies offering their products. reports suggest that the market is fragmented, with a few large players dominating the market share. The company analysis of the market reveals that these players have a strong presence in multiple regions and offer a broad range of products.

      The import and export prices of zinc dust, powders, and flakes vary significantly depending on the region and the specific application. For instance, the import price of zinc powder is influenced by the cost of transportation and tariffs, while the export price is influenced by the demand and supply dynamics in the destination market. The market for zinc flakes is expected to witness growth due to the increasing demand from the battery industry, particularly for EV batteries. The growth of oil and gas exploration activities is also expected to drive the demand for zinc flakes, as they are used in the drilling process.

      Data analysis of the market reveals that the volume of zinc dust, powders, and flakes consumed is increasing at a steady pace. Analysts attribute this growth to the expanding applications of zinc in various industries and the increasing demand for sustainable and efficient solutions. In , the market for zinc dust, powders, and flakes is a dynamic and growing market, driven by the demand from various industries and the increasing importance of sustainability and efficiency. The market is highly competitive, with several companies offering their products, and the price trend of crude oil is a significant factor influencing the market dynamics.

      The demand for zinc flakes is expected to witness growth due to the increasing demand from the battery industry and oil and gas exploration activities.

      Market Scope

      Report Coverage

      Details

      Page number

      181

      Base year

      2023

      Historic period

      2018-2022

      Forecast period

      2024-2028

      Growth momentum & CAGR

      Accelerate at a CAGR of 4.88%

      Market growth 2024-2028

      USD 477.4 million

      Market structure

      Fragmented

      YoY growth 2023-2024(%)

      4.57

      Key countries

      China, US, Germany, Japan, and India

      Competitive landscape

      Leading Companies, Market Positioning of Companies, Competitive Strategies, and Industry Risks

      Request Free Sample

      What are the Key Data Covered in this Zinc Dust, Powders, And Flakes Market Research and Growth Report?

      • CAGR of the Zinc Dust, Powders, And Flakes industry during the forecast period
      • Detailed information on factors that will drive the growth and forecasting between 2024 and 2028
      • Precise estimation of the size of the market and its contribution of the industry in focus to the parent market
      • Accurate predictions about upcoming growth and trends and changes in consumer behaviour
      • Growth of the market across APAC, Europe, North America, Middle East and Africa, and South America
      • Thorough analysis of the market’s competitive landscape and detailed information about companies
      • Comprehensive analysis of factors that will challenge the zinc dust, powders, and flakes market growth of industry companies

      We can help! Our analysts can customize this zinc dust, powders, and flakes market research report to meet your requirements.

      Get in touch


      1 Executive Summary

      • 1.1 Market overview
        • Executive Summary - Chart on Market Overview
        • Executive Summary - Data Table on Market Overview
        • Executive Summary - Chart on Global Market Characteristics
        • Executive Summary - Chart on Market by Geography
        • Executive Summary - Chart on Market Segmentation by Type
        • Executive Summary - Chart on Market Segmentation by Application
        • Executive Summary - Chart on Incremental Growth
        • Executive Summary - Data Table on Incremental Growth
        • Executive Summary - Chart on Company Market Positioning

      2 Market Landscape

      • 2.1 Market ecosystem
        • Parent Market
        • Data Table on - Parent Market
      • 2.2 Market characteristics
        • Market characteristics analysis
      • 2.3 Value chain analysis
        • Value Chain Analysis

      3 Market Sizing

      • 3.1 Market definition
        • Offerings of companies included in the market definition
      • 3.2 Market segment analysis
        • Market segments
      • 3.3 Market size 2023
        • 3.4 Market outlook: Forecast for 2023-2028
          • Chart on Global - Market size and forecast 2023-2028 ($ million)
          • Data Table on Global - Market size and forecast 2023-2028 ($ million)
          • Chart on Global Market: Year-over-year growth 2023-2028 (%)
          • Data Table on Global Market: Year-over-year growth 2023-2028 (%)

        4 Historic Market Size

        • 4.1 Global Zinc Dust, Powders, And Flakes Market 2018 - 2022
          • Historic Market Size - Data Table on Global Zinc Dust, Powders, And Flakes Market 2018 - 2022 ($ million)
        • 4.2 Type segment analysis 2018 - 2022
          • Historic Market Size - Type Segment 2018 - 2022 ($ million)
        • 4.3 Application segment analysis 2018 - 2022
          • Historic Market Size - Application Segment 2018 - 2022 ($ million)
        • 4.4 Geography segment analysis 2018 - 2022
          • Historic Market Size - Geography Segment 2018 - 2022 ($ million)
        • 4.5 Country segment analysis 2018 - 2022
          • Historic Market Size - Country Segment 2018 - 2022 ($ million)

        5 Five Forces Analysis

        • 5.1 Five forces summary
          • Five forces analysis - Comparison between 2023 and 2028
        • 5.2 Bargaining power of buyers
          • Bargaining power of buyers - Impact of key factors 2023 and 2028
        • 5.3 Bargaining power of suppliers
          • Bargaining power of suppliers - Impact of key factors in 2023 and 2028
        • 5.4 Threat of new entrants
          • Threat of new entrants - Impact of key factors in 2023 and 2028
        • 5.5 Threat of substitutes
          • Threat of substitutes - Impact of key factors in 2023 and 2028
        • 5.6 Threat of rivalry
          • Threat of rivalry - Impact of key factors in 2023 and 2028
        • 5.7 Market condition
          • Chart on Market condition - Five forces 2023 and 2028

        6 Market Segmentation by Type

        • 6.1 Market segments
          • Chart on Type - Market share 2023-2028 (%)
          • Data Table on Type - Market share 2023-2028 (%)
        • 6.2 Comparison by Type
          • Chart on Comparison by Type
          • Data Table on Comparison by Type
        • 6.3 Chemical grade - Market size and forecast 2023-2028
          • Chart on Chemical grade - Market size and forecast 2023-2028 ($ million)
          • Data Table on Chemical grade - Market size and forecast 2023-2028 ($ million)
          • Chart on Chemical grade - Year-over-year growth 2023-2028 (%)
          • Data Table on Chemical grade - Year-over-year growth 2023-2028 (%)
        • 6.4 Paint grade - Market size and forecast 2023-2028
          • Chart on Paint grade - Market size and forecast 2023-2028 ($ million)
          • Data Table on Paint grade - Market size and forecast 2023-2028 ($ million)
          • Chart on Paint grade - Year-over-year growth 2023-2028 (%)
          • Data Table on Paint grade - Year-over-year growth 2023-2028 (%)
        • 6.5 Others - Market size and forecast 2023-2028
          • Chart on Others - Market size and forecast 2023-2028 ($ million)
          • Data Table on Others - Market size and forecast 2023-2028 ($ million)
          • Chart on Others - Year-over-year growth 2023-2028 (%)
          • Data Table on Others - Year-over-year growth 2023-2028 (%)
        • 6.6 Market opportunity by Type
          • Market opportunity by Type ($ million)
          • Data Table on Market opportunity by Type ($ million)

        7 Market Segmentation by Application

        • 7.1 Market segments
          • Chart on Application - Market share 2023-2028 (%)
          • Data Table on Application - Market share 2023-2028 (%)
        • 7.2 Comparison by Application
          • Chart on Comparison by Application
          • Data Table on Comparison by Application
        • 7.3 Chemicals - Market size and forecast 2023-2028
          • Chart on Chemicals - Market size and forecast 2023-2028 ($ million)
          • Data Table on Chemicals - Market size and forecast 2023-2028 ($ million)
          • Chart on Chemicals - Year-over-year growth 2023-2028 (%)
          • Data Table on Chemicals - Year-over-year growth 2023-2028 (%)
        • 7.4 Paint - Market size and forecast 2023-2028
          • Chart on Paint - Market size and forecast 2023-2028 ($ million)
          • Data Table on Paint - Market size and forecast 2023-2028 ($ million)
          • Chart on Paint - Year-over-year growth 2023-2028 (%)
          • Data Table on Paint - Year-over-year growth 2023-2028 (%)
        • 7.5 Pharmaceutical - Market size and forecast 2023-2028
          • Chart on Pharmaceutical - Market size and forecast 2023-2028 ($ million)
          • Data Table on Pharmaceutical - Market size and forecast 2023-2028 ($ million)
          • Chart on Pharmaceutical - Year-over-year growth 2023-2028 (%)
          • Data Table on Pharmaceutical - Year-over-year growth 2023-2028 (%)
        • 7.6 Personal care and cosmetics - Market size and forecast 2023-2028
          • Chart on Personal care and cosmetics - Market size and forecast 2023-2028 ($ million)
          • Data Table on Personal care and cosmetics - Market size and forecast 2023-2028 ($ million)
          • Chart on Personal care and cosmetics - Year-over-year growth 2023-2028 (%)
          • Data Table on Personal care and cosmetics - Year-over-year growth 2023-2028 (%)
        • 7.7 Others - Market size and forecast 2023-2028
          • Chart on Others - Market size and forecast 2023-2028 ($ million)
          • Data Table on Others - Market size and forecast 2023-2028 ($ million)
          • Chart on Others - Year-over-year growth 2023-2028 (%)
          • Data Table on Others - Year-over-year growth 2023-2028 (%)
        • 7.8 Market opportunity by Application
          • Market opportunity by Application ($ million)
          • Data Table on Market opportunity by Application ($ million)

        8 Customer Landscape

        • 8.1 Customer landscape overview
          • Analysis of price sensitivity, lifecycle, customer purchase basket, adoption rates, and purchase criteria

        9 Geographic Landscape

        • 9.1 Geographic segmentation
          • Chart on Market share by geography 2023-2028 (%)
          • Data Table on Market share by geography 2023-2028 (%)
        • 9.2 Geographic comparison
          • Chart on Geographic comparison
          • Data Table on Geographic comparison
        • 9.3 APAC - Market size and forecast 2023-2028
          • Chart on APAC - Market size and forecast 2023-2028 ($ million)
          • Data Table on APAC - Market size and forecast 2023-2028 ($ million)
          • Chart on APAC - Year-over-year growth 2023-2028 (%)
          • Data Table on APAC - Year-over-year growth 2023-2028 (%)
        • 9.4 Europe - Market size and forecast 2023-2028
          • Chart on Europe - Market size and forecast 2023-2028 ($ million)
          • Data Table on Europe - Market size and forecast 2023-2028 ($ million)
          • Chart on Europe - Year-over-year growth 2023-2028 (%)
          • Data Table on Europe - Year-over-year growth 2023-2028 (%)
        • 9.5 North America - Market size and forecast 2023-2028
          • Chart on North America - Market size and forecast 2023-2028 ($ million)
          • Data Table on North America - Market size and forecast 2023-2028 ($ million)
          • Chart on North America - Year-over-year growth 2023-2028 (%)
          • Data Table on North America - Year-over-year growth 2023-2028 (%)
        • 9.6 Middle East and Africa - Market size and forecast 2023-2028
          • Chart on Middle East and Africa - Market size and forecast 2023-2028 ($ million)
          • Data Table on Middle East and Africa - Market size and forecast 2023-2028 ($ million)
          • Chart on Middle East and Africa - Year-over-year growth 2023-2028 (%)
          • Data Table on Middle East and Africa - Year-over-year growth 2023-2028 (%)
        • 9.7 South America - Market size and forecast 2023-2028
          • Chart on South America - Market size and forecast 2023-2028 ($ million)
          • Data Table on South America - Market size and forecast 2023-2028 ($ million)
          • Chart on South America - Year-over-year growth 2023-2028 (%)
          • Data Table on South America - Year-over-year growth 2023-2028 (%)
        • 9.8 China - Market size and forecast 2023-2028
          • Chart on China - Market size and forecast 2023-2028 ($ million)
          • Data Table on China - Market size and forecast 2023-2028 ($ million)
          • Chart on China - Year-over-year growth 2023-2028 (%)
          • Data Table on China - Year-over-year growth 2023-2028 (%)
        • 9.9 US - Market size and forecast 2023-2028
          • Chart on US - Market size and forecast 2023-2028 ($ million)
          • Data Table on US - Market size and forecast 2023-2028 ($ million)
          • Chart on US - Year-over-year growth 2023-2028 (%)
          • Data Table on US - Year-over-year growth 2023-2028 (%)
        • 9.10 Germany - Market size and forecast 2023-2028
          • Chart on Germany - Market size and forecast 2023-2028 ($ million)
          • Data Table on Germany - Market size and forecast 2023-2028 ($ million)
          • Chart on Germany - Year-over-year growth 2023-2028 (%)
          • Data Table on Germany - Year-over-year growth 2023-2028 (%)
        • 9.11 Japan - Market size and forecast 2023-2028
          • Chart on Japan - Market size and forecast 2023-2028 ($ million)
          • Data Table on Japan - Market size and forecast 2023-2028 ($ million)
          • Chart on Japan - Year-over-year growth 2023-2028 (%)
          • Data Table on Japan - Year-over-year growth 2023-2028 (%)
        • 9.12 India - Market size and forecast 2023-2028
          • Chart on India - Market size and forecast 2023-2028 ($ million)
          • Data Table on India - Market size and forecast 2023-2028 ($ million)
          • Chart on India - Year-over-year growth 2023-2028 (%)
          • Data Table on India - Year-over-year growth 2023-2028 (%)
        • 9.13 Market opportunity by geography
          • Market opportunity by geography ($ million)
          • Data Tables on Market opportunity by geography ($ million)

        10 Drivers, Challenges, and Opportunity/Restraints

        • 10.1 Market drivers
          • 10.2 Market challenges
            • 10.3 Impact of drivers and challenges
              • Impact of drivers and challenges in 2023 and 2028
            • 10.4 Market opportunities/restraints

              11 Competitive Landscape

              • 11.1 Overview
                • 11.2 Competitive Landscape
                  • Overview on criticality of inputs and factors of differentiation
                • 11.3 Landscape disruption
                  • Overview on factors of disruption
                • 11.4 Industry risks
                  • Impact of key risks on business

                12 Competitive Analysis

                • 12.1 Companies profiled
                  • Companies covered
                • 12.2 Market positioning of companies
                  • Matrix on companies position and classification
                • 12.3 Altana AG
                  • Altana AG - Overview
                  • Altana AG - Product / Service
                  • Altana AG - Key news
                  • Altana AG - Key offerings
                • 12.4 AVL METAL POWDERS n.v.
                  • AVL METAL POWDERS n.v. - Overview
                  • AVL METAL POWDERS n.v. - Product / Service
                  • AVL METAL POWDERS n.v. - Key offerings
                • 12.5 EverZinc Group
                  • EverZinc Group - Overview
                  • EverZinc Group - Product / Service
                  • EverZinc Group - Key offerings
                • 12.6 Hanchang Ind. Co. Ltd.
                  • Hanchang Ind. Co. Ltd. - Overview
                  • Hanchang Ind. Co. Ltd. - Product / Service
                  • Hanchang Ind. Co. Ltd. - Key offerings
                • 12.7 Jiangsu Shenlong Zinc Industry Co. Ltd.
                  • Jiangsu Shenlong Zinc Industry Co. Ltd. - Overview
                  • Jiangsu Shenlong Zinc Industry Co. Ltd. - Product / Service
                  • Jiangsu Shenlong Zinc Industry Co. Ltd. - Key offerings
                • 12.8 Loba Chemie Pvt. Ltd.
                  • Loba Chemie Pvt. Ltd. - Overview
                  • Loba Chemie Pvt. Ltd. - Product / Service
                  • Loba Chemie Pvt. Ltd. - Key offerings
                • 12.9 Novamet Specialty Products Corp.
                  • Novamet Specialty Products Corp. - Overview
                  • Novamet Specialty Products Corp. - Product / Service
                  • Novamet Specialty Products Corp. - Key offerings
                • 12.10 Otto Chemie Pvt. Ltd.
                  • Otto Chemie Pvt. Ltd. - Overview
                  • Otto Chemie Pvt. Ltd. - Product / Service
                  • Otto Chemie Pvt. Ltd. - Key offerings
                • 12.11 PARSHVA CHEMICALS
                  • PARSHVA CHEMICALS - Overview
                  • PARSHVA CHEMICALS - Product / Service
                  • PARSHVA CHEMICALS - Key offerings
                • 12.12 Shandong Xingyuan Zinc Technology Co. Ltd.
                  • Shandong Xingyuan Zinc Technology Co. Ltd. - Overview
                  • Shandong Xingyuan Zinc Technology Co. Ltd. - Product / Service
                  • Shandong Xingyuan Zinc Technology Co. Ltd. - Key offerings
                • 12.13 Silox India Pvt. Ltd.
                  • Silox India Pvt. Ltd. - Overview
                  • Silox India Pvt. Ltd. - Product / Service
                  • Silox India Pvt. Ltd. - Key offerings
                • 12.14 The Metal Powder Co. Ltd.
                  • The Metal Powder Co. Ltd. - Overview
                  • The Metal Powder Co. Ltd. - Product / Service
                  • The Metal Powder Co. Ltd. - Key offerings
                • 12.15 Thermo Fisher Scientific Inc.
                  • Thermo Fisher Scientific Inc. - Overview
                  • Thermo Fisher Scientific Inc. - Business segments
                  • Thermo Fisher Scientific Inc. - Key news
                  • Thermo Fisher Scientific Inc. - Key offerings
                  • Thermo Fisher Scientific Inc. - Segment focus
                • 12.16 Toho Zinc Co. Ltd.
                  • Toho Zinc Co. Ltd. - Overview
                  • Toho Zinc Co. Ltd. - Business segments
                  • Toho Zinc Co. Ltd. - Key offerings
                  • Toho Zinc Co. Ltd. - Segment focus
                • 12.17 Zochem Inc.
                  • Zochem Inc. - Overview
                  • Zochem Inc. - Product / Service
                  • Zochem Inc. - Key offerings

                13 Appendix

                • 13.1 Scope of the report
                  • 13.2 Inclusions and exclusions checklist
                    • Inclusions checklist
                    • Exclusions checklist
                  • 13.3 Currency conversion rates for US$
                    • Currency conversion rates for US$
                  • 13.4 Research methodology
                    • Research methodology
                  • 13.5 Data procurement
                    • Information sources
                  • 13.6 Data validation
                    • Data validation
                  • 13.7 Validation techniques employed for market sizing
                    • Validation techniques employed for market sizing
                  • 13.8 Data synthesis
                    • Data synthesis
                  • 13.9 360 degree market analysis
                    • 360 degree market analysis
                  • 13.10 List of abbreviations
                    • List of abbreviations

                  Research Methodology

                  Technavio presents a detailed picture of the market by way of study, synthesis, and summation of data from multiple sources. The analysts have presented the various facets of the market with a particular focus on identifying the key industry influencers. The data thus presented is comprehensive, reliable, and the result of extensive research, both primary and secondary.

                  INFORMATION SOURCES

                  Primary sources

                  • Manufacturers and suppliers
                  • Channel partners
                  • Industry experts
                  • Strategic decision makers

                  Secondary sources

                  • Industry journals and periodicals
                  • Government data
                  • Financial reports of key industry players
                  • Historical data
                  • Press releases

                  DATA ANALYSIS

                  Data Synthesis

                  • Collation of data
                  • Estimation of key figures
                  • Analysis of derived insights

                  Data Validation

                  • Triangulation with data models
                  • Reference against proprietary databases
                  • Corroboration with industry experts

                  REPORT WRITING

                  Qualitative

                  • Market drivers
                  • Market challenges
                  • Market trends
                  • Five forces analysis

                  Quantitative

                  • Market size and forecast
                  • Market segmentation
                  • Geographical insights
                  • Competitive landscape

                  Interested in this report?

                  Get your sample now to see our research methodology and insights!

                  Download Now

                  Frequently Asked Questions

                  Zinc Dust, Powders, And Flakes market growth will increase by $ 477.4 mn during 2024-2028 .

                  The Zinc Dust, Powders, And Flakes market is expected to grow at a CAGR of 4.88% during 2024-2028 .

                  Zinc Dust, Powders, And Flakes market is segmented by Type( Chemical grade, Paint grade, Others) Application( Chemicals, Paint, Pharmaceutical, Personal care and cosmetics, Others)

                  Altana AG, AVL METAL POWDERS n.v., Cynor Laboratories, EverZinc Group, Hakusui Tech Co. Ltd., Hanchang Ind. Co. Ltd., Innomet Powders, Jiangsu Shenlong Zinc Industry Co. Ltd., Loba Chemie Pvt. Ltd., Novamet Specialty Products Corp., Otto Chemie Pvt. Ltd., Pars Zinc Dust Manufacturing Co., PARSHVA CHEMICALS, Sarda Industrial Enterprises, Shandong Xingyuan Zinc Technology Co. Ltd., Silox India Pvt. Ltd., The Metal Powder Co. Ltd., Thermo Fisher Scientific Inc., Toho Zinc Co. Ltd., Zochem Inc. are a few of the key vendors in the Zinc Dust, Powders, And Flakes market.

                  APAC will register the highest growth rate of 44% among the other regions. Therefore, the Zinc Dust, Powders, And Flakes market in APAC is expected to garner significant business opportunities for the vendors during the forecast period.

                  China, US, Germany, Japan, India

                  • Growth of global construction industryThe global construction industry has experienced drastic changes in the past decade. Developed economies such as the US and the UK are currently facing the problem of aging infrastructure. Maintenance and renovation operations is the driving factor this market.
                  • along with a shift to sustainable building development and retrofitting practices is the driving factor this market.
                  • are driving the construction market in these countries. Also is the driving factor this market.
                  • developments related to green and sustainable buildings have led to significant investments and technological innovations. The overall growth of the global economy is supporting the growth of the global construction industry. The global construction industry has provided huge opportunities for the global zinc dust is the driving factor this market.
                  • powders is the driving factor this market.
                  • and flakes market. The increase in government spending is the driving factor this market.
                  • population is the driving factor this market.
                  • per capita income is the driving factor this market.
                  • and economic growth across developing countries has contributed to the growth of the market in focus. With the growing demand for the construction of new residential and commercial buildings is the driving factor this market.
                  • the demand for zinc dust is the driving factor this market.
                  • powders is the driving factor this market.
                  • and flakes will increase worldwide. Low-interest rates on home loans and the development of the global economic environment is the driving factor this market.
                  • along with the increased direct investments by institutional investors is the driving factor this market.
                  • are the factors driving the growth of the real estate industry worldwide. The governments of various countries is the driving factor this market.
                  • such as India is the driving factor this market.
                  • Saudi Arabia is the driving factor this market.
                  • and Qatar is the driving factor this market.
                  • are investing heavily in the development of smart cities. Smart cities provide better transportation facilities is the driving factor this market.
                  • smart grids is the driving factor this market.
                  • improved healthcare facilities is the driving factor this market.
                  • advanced technologies is the driving factor this market.
                  • and enhanced traffic management systems. For example is the driving factor this market.
                  • the Government of Saudi Arabia is planning to invest in the development of the King Abdullah Economic City is the driving factor this market.
                  • which is a smart city. The total project cost is estimated to be $90 billion. Thus is the driving factor this market.
                  • growth in construction activities directly translates into increased demand for materials that ensure corrosion resistance is the driving factor this market.
                  • such as zinc dust is the driving factor this market.
                  • powders is the driving factor this market.
                  • and flakes. Zinc dust is the driving factor this market.
                  • powders is the driving factor this market.
                  • and flakes are widely used in construction applications due to their exceptional corrosion resistance is the driving factor this market.
                  • durability is the driving factor this market.
                  • and aesthetic appeal. The need to protect metal structures and components from corrosion and extend their lifespan is the driving factor this market.
                  • along with the focus on sustainable construction practices is the driving factor this market.
                  • is driving the demand for zinc dust is the driving factor this market.
                  • powders is the driving factor this market.
                  • and flakes and is the driving factor this market.
                  • in turn is the driving factor this market.
                  • will boost the growth of the market in focus during the forecast period. is the driving factor this market.

                  The Zinc Dust, Powders, And Flakes market vendors should focus on grabbing business opportunities from the Chemical grade segment as it accounted for the largest market share in the base year.