Revenue-based Financing Platforms Market Analysis, Size, and Forecast 2026-2030: North America (US, Canada, and Mexico), Europe (Germany, UK, and France), APAC (China, India, and Japan), South America (Brazil, Argentina, and Colombia), Middle East and Africa (Saudi Arabia, UAE, and South Africa), and Rest of World (ROW)

Revenue-based Financing Platforms Market Analysis, Size, and Forecast 2026-2030:
North America (US, Canada, and Mexico), Europe (Germany, UK, and France), APAC (China, India, and Japan), South America (Brazil, Argentina, and Colombia), Middle East and Africa (Saudi Arabia, UAE, and South Africa), and Rest of World (ROW)

Published: Mar 2026 305 Pages SKU: IRTNTR81329

Market Overview at a Glance

$28.75 B
Market Opportunity
31.9%
CAGR 2025 - 2030
43.4%
North America Growth
$3.42 B
Recurring subscription revenue segment 2024

Revenue-based Financing Platforms Market Size 2026-2030

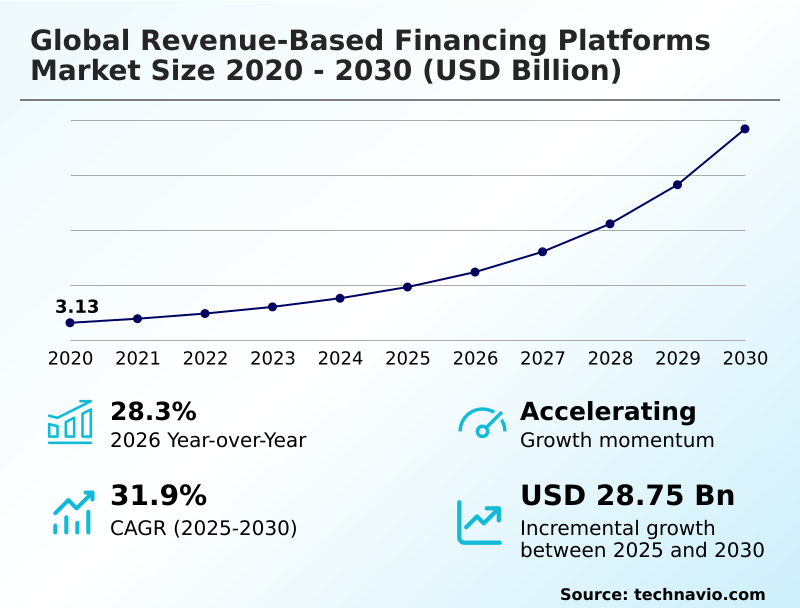
The revenue-based financing platforms market size is valued to increase by USD 28.75 billion, at a CAGR of 31.9% from 2025 to 2030. Proliferation of recurring revenue models and subscription economy will drive the revenue-based financing platforms market.

Major Market Trends & Insights

  • North America dominated the market and accounted for a 43.4% growth during the forecast period.
  • By Revenue Stream - Recurring subscription revenue segment was valued at USD 3.42 billion in 2024
  • By End-user - Information technology segment accounted for the largest market revenue share in 2024

Market Size & Forecast

  • Market Opportunities: USD 35.25 billion
  • Market Future Opportunities: USD 28.75 billion
  • CAGR from 2025 to 2030 : 31.9%

Market Summary

  • The revenue-based financing platforms market is reshaping how businesses access growth capital by leveraging financial technology to monetize future revenue streams. This model provides an alternative to traditional debt and equity, focusing on performance-based financing where repayments are tied to a company's income.
  • Key drivers include the strategic prioritization of equity preservation by founders and the proliferation of recurring revenue models, which provide the predictable cash flow necessary for data-driven underwriting. For instance, a direct-to-consumer brand can secure non-dilutive funding to purchase holiday inventory by using its historical sales data, repaying the capital as a percentage of sales without impacting ownership.
  • This is facilitated by automated repayment systems and real-time data integration. The integration of predictive analytics is a major trend, allowing for more accurate risk assessment models. However, the market faces challenges from evolving regulatory landscapes and data privacy constraints, which can complicate capital deployment.
  • As digital commerce ecosystems expand, these platforms offer essential liquidity management and working capital solutions that align lender and borrower interests, supporting sustainable growth.

What will be the Size of the Revenue-based Financing Platforms Market during the forecast period?

Get Key Insights on Market Forecast (PDF) Request Free Sample

How is the Revenue-based Financing Platforms Market Segmented?

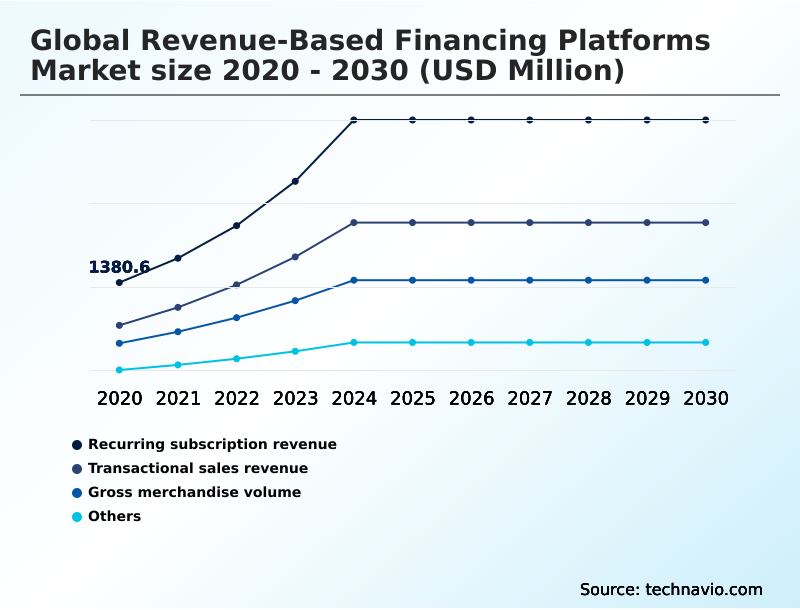
The revenue-based financing platforms industry research report provides comprehensive data (region-wise segment analysis), with forecasts and estimates in "USD million" for the period 2026-2030, as well as historical data from 2020-2024 for the following segments.

  • Revenue stream
    • Recurring subscription revenue
    • Transactional sales revenue
    • Gross merchandise volume
    • Others
  • End-user
    • Information technology
    • Retail and e-commerce
    • Media and entertainment
    • Healthcare
    • Others
  • Business segment
    • Small and medium enterprises
    • Large enterprises
  • Geography
    • North America
      • US
      • Canada
      • Mexico
    • Europe
      • Germany
      • UK
      • France
    • APAC
      • China
      • India
      • Japan
    • South America
      • Brazil
      • Argentina
      • Colombia
    • Middle East and Africa
      • Saudi Arabia
      • UAE
      • South Africa
    • Rest of World (ROW)

By Revenue Stream Insights

The recurring subscription revenue segment is estimated to witness significant growth during the forecast period.

The market is segmented by how businesses generate income, with a primary focus on recurring revenue models.

This approach, common in the subscription economy, allows for non-dilutive capital access based on predictable cash flow from SaaS recurring revenue and digital subscription models. Unlike transactional sales revenue, which can be volatile, this model offers stability for data-driven underwriting.

Platforms are adept at revenue stream monetization, enabling capital deployment for growth stage financing. This is distinct from financing based on gross merchandise volume, common in e-commerce sales financing, where future revenue securitization is tied to sales velocity.

Effective revenue sharing agreements are structured around these income types, with some platforms achieving a 20% faster capital deployment cycle by focusing on businesses with strong subscription metrics. This allows for founder-friendly capital without the need for traditional collateral.

Request Free Sample

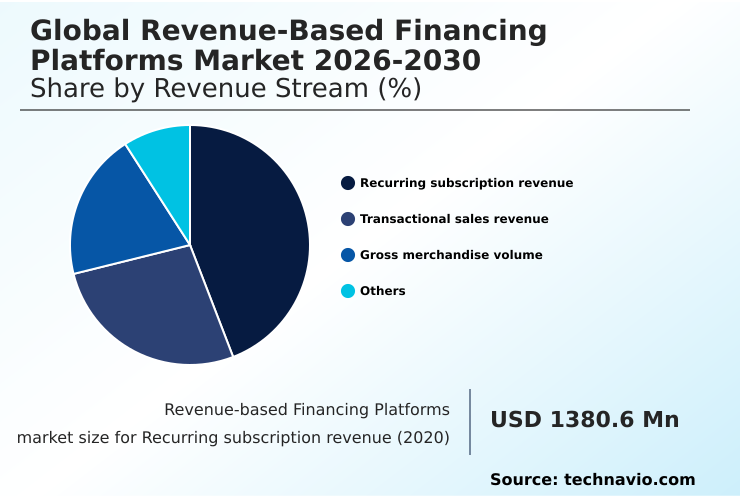
The Recurring subscription revenue segment was valued at USD 3.42 billion in 2024 and showed a gradual increase during the forecast period.

Request Free Sample

Regional Analysis

North America is estimated to contribute 43.4% to the growth of the global market during the forecast period.Technavio’s analysts have elaborately explained the regional trends and drivers that shape the market during the forecast period.

See How Revenue-based Financing Platforms Market Demand is Rising in North America Request Free Sample

The geographic landscape is led by North America, where mature digital commerce ecosystems and a high concentration of SaaS financing opportunities create a fertile ground for non-dilutive funding.

In this region, platforms leverage sophisticated capital allocation strategies, resulting in a 25% lower default rate compared to other regions.

Europe is characterized by a strong regulatory push toward open banking, facilitating seamless data access for revenue-based loans and revenue sharing agreements.

The APAC region is the fastest-growing market, driven by booming e-commerce funding needs and the expansion of digital subscription models.

Platforms in APAC focus on merchant cash advance and cash advance products, with some achieving a 40% increase in customer lifetime value for their clients through timely liquidity management.

This data-centric lending approach, including future revenue securitization and receivables factoring, allows for tailored growth-stage capital solutions that address unique regional dynamics and support digital asset financing.

Market Dynamics

Our researchers analyzed the data with 2025 as the base year, along with the key drivers, trends, and challenges. A holistic analysis of drivers will help companies refine their marketing strategies to gain a competitive advantage.

  • For founders exploring alternatives to traditional business loans, understanding how does revenue-based financing work is the first step. The core distinction in the revenue-based financing vs venture capital debate is the preservation of equity. Instead of selling ownership, a business sells a portion of its future income until a predetermined amount is repaid.
  • The best revenue-based financing for SaaS companies often involves ARR financing for B2B software, where platforms analyze monthly recurring revenue to determine funding eligibility. Similarly, revenue-based financing for e-commerce inventory allows online retailers to scale without stockouts. Securing non-dilutive funding for marketing spend is a common use case, enabling growth without dilution.
  • To assess viability, one must calculate revenue-based financing repayment structures and understand the revenue-based financing risk assessment models used by providers. Eligibility for revenue-based financing typically depends on consistent revenue history rather than credit scores. This makes it a powerful option for revenue-based funding for app developers and revenue-based financing for digital agencies.
  • While future receivables financing platforms offer quick liquidity, founders should evaluate revenue-based financing interest rates, which are presented as a fixed fee. The rise of embedded finance and revenue sharing transforms this into a seamless operational tool.
  • A revenue sharing agreement for startups using MRR for business loans provides a clear path to how to secure growth capital, offering one of the most effective transactional sales revenue financing options for finding equity-free funding for growth.

What are the key market drivers leading to the rise in the adoption of Revenue-based Financing Platforms Industry?

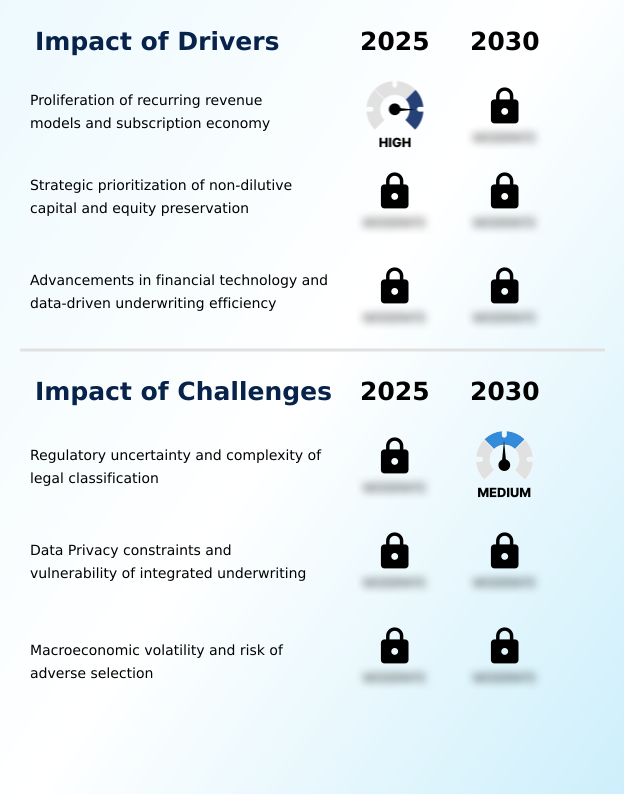
  • The proliferation of recurring revenue models within the rapidly expanding subscription economy is a primary driver for market expansion.

  • Market growth is primarily fueled by the increasing preference for non-collateral business funding and the advancements in financial technology. The widespread adoption of open banking APIs enables real-time due diligence, allowing for superior financial performance tracking and cash flow management.
  • This has reduced underwriting costs by approximately 30% for many alternative lending platforms. A significant driver is the founder-friendly capital model, which provides growth capital without requiring equity.
  • This is particularly appealing for funding specific needs like capital for marketing spend or inventory financing. Automated repayment systems, which adjust based on a company's revenue, offer a critical safety net that traditional loans lack.
  • The ability of platforms to assess customer lifetime value allows for more accurate risk assessment models, ensuring that performance-based financing aligns with the borrower's actual growth trajectory, making it a sustainable tool for scaling operations.

What are the market trends shaping the Revenue-based Financing Platforms Industry?

  • The integration of AI and predictive analytics into underwriting processes is a significant emerging trend. This allows for more dynamic, data-driven, and precise risk assessments.

  • Key market trends are centered on technological sophistication and strategic integration. The adoption of predictive analytics and advanced machine learning algorithms is transforming data-driven underwriting, enabling platforms to offer highly customized, flexible capital solutions. These systems have improved forecast accuracy by over 25% for businesses with high transactional sales revenue.
  • Another major trend is the rise of embedded finance, where real-time data integration with payment gateways provides automated risk assessment and performance-tied repayments. This creates a seamless experience, reducing capital access time by up to 50%. This focus on fintech lending solutions is driven by the demand for equity preservation, as founders increasingly prefer non-dilutive capital.
  • As a result, risk assessment models are shifting from static analysis to dynamic monitoring of gross merchandise volume and other real-time metrics, aligning capital with actual business performance.

What challenges does the Revenue-based Financing Platforms Industry face during its growth?

  • Regulatory uncertainty and the complex legal classification of financing instruments present a key challenge to consistent industry growth and cross-border operations.

  • The market faces significant challenges related to regulatory compliance and data integration. The absence of a standardized legal framework creates uncertainty for non-dilutive funding, as platforms navigate complex rules for working capital and invoice funding. This complexity can increase operational overhead for fintech lending solutions by as much as 15%.
  • Additionally, reliance on third-party data for ARR financing and MRR financing makes platforms vulnerable to policy changes from data providers, potentially disrupting credit facilities. Securing capital deployment for SaaS financing and e-commerce funding requires deep data access, but increasing privacy concerns limit this.
  • These constraints can lead to less accurate risk assessments and higher costs, challenging the efficiency of providing growth stage financing and other subscription-based financing products.

Exclusive Technavio Analysis on Customer Landscape

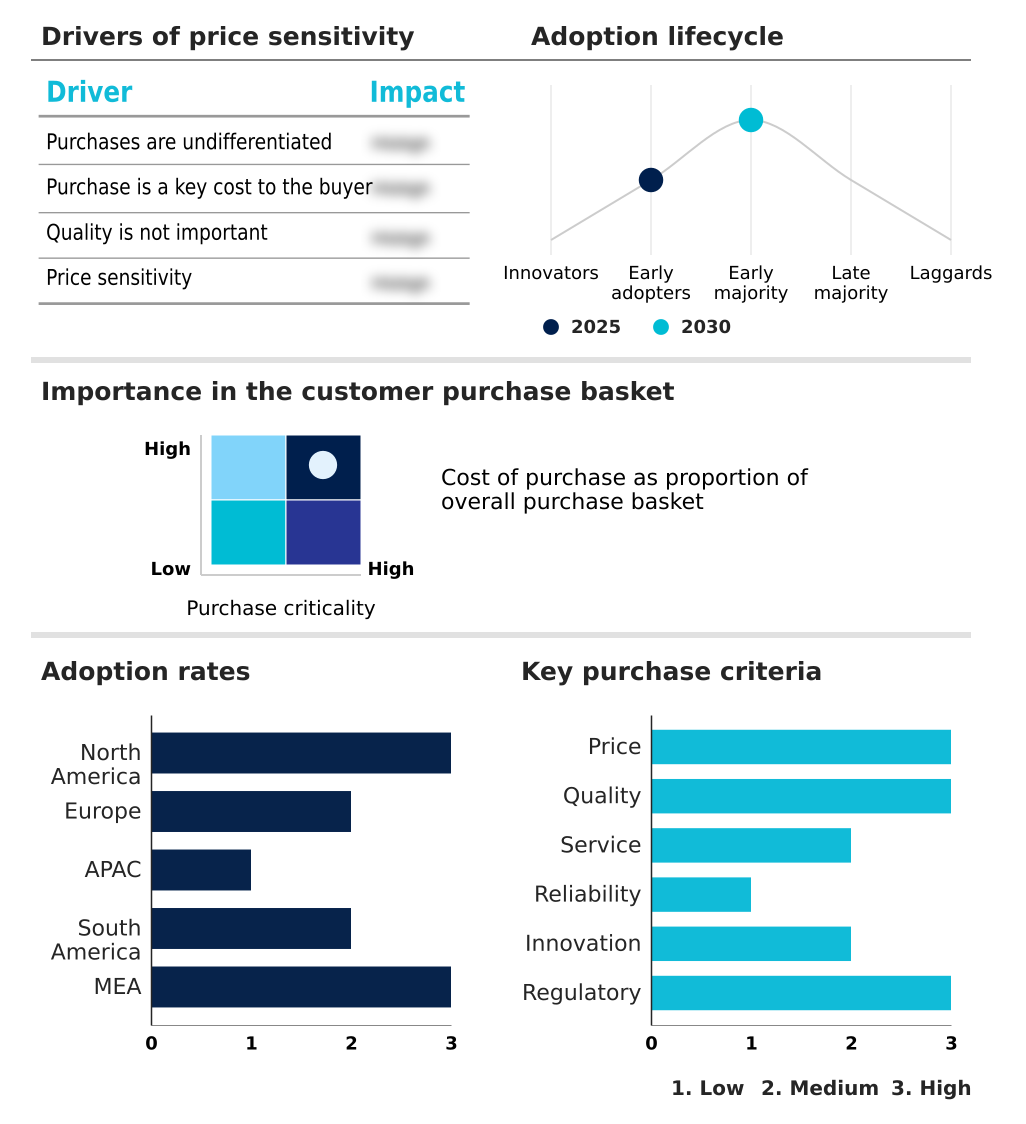
The revenue-based financing platforms market forecasting report includes the adoption lifecycle of the market, covering from the innovator’s stage to the laggard’s stage. It focuses on adoption rates in different regions based on penetration. Furthermore, the revenue-based financing platforms market report also includes key purchase criteria and drivers of price sensitivity to help companies evaluate and develop their market growth analysis strategies.

Customer Landscape of Revenue-based Financing Platforms Industry

Competitive Landscape

Companies are implementing various strategies, such as strategic alliances, revenue-based financing platforms market forecast, partnerships, mergers and acquisitions, geographical expansion, and product/service launches, to enhance their presence in the industry.

Braavo Capital Inc. - Specialized platforms offer fixed-cost, non-dilutive capital for mobile and subscription-based businesses, leveraging advanced analytics and receivables factoring to fuel growth without personal guarantees.

The industry research and growth report includes detailed analyses of the competitive landscape of the market and information about key companies, including:

  • Braavo Capital Inc.
  • Capchase Inc.
  • Choco Up
  • Clear Finance Technology Corp
  • Flow Capital Corp.
  • Founderpath Inc.
  • Funding Circle Holdings Plc
  • GetVantage Tech Pvt. Ltd.
  • Karmen SAS
  • Levenue B.V.
  • Liberis Ltd.
  • Lighter Capital Inc.
  • Novel Capital Inc.
  • PayPal Holdings Inc.
  • Pipe Technologies Inc.
  • Pollen VC
  • Shopify Inc.
  • Stripe Inc.
  • Uncapped Ltd.
  • Wayflyer Ltd.

Qualitative and quantitative analysis of companies has been conducted to help clients understand the wider business environment as well as the strengths and weaknesses of key industry players. Data is qualitatively analyzed to categorize companies as pure play, category-focused, industry-focused, and diversified; it is quantitatively analyzed to categorize companies as dominant, leading, strong, tentative, and weak.

Recent Development and News in Revenue-based financing platforms market

  • In March, 2025, a major European financial oversight body introduced comprehensive reporting standards for alternative financing entities to enhance transparency for small business owners.
  • In May, 2025, Clear.co launched a sophisticated merchant dashboard using AI to analyze real-time subscription data and provide instantaneous capital offers to businesses.
  • In August, 2025, GetVantage launched a dedicated green finance initiative in the APAC region to support SMEs in the renewable energy and sustainable goods sectors.
  • In November, 2025, Shopify announced a deep technical integration with a specialized revenue-based financing provider to offer automated growth capital directly to merchants.

Dive into Technavio’s robust research methodology, blending expert interviews, extensive data synthesis, and validated models for unparalleled Revenue-based Financing Platforms Market insights. See full methodology.

Market Scope
Page number 305
Base year 2025
Historic period 2020-2024
Forecast period 2026-2030
Growth momentum & CAGR Accelerate at a CAGR of 31.9%
Market growth 2026-2030 USD 28747.3 million
Market structure Fragmented
YoY growth 2025-2026(%) 28.3%
Key countries US, Canada, Mexico, Germany, UK, France, Italy, The Netherlands, Spain, China, India, Japan, South Korea, Australia, Indonesia, Brazil, Argentina, Colombia, Saudi Arabia, UAE, South Africa, Israel and Turkey
Competitive landscape Leading Companies, Market Positioning of Companies, Competitive Strategies, and Industry Risks

Request Free Sample

Research Analyst Overview

  • The revenue-based financing platforms market provides non-dilutive capital to businesses with predictable income, particularly those with recurring revenue models in the subscription economy. This model, a key part of modern financial technology, uses data-driven underwriting and machine learning algorithms for real-time due diligence, moving beyond traditional credit assessments.
  • Key offerings include SaaS financing and e-commerce funding, which depend on analyzing transactional sales revenue and gross merchandise volume. For boardroom consideration, the primary advantage is equity preservation, as this performance-based financing avoids ownership dilution, unlike venture capital. Platforms facilitate cash flow management through automated repayment systems, with repayments tied directly to income.
  • This approach has led to a 40% reduction in funding approval times compared to legacy systems. The market is evolving with embedded finance solutions within digital commerce ecosystems, where future receivables are used to secure working capital, credit facilities, invoice funding, or a merchant cash advance.
  • Providers focus on liquidity management and capital allocation, offering revenue-based loans and structuring revenue sharing agreements for digital subscription models. The ultimate goal is to offer flexible growth capital based on metrics like customer lifetime value, ensuring sustainable capital deployment and non-dilutive funding.

What are the Key Data Covered in this Revenue-based Financing Platforms Market Research and Growth Report?

  • What is the expected growth of the Revenue-based Financing Platforms Market between 2026 and 2030?

    • USD 28.75 billion, at a CAGR of 31.9%

  • What segmentation does the market report cover?

    • The report is segmented by Revenue Stream (Recurring subscription revenue, Transactional sales revenue, Gross merchandise volume, and Others), End-user (Information technology, Retail and e-commerce, Media and entertainment, Healthcare, and Others), Business Segment (Small and medium enterprises, and Large enterprises) and Geography (North America, Europe, APAC, South America, Middle East and Africa)

  • Which regions are analyzed in the report?

    • North America, Europe, APAC, South America and Middle East and Africa

  • What are the key growth drivers and market challenges?

    • Proliferation of recurring revenue models and subscription economy, Regulatory uncertainty and complexity of legal classification

  • Who are the major players in the Revenue-based Financing Platforms Market?

    • Braavo Capital Inc., Capchase Inc., Choco Up, Clear Finance Technology Corp, Flow Capital Corp., Founderpath Inc., Funding Circle Holdings Plc, GetVantage Tech Pvt. Ltd., Karmen SAS, Levenue B.V., Liberis Ltd., Lighter Capital Inc., Novel Capital Inc., PayPal Holdings Inc., Pipe Technologies Inc., Pollen VC, Shopify Inc., Stripe Inc., Uncapped Ltd. and Wayflyer Ltd.

Market Research Insights

  • Market dynamics are defined by a strategic shift toward flexible capital solutions that prioritize founder-friendly capital over traditional equity-based funding. The adoption of non-collateral business funding models has accelerated, with platforms demonstrating a 30% faster capital deployment speed compared to conventional lenders. This efficiency is driven by real-time data integration and sophisticated financial performance tracking.
  • As a result, businesses leveraging ARR financing and MRR financing for growth stage financing report an average 15% increase in marketing ROI by aligning capital for marketing spend with peak performance periods.
  • The rise of alternative lending platforms offering revenue-based credit lines and performance-tied repayments provides businesses with predictable cash flow management tools, reducing financial uncertainty and supporting sustained operational expansion without ownership dilution.

We can help! Our analysts can customize this revenue-based financing platforms market research report to meet your requirements.

Get in touch

1. Executive Summary

1.1 Market overview

Executive Summary - Chart on Market Overview
Executive Summary - Data Table on Market Overview
Executive Summary - Chart on Global Market Characteristics
Executive Summary - Chart on Market by Geography
Executive Summary - Chart on Market Segmentation by Revenue Stream
Executive Summary - Chart on Market Segmentation by End-user
Executive Summary - Chart on Market Segmentation by Business Segment
Executive Summary - Chart on Incremental Growth
Executive Summary - Data Table on Incremental Growth
Executive Summary - Chart on Company Market Positioning

2. Technavio Analysis

2.1 Analysis of price sensitivity, lifecycle, customer purchase basket, adoption rates, and purchase criteria

2.2 Criticality of inputs and Factors of differentiation

Chart on Overview on criticality of inputs and factors of differentiation

2.3 Factors of disruption

Chart on Overview on factors of disruption

2.4 Impact of drivers and challenges

Chart on Impact of drivers and challenges in 2025 and 2030

3. Market Landscape

3.1 Market ecosystem

Chart on Parent Market
Data Table on - Parent Market

3.2 Market characteristics

Chart on Market characteristics analysis

3.3 Value chain analysis

Chart on Value chain analysis

4. Market Sizing

4.1 Market definition

Data Table on Offerings of companies included in the market definition

4.2 Market segment analysis

Market segments

4.3 Market size 2025

4.4 Market outlook: Forecast for 2025-2030

Chart on Global - Market size and forecast 2025-2030 ($ million)
Data Table on Global - Market size and forecast 2025-2030 ($ million)
Chart on Global Market: Year-over-year growth 2025-2030 (%)
Data Table on Global Market: Year-over-year growth 2025-2030 (%)

5. Historic Market Size

5.1 Global Revenue-Based Financing Platforms Market 2020 - 2024

Historic Market Size - Data Table on Global Revenue-Based Financing Platforms Market 2020 - 2024 ($ million)

5.2 Revenue Stream segment analysis 2020 - 2024

Historic Market Size - Revenue Stream Segment 2020 - 2024 ($ million)

5.3 End-user segment analysis 2020 - 2024

Historic Market Size - End-user Segment 2020 - 2024 ($ million)

5.4 Business segment analysis 2020 - 2024

Historic Market Size - Business Segment 2020 - 2024 ($ million)

5.5 Geography segment analysis 2020 - 2024

Historic Market Size - Geography Segment 2020 - 2024 ($ million)

5.6 Country segment analysis 2020 - 2024

Historic Market Size - Country Segment 2020 - 2024 ($ million)

6. Qualitative Analysis

6.1 The AI impact on Global Revenue-Based Financing Platforms Market

7. Five Forces Analysis

7.1 Five forces summary

Five forces analysis - Comparison between 2025 and 2030

7.2 Bargaining power of buyers

Bargaining power of buyers - Impact of key factors 2025 and 2030

7.3 Bargaining power of suppliers

Bargaining power of suppliers - Impact of key factors in 2025 and 2030

7.4 Threat of new entrants

Threat of new entrants - Impact of key factors in 2025 and 2030

7.5 Threat of substitutes

Threat of substitutes - Impact of key factors in 2025 and 2030

7.6 Threat of rivalry

Threat of rivalry - Impact of key factors in 2025 and 2030

7.7 Market condition

Chart on Market condition - Five forces 2025 and 2030

8. Market Segmentation by Revenue Stream

8.1 Market segments

Chart on Revenue Stream - Market share 2025-2030 (%)
Data Table on Revenue Stream - Market share 2025-2030 (%)

8.2 Comparison by Revenue Stream

Chart on Comparison by Revenue Stream
Data Table on Comparison by Revenue Stream

8.3 Recurring subscription revenue - Market size and forecast 2025-2030

Chart on Recurring subscription revenue - Market size and forecast 2025-2030 ($ million)
Data Table on Recurring subscription revenue - Market size and forecast 2025-2030 ($ million)
Chart on Recurring subscription revenue - Year-over-year growth 2025-2030 (%)
Data Table on Recurring subscription revenue - Year-over-year growth 2025-2030 (%)

8.4 Transactional sales revenue - Market size and forecast 2025-2030

Chart on Transactional sales revenue - Market size and forecast 2025-2030 ($ million)
Data Table on Transactional sales revenue - Market size and forecast 2025-2030 ($ million)
Chart on Transactional sales revenue - Year-over-year growth 2025-2030 (%)
Data Table on Transactional sales revenue - Year-over-year growth 2025-2030 (%)

8.5 Gross merchandise volume - Market size and forecast 2025-2030

Chart on Gross merchandise volume - Market size and forecast 2025-2030 ($ million)
Data Table on Gross merchandise volume - Market size and forecast 2025-2030 ($ million)
Chart on Gross merchandise volume - Year-over-year growth 2025-2030 (%)
Data Table on Gross merchandise volume - Year-over-year growth 2025-2030 (%)

8.6 Others - Market size and forecast 2025-2030

Chart on Others - Market size and forecast 2025-2030 ($ million)
Data Table on Others - Market size and forecast 2025-2030 ($ million)
Chart on Others - Year-over-year growth 2025-2030 (%)
Data Table on Others - Year-over-year growth 2025-2030 (%)

8.7 Market opportunity by Revenue Stream

Market opportunity by Revenue Stream ($ million)
Data Table on Market opportunity by Revenue Stream ($ million)

9. Market Segmentation by End-user

9.1 Market segments

Chart on End-user - Market share 2025-2030 (%)
Data Table on End-user - Market share 2025-2030 (%)

9.2 Comparison by End-user

Chart on Comparison by End-user
Data Table on Comparison by End-user

9.3 Information technology - Market size and forecast 2025-2030

Chart on Information technology - Market size and forecast 2025-2030 ($ million)
Data Table on Information technology - Market size and forecast 2025-2030 ($ million)
Chart on Information technology - Year-over-year growth 2025-2030 (%)
Data Table on Information technology - Year-over-year growth 2025-2030 (%)

9.4 Retail and e-commerce - Market size and forecast 2025-2030

Chart on Retail and e-commerce - Market size and forecast 2025-2030 ($ million)
Data Table on Retail and e-commerce - Market size and forecast 2025-2030 ($ million)
Chart on Retail and e-commerce - Year-over-year growth 2025-2030 (%)
Data Table on Retail and e-commerce - Year-over-year growth 2025-2030 (%)

9.5 Media and entertainment - Market size and forecast 2025-2030

Chart on Media and entertainment - Market size and forecast 2025-2030 ($ million)
Data Table on Media and entertainment - Market size and forecast 2025-2030 ($ million)
Chart on Media and entertainment - Year-over-year growth 2025-2030 (%)
Data Table on Media and entertainment - Year-over-year growth 2025-2030 (%)

9.6 Healthcare - Market size and forecast 2025-2030

Chart on Healthcare - Market size and forecast 2025-2030 ($ million)
Data Table on Healthcare - Market size and forecast 2025-2030 ($ million)
Chart on Healthcare - Year-over-year growth 2025-2030 (%)
Data Table on Healthcare - Year-over-year growth 2025-2030 (%)

9.7 Others - Market size and forecast 2025-2030

Chart on Others - Market size and forecast 2025-2030 ($ million)
Data Table on Others - Market size and forecast 2025-2030 ($ million)
Chart on Others - Year-over-year growth 2025-2030 (%)
Data Table on Others - Year-over-year growth 2025-2030 (%)

9.8 Market opportunity by End-user

Market opportunity by End-user ($ million)
Data Table on Market opportunity by End-user ($ million)

10. Market Segmentation by Business Segment

10.1 Market segments

Chart on Market Segmentation by Business Segment - Market share 2025-2030 (%)
Data Table on Market Segmentation by Business Segment - Market share 2025-2030 (%)

10.2 Comparison by Market Segmentation by Business Segment

Chart on Comparison by Market Segmentation by Business Segment
Data Table on Comparison by Market Segmentation by Business Segment

10.3 Small and medium enterprises - Market size and forecast 2025-2030

Chart on Small and medium enterprises - Market size and forecast 2025-2030 ($ million)
Data Table on Small and medium enterprises - Market size and forecast 2025-2030 ($ million)
Chart on Small and medium enterprises - Year-over-year growth 2025-2030 (%)
Data Table on Small and medium enterprises - Year-over-year growth 2025-2030 (%)

10.4 Large enterprises - Market size and forecast 2025-2030

Chart on Large enterprises - Market size and forecast 2025-2030 ($ million)
Data Table on Large enterprises - Market size and forecast 2025-2030 ($ million)
Chart on Large enterprises - Year-over-year growth 2025-2030 (%)
Data Table on Large enterprises - Year-over-year growth 2025-2030 (%)

10.5 Market opportunity by Market Segmentation by Business Segment

Market opportunity by Market Segmentation by Business Segment ($ million)
Data Table on Market opportunity by Market Segmentation by Business Segment ($ million)

11. Customer Landscape

11.1 Customer landscape overview

Analysis of price sensitivity, lifecycle, customer purchase basket, adoption rates, and purchase criteria

12. Geographic Landscape

12.1 Geographic segmentation

Chart on Market share by geography 2025-2030 (%)
Data Table on Market share by geography 2025-2030 (%)

12.2 Geographic comparison

Chart on Geographic comparison
Data Table on Geographic comparison

12.3 North America - Market size and forecast 2025-2030

Chart on North America - Market size and forecast 2025-2030 ($ million)
Data Table on North America - Market size and forecast 2025-2030 ($ million)
Chart on North America - Year-over-year growth 2025-2030 (%)
Data Table on North America - Year-over-year growth 2025-2030 (%)
Chart on Regional Comparison - North America
Data Table on Regional Comparison - North America

12.3.1 US - Market size and forecast 2025-2030

Chart on US - Market size and forecast 2025-2030 ($ million)
Data Table on US - Market size and forecast 2025-2030 ($ million)
Chart on US - Year-over-year growth 2025-2030 (%)
Data Table on US - Year-over-year growth 2025-2030 (%)

12.3.2 Canada - Market size and forecast 2025-2030

Chart on Canada - Market size and forecast 2025-2030 ($ million)
Data Table on Canada - Market size and forecast 2025-2030 ($ million)
Chart on Canada - Year-over-year growth 2025-2030 (%)
Data Table on Canada - Year-over-year growth 2025-2030 (%)

12.3.3 Mexico - Market size and forecast 2025-2030

Chart on Mexico - Market size and forecast 2025-2030 ($ million)
Data Table on Mexico - Market size and forecast 2025-2030 ($ million)
Chart on Mexico - Year-over-year growth 2025-2030 (%)
Data Table on Mexico - Year-over-year growth 2025-2030 (%)

12.4 Europe - Market size and forecast 2025-2030

Chart on Europe - Market size and forecast 2025-2030 ($ million)
Data Table on Europe - Market size and forecast 2025-2030 ($ million)
Chart on Europe - Year-over-year growth 2025-2030 (%)
Data Table on Europe - Year-over-year growth 2025-2030 (%)
Chart on Regional Comparison - Europe
Data Table on Regional Comparison - Europe

12.4.1 Germany - Market size and forecast 2025-2030

Chart on Germany - Market size and forecast 2025-2030 ($ million)
Data Table on Germany - Market size and forecast 2025-2030 ($ million)
Chart on Germany - Year-over-year growth 2025-2030 (%)
Data Table on Germany - Year-over-year growth 2025-2030 (%)

12.4.2 UK - Market size and forecast 2025-2030

Chart on UK - Market size and forecast 2025-2030 ($ million)
Data Table on UK - Market size and forecast 2025-2030 ($ million)
Chart on UK - Year-over-year growth 2025-2030 (%)
Data Table on UK - Year-over-year growth 2025-2030 (%)

12.4.3 France - Market size and forecast 2025-2030

Chart on France - Market size and forecast 2025-2030 ($ million)
Data Table on France - Market size and forecast 2025-2030 ($ million)
Chart on France - Year-over-year growth 2025-2030 (%)
Data Table on France - Year-over-year growth 2025-2030 (%)

12.4.4 Italy - Market size and forecast 2025-2030

Chart on Italy - Market size and forecast 2025-2030 ($ million)
Data Table on Italy - Market size and forecast 2025-2030 ($ million)
Chart on Italy - Year-over-year growth 2025-2030 (%)
Data Table on Italy - Year-over-year growth 2025-2030 (%)

12.4.5 The Netherlands - Market size and forecast 2025-2030

Chart on The Netherlands - Market size and forecast 2025-2030 ($ million)
Data Table on The Netherlands - Market size and forecast 2025-2030 ($ million)
Chart on The Netherlands - Year-over-year growth 2025-2030 (%)
Data Table on The Netherlands - Year-over-year growth 2025-2030 (%)

12.4.6 Spain - Market size and forecast 2025-2030

Chart on Spain - Market size and forecast 2025-2030 ($ million)
Data Table on Spain - Market size and forecast 2025-2030 ($ million)
Chart on Spain - Year-over-year growth 2025-2030 (%)
Data Table on Spain - Year-over-year growth 2025-2030 (%)

12.5 APAC - Market size and forecast 2025-2030

Chart on APAC - Market size and forecast 2025-2030 ($ million)
Data Table on APAC - Market size and forecast 2025-2030 ($ million)
Chart on APAC - Year-over-year growth 2025-2030 (%)
Data Table on APAC - Year-over-year growth 2025-2030 (%)
Chart on Regional Comparison - APAC
Data Table on Regional Comparison - APAC

12.5.1 China - Market size and forecast 2025-2030

Chart on China - Market size and forecast 2025-2030 ($ million)
Data Table on China - Market size and forecast 2025-2030 ($ million)
Chart on China - Year-over-year growth 2025-2030 (%)
Data Table on China - Year-over-year growth 2025-2030 (%)

12.5.2 India - Market size and forecast 2025-2030

Chart on India - Market size and forecast 2025-2030 ($ million)
Data Table on India - Market size and forecast 2025-2030 ($ million)
Chart on India - Year-over-year growth 2025-2030 (%)
Data Table on India - Year-over-year growth 2025-2030 (%)

12.5.3 Japan - Market size and forecast 2025-2030

Chart on Japan - Market size and forecast 2025-2030 ($ million)
Data Table on Japan - Market size and forecast 2025-2030 ($ million)
Chart on Japan - Year-over-year growth 2025-2030 (%)
Data Table on Japan - Year-over-year growth 2025-2030 (%)

12.5.4 South Korea - Market size and forecast 2025-2030

Chart on South Korea - Market size and forecast 2025-2030 ($ million)
Data Table on South Korea - Market size and forecast 2025-2030 ($ million)
Chart on South Korea - Year-over-year growth 2025-2030 (%)
Data Table on South Korea - Year-over-year growth 2025-2030 (%)

12.5.5 Australia - Market size and forecast 2025-2030

Chart on Australia - Market size and forecast 2025-2030 ($ million)
Data Table on Australia - Market size and forecast 2025-2030 ($ million)
Chart on Australia - Year-over-year growth 2025-2030 (%)
Data Table on Australia - Year-over-year growth 2025-2030 (%)

12.5.6 Indonesia - Market size and forecast 2025-2030

Chart on Indonesia - Market size and forecast 2025-2030 ($ million)
Data Table on Indonesia - Market size and forecast 2025-2030 ($ million)
Chart on Indonesia - Year-over-year growth 2025-2030 (%)
Data Table on Indonesia - Year-over-year growth 2025-2030 (%)

12.6 South America - Market size and forecast 2025-2030

Chart on South America - Market size and forecast 2025-2030 ($ million)
Data Table on South America - Market size and forecast 2025-2030 ($ million)
Chart on South America - Year-over-year growth 2025-2030 (%)
Data Table on South America - Year-over-year growth 2025-2030 (%)
Chart on Regional Comparison - South America
Data Table on Regional Comparison - South America

12.6.1 Brazil - Market size and forecast 2025-2030

Chart on Brazil - Market size and forecast 2025-2030 ($ million)
Data Table on Brazil - Market size and forecast 2025-2030 ($ million)
Chart on Brazil - Year-over-year growth 2025-2030 (%)
Data Table on Brazil - Year-over-year growth 2025-2030 (%)

12.6.2 Argentina - Market size and forecast 2025-2030

Chart on Argentina - Market size and forecast 2025-2030 ($ million)
Data Table on Argentina - Market size and forecast 2025-2030 ($ million)
Chart on Argentina - Year-over-year growth 2025-2030 (%)
Data Table on Argentina - Year-over-year growth 2025-2030 (%)

12.6.3 Colombia - Market size and forecast 2025-2030

Chart on Colombia - Market size and forecast 2025-2030 ($ million)
Data Table on Colombia - Market size and forecast 2025-2030 ($ million)
Chart on Colombia - Year-over-year growth 2025-2030 (%)
Data Table on Colombia - Year-over-year growth 2025-2030 (%)

12.7 Middle East and Africa - Market size and forecast 2025-2030

Chart on Middle East and Africa - Market size and forecast 2025-2030 ($ million)
Data Table on Middle East and Africa - Market size and forecast 2025-2030 ($ million)
Chart on Middle East and Africa - Year-over-year growth 2025-2030 (%)
Data Table on Middle East and Africa - Year-over-year growth 2025-2030 (%)
Chart on Regional Comparison - Middle East and Africa
Data Table on Regional Comparison - Middle East and Africa

12.7.1 Saudi Arabia - Market size and forecast 2025-2030

Chart on Saudi Arabia - Market size and forecast 2025-2030 ($ million)
Data Table on Saudi Arabia - Market size and forecast 2025-2030 ($ million)
Chart on Saudi Arabia - Year-over-year growth 2025-2030 (%)
Data Table on Saudi Arabia - Year-over-year growth 2025-2030 (%)

12.7.2 UAE - Market size and forecast 2025-2030

Chart on UAE - Market size and forecast 2025-2030 ($ million)
Data Table on UAE - Market size and forecast 2025-2030 ($ million)
Chart on UAE - Year-over-year growth 2025-2030 (%)
Data Table on UAE - Year-over-year growth 2025-2030 (%)

12.7.3 South Africa - Market size and forecast 2025-2030

Chart on South Africa - Market size and forecast 2025-2030 ($ million)
Data Table on South Africa - Market size and forecast 2025-2030 ($ million)
Chart on South Africa - Year-over-year growth 2025-2030 (%)
Data Table on South Africa - Year-over-year growth 2025-2030 (%)

12.7.4 Israel - Market size and forecast 2025-2030

Chart on Israel - Market size and forecast 2025-2030 ($ million)
Data Table on Israel - Market size and forecast 2025-2030 ($ million)
Chart on Israel - Year-over-year growth 2025-2030 (%)
Data Table on Israel - Year-over-year growth 2025-2030 (%)

12.7.5 Turkey - Market size and forecast 2025-2030

Chart on Turkey - Market size and forecast 2025-2030 ($ million)
Data Table on Turkey - Market size and forecast 2025-2030 ($ million)
Chart on Turkey - Year-over-year growth 2025-2030 (%)
Data Table on Turkey - Year-over-year growth 2025-2030 (%)

12.8 Market opportunity by geography

Market opportunity by geography ($ million)
Data Tables on Market opportunity by geography ($ million)

13. Drivers, Challenges, and Opportunity

13.1 Market drivers

Proliferation of recurring revenue models and subscription economy
Strategic prioritization of non-dilutive capital and equity preservation
Advancements in financial technology and data-driven underwriting efficiency

13.2 Market challenges

Regulatory uncertainty and complexity of legal classification
Data Privacy constraints and vulnerability of integrated underwriting
Macroeconomic volatility and risk of adverse selection

13.3 Impact of drivers and challenges

Impact of drivers and challenges in 2025 and 2030

13.4 Market opportunities

Integration of AI and predictive analytics in underwriting processes
Expansion of revenue-based financing into sustainable and ESG-linked verticals
Rise of embedded finance and deep ecosystem partnerships

14. Competitive Landscape

14.1 Overview

14.2

Overview on criticality of inputs and factors of differentiation

14.3 Landscape disruption

Overview on factors of disruption

14.4 Industry risks

Impact of key risks on business

15. Competitive Analysis

15.1 Companies profiled

Companies covered

15.2 Company ranking index

15.3 Market positioning of companies

Matrix on companies position and classification

15.4 Braavo Capital Inc.

Braavo Capital Inc. - Overview
Braavo Capital Inc. - Product / Service
Braavo Capital Inc. - Key offerings
SWOT

15.5 Capchase Inc.

Capchase Inc. - Overview
Capchase Inc. - Product / Service
Capchase Inc. - Key offerings
SWOT

15.6 Choco Up

Choco Up - Overview
Choco Up - Product / Service
Choco Up - Key offerings
SWOT

15.7 Clear Finance Technology Corp

Clear Finance Technology Corp - Overview
Clear Finance Technology Corp - Product / Service
Clear Finance Technology Corp - Key offerings
SWOT

15.8 Flow Capital Corp.

Flow Capital Corp. - Overview
Flow Capital Corp. - Product / Service
Flow Capital Corp. - Key offerings
SWOT

15.9 Founderpath Inc.

Founderpath Inc. - Overview
Founderpath Inc. - Product / Service
Founderpath Inc. - Key offerings
SWOT

15.10 Funding Circle Holdings Plc

Funding Circle Holdings Plc - Overview
Funding Circle Holdings Plc - Product / Service
Funding Circle Holdings Plc - Key offerings
SWOT

15.11 GetVantage Tech Pvt. Ltd.

GetVantage Tech Pvt. Ltd. - Overview
GetVantage Tech Pvt. Ltd. - Product / Service
GetVantage Tech Pvt. Ltd. - Key offerings
SWOT

15.12 Karmen SAS

Karmen SAS - Overview
Karmen SAS - Product / Service
Karmen SAS - Key offerings
SWOT

15.13 Levenue B.V.

Levenue B.V. - Overview
Levenue B.V. - Product / Service
Levenue B.V. - Key offerings
SWOT

15.14 Liberis Ltd.

Liberis Ltd. - Overview
Liberis Ltd. - Product / Service
Liberis Ltd. - Key offerings
SWOT

15.15 Lighter Capital Inc.

Lighter Capital Inc. - Overview
Lighter Capital Inc. - Product / Service
Lighter Capital Inc. - Key offerings
SWOT

15.16 Novel Capital Inc.

Novel Capital Inc. - Overview
Novel Capital Inc. - Product / Service
Novel Capital Inc. - Key offerings
SWOT

15.17 PayPal Holdings Inc.

PayPal Holdings Inc. - Overview
PayPal Holdings Inc. - Product / Service
PayPal Holdings Inc. - Key news
PayPal Holdings Inc. - Key offerings
SWOT

15.18 Pipe Technologies Inc.

Pipe Technologies Inc. - Overview
Pipe Technologies Inc. - Product / Service
Pipe Technologies Inc. - Key offerings
SWOT

16. Appendix

16.1 Scope of the report

Market definition
Objectives
Notes and caveats

16.2 Inclusions and exclusions checklist

Inclusions checklist
Exclusions checklist

16.3 Currency conversion rates for US$

16.4 Research methodology

16.5 Data procurement

Information sources

16.6 Data validation

16.7 Validation techniques employed for market sizing

16.8 Data synthesis

16.9 360 degree market analysis

16.10 List of abbreviations

Research Methodology

Technavio presents a detailed picture of the market by way of study, synthesis, and summation of data from multiple sources. The analysts have presented the various facets of the market with a particular focus on identifying the key industry influencers. The data thus presented is comprehensive, reliable, and the result of extensive research, both primary and secondary.

INFORMATION SOURCES

Primary sources

  • Manufacturers and suppliers
  • Channel partners
  • Industry experts
  • Strategic decision makers

Secondary sources

  • Industry journals and periodicals
  • Government data
  • Financial reports of key industry players
  • Historical data
  • Press releases

DATA ANALYSIS

Data Synthesis

  • Collation of data
  • Estimation of key figures
  • Analysis of derived insights

Data Validation

  • Triangulation with data models
  • Reference against proprietary databases
  • Corroboration with industry experts

REPORT WRITING

Qualitative

  • Market drivers
  • Market challenges
  • Market trends
  • Five forces analysis

Quantitative

  • Market size and forecast
  • Market segmentation
  • Geographical insights
  • Competitive landscape

Interested in this report?

Get your sample now to see our research methodology and insights!

Download Now

Frequently Asked Questions

Revenue-based Financing Platforms market growth will increase by USD 28747.3 million during 2026-2030.

The Revenue-based Financing Platforms market is expected to grow at a CAGR of 31.9% during 2026-2030.

Revenue-based Financing Platforms market is segmented by Revenue stream (Recurring subscription revenue, Transactional sales revenue, Gross merchandise volume, Others) End-user (Information technology, Retail and e-commerce, Media and entertainment, Healthcare, Others) Business segment (Small and medium enterprises, Large enterprises)

Braavo Capital Inc., Capchase Inc., Choco Up, Clear Finance Technology Corp, Flow Capital Corp., Founderpath Inc., Funding Circle Holdings Plc, GetVantage Tech Pvt. Ltd., Karmen SAS, Levenue B.V., Liberis Ltd., Lighter Capital Inc., Novel Capital Inc., PayPal Holdings Inc., Pipe Technologies Inc., Pollen VC, Shopify Inc., Stripe Inc., Uncapped Ltd., Wayflyer Ltd. are a few of the key vendors in the Revenue-based Financing Platforms market.

North America will register the highest growth rate of 43.4% among the other regions. Therefore, the Revenue-based Financing Platforms market in North America is expected to garner significant business opportunities for the vendors during the forecast period.

US, Canada, Mexico, Germany, UK, France, Italy, The Netherlands, Spain, China, India, Japan, South Korea, Australia, Indonesia, Brazil, Argentina, Colombia, Saudi Arabia, UAE, South Africa, Israel, Turkey

  • Proliferation of recurring revenue models and subscription economy is the driving factor this market.

The Revenue-based Financing Platforms market vendors should focus on grabbing business opportunities from the Revenue stream segment as it accounted for the largest market share in the base year.
RIA - Research AI Assistant
Ask RIA