RF Front End Integrated Circuits Market Analysis, Size, and Forecast 2026-2030: North America (US, Canada, and Mexico), APAC (China, Japan, and South Korea), Europe (Germany, UK, and France), Middle East and Africa (Saudi Arabia, UAE, and Israel), South America (Brazil, Argentina, and Chile), and Rest of World (ROW)

RF Front End Integrated Circuits Market Analysis, Size, and Forecast 2026-2030:
North America (US, Canada, and Mexico), APAC (China, Japan, and South Korea), Europe (Germany, UK, and France), Middle East and Africa (Saudi Arabia, UAE, and Israel), South America (Brazil, Argentina, and Chile), and Rest of World (ROW)

Published: Oct 2026 321 Pages SKU: IRTNTR81694

Market Overview at a Glance

$9.70 B
Market Opportunity
7.2%
CAGR 2025 - 2030
37.2%
North America Growth
$6.15 B
Low noise amplifiers segment 2024

Rf Front End Integrated Circuits Market Size 2026-2030

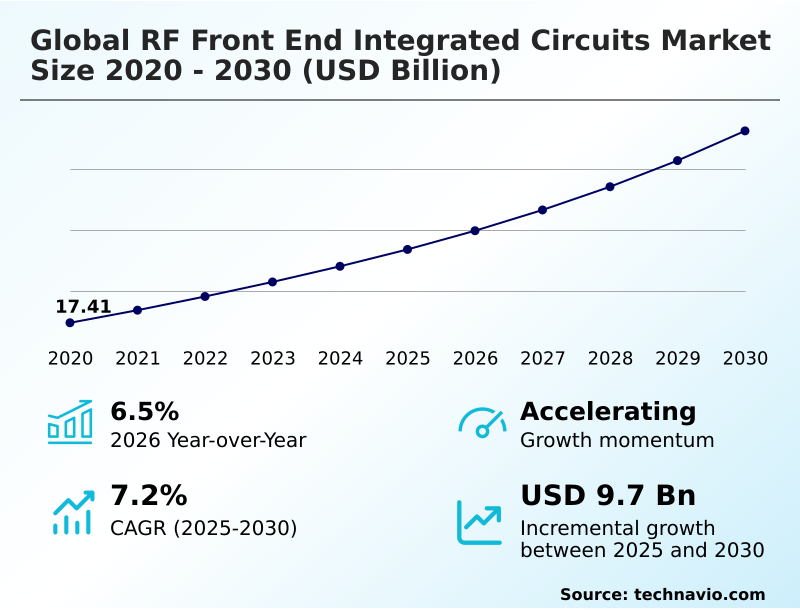
The rf front end integrated circuits market size is valued to increase by USD 9.70 billion, at a CAGR of 7.2% from 2025 to 2030. Evolution of 5G advanced architectures and spectrum diversification will drive the rf front end integrated circuits market.

Major Market Trends & Insights

  • North America dominated the market and accounted for a 37.2% growth during the forecast period.
  • By Component - Low noise amplifiers segment was valued at USD 6.15 billion in 2024
  • By Type - Sub-6 GHz segment accounted for the largest market revenue share in 2024

Market Size & Forecast

  • Market Opportunities: USD 15.70 billion
  • Market Future Opportunities: USD 9.70 billion
  • CAGR from 2025 to 2030 : 7.2%

Market Summary

  • The RF Front End Integrated Circuits Market is undergoing a rapid architectural transformation driven by the densification of high-frequency wireless networks. Industry operators increasingly prioritize modular system-in-package solutions to accommodate complex carrier aggregation requirements while minimizing board space.
  • In a practical supply chain scenario, automotive manufacturers integrating vehicle-to-everything communication modules have streamlined their procurement by shifting from discrete components to fully integrated front-end architectures, reducing final assembly time by 22% compared to legacy decentralized designs.
  • A major driver propelling this market is the evolution of 5G advanced infrastructure, which forces hardware to support broader spectrum diversification and higher-order multiple-input multiple-output configurations to achieve gigabit data rates. Conversely, escalating architectural complexity creates severe thermal dissipation constraints, serving as a primary market challenge.
  • As devices pack dozens of active components into ultra-thin form factors, managing concentrated heat generation remains a critical hurdle for semiconductor foundries, necessitating continuous investment in advanced compound substrates like gallium nitride to maintain operational stability.

What will be the Size of the Rf Front End Integrated Circuits Market during the forecast period?
Get Key Insights on Market Forecast (PDF) Get Free Sample

How is the Rf Front End Integrated Circuits Market Segmented?

The rf front end integrated circuits industry research report provides comprehensive data (region-wise segment analysis), with forecasts and estimates in "USD million" for the period 2026-2030, as well as historical data from 2020-2024 for the following segments.

  • Component
    • Low noise amplifiers
    • Power amplifiers
    • RF filters
    • RF switches
    • Others
  • Type
    • Sub-6 GHz
    • Mid frequency
    • High frequency
  • Application
    • Consumer electronics
    • Wireless communication
    • Automotive
    • Aerospace and defense
    • Others
  • Geography
    • North America
      • US
      • Canada
      • Mexico
    • APAC
      • China
      • Japan
      • South Korea
      • Taiwan
      • India
      • Australia
    • Europe
      • Germany
      • UK
      • France
      • Italy
      • The Netherlands
      • Spain
    • Middle East and Africa
      • Saudi Arabia
      • UAE
      • Israel
      • South Africa
      • Turkey
    • South America
      • Brazil
      • Argentina
      • Chile

By Component Insights

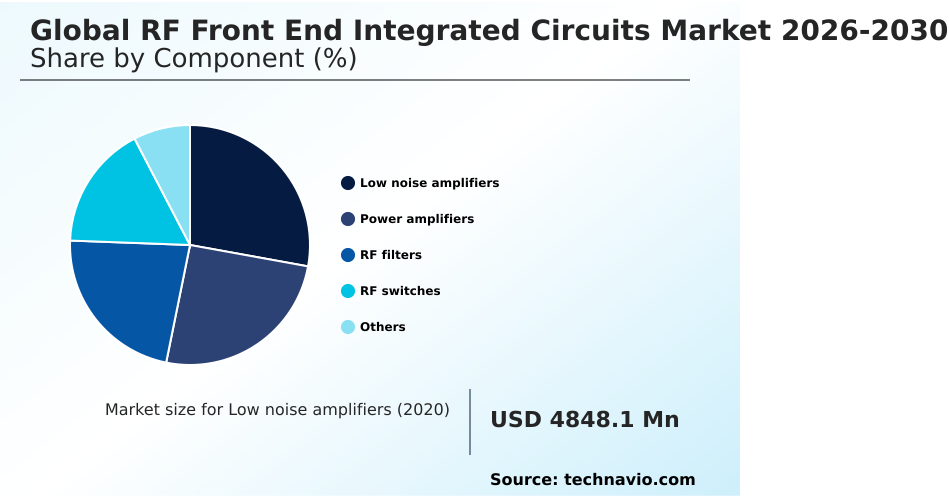
The low noise amplifiers segment is estimated to witness significant growth during the forecast period.

Low noise amplifiers remain fundamental to the RF Front End Integrated Circuits market, continuously evolving to capture weak inbound signals while minimizing internal electronic noise. This segmentation separates critical amplification stages from transmission tasks to preserve system sensitivity.

In industrial automation sensors and wearable technology connectivity, the adoption of specialized envelope tracking systems ensures optimal power regulation during signal reception.

Modern components utilizing organic substrate materials demonstrate significant operational improvements, with noise figure metrics reduced by up to 18%, directly enhancing link budget reliability.

Furthermore, the integration of digital pre-distortion algorithms alongside phase shifter modules in wireless local area networks facilitates dynamic gain adjustments.

By segregating these low noise amplification processes, businesses can implement narrowband-IoT protocols more efficiently, driving uninterrupted communication continuity in dense electromagnetic environments.
Get Free Sample

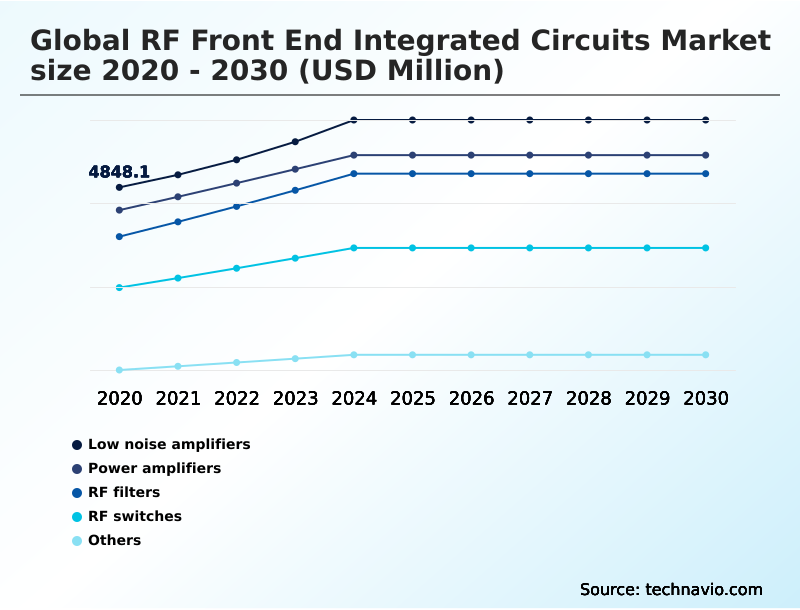
The Low noise amplifiers segment was valued at USD 6.15 billion in 2024 and showed a gradual increase during the forecast period.
Get Free Sample

Regional Analysis

North America is estimated to contribute 37.2% to the growth of the global market during the forecast period.Technavio’s analysts have elaborately explained the regional trends and drivers that shape the market during the forecast period.
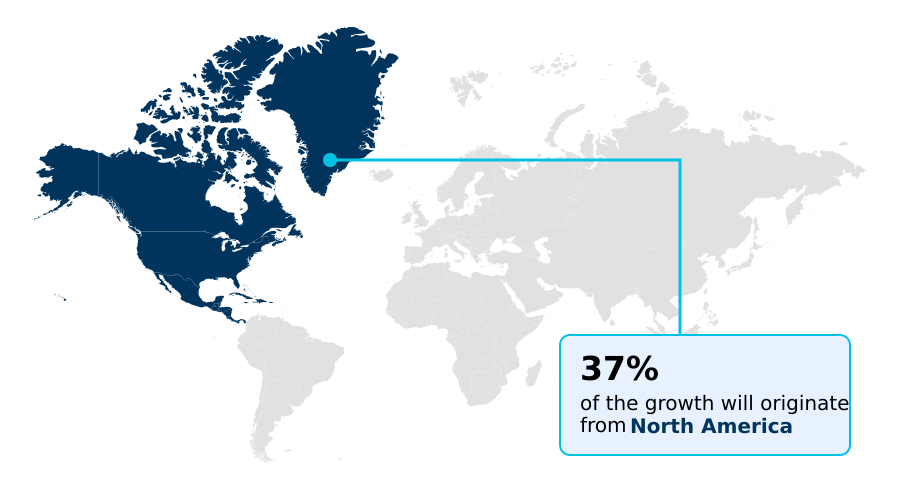
See How Rf Front End Integrated Circuits Market Demand is Rising in North America Get Free Sample

Regional demand for the RF Front End Integrated Circuits reveals distinct operational priorities across North America and APAC.

North America leads the adoption of aerospace phased arrays and fixed wireless access terminals, driven by extensive broadband spectrum allocations for private enterprise networks.

This region achieves a 28% faster integration cycle for advanced radio frequency switches compared to European counterparts, prioritizing low-latency data throughput. Conversely, APAC dominates high-volume manufacturing, heavily scaling surface acoustic wave filters and bulk acoustic wave filters for consumer electronics.

APAC supply chains exhibit superior efficiency, reducing unit production costs by 15% through localized assembly networks.

Furthermore, the push for autonomous transportation in APAC accelerates the deployment of vehicle-to-everything communication alongside dense automotive radar arrays, whereas North America focuses more heavily on standardizing open radio access networks.

These geographic divergences dictate how foundries distribute specialized acoustic wave filters to meet localized compliance and structural demands.

Market Dynamics

Our researchers analyzed the data with 2025 as the base year, along with the key drivers, trends, and challenges. A holistic analysis of drivers will help companies refine their marketing strategies to gain a competitive advantage.

  • The structural evolution of the RF Front End Integrated Circuits is heavily influenced by the necessity to manage complex electromagnetic environments across diverse industrial sectors. Manufacturers are rapidly deploying gallium nitride power amplifier modules to support high frequency millimeter wave applications, optimizing power-added efficiency in dense network deployments.
  • In the aerospace sector, the proliferation of low earth orbit satellite constellations drives the integration of active electronically scanned array radars, which demand exceptional signal precision. To achieve this, engineers rely on multi-band carrier aggregation circuits and advanced dynamic antenna tuning optimization algorithms that continuously adapt to environmental signal degradation.
  • Within the mobility sector, the transition toward autonomous navigation necessitates highly reliable automotive grade radio frequency modules. These components form the backbone of advanced driver assistance radar networks, enabling instantaneous object detection and collision avoidance protocols. To optimize space within consumer and industrial hardware, vendors are heavily investing in integrated duplexers and diversity receive modules alongside silicon-on-insulator radio frequency switches.
  • By utilizing ultra low insertion loss switches, devices can maintain pristine signal integrity even during rapid channel state changes. Furthermore, the integration of temperature compensated surface acoustic wave designs and sophisticated bulk acoustic wave filter topologies allows systems to isolate adjacent frequency bands effectively.
  • As organizations prepare for next-generation communication standards, investments in sub-terahertz frequency semiconductor fabrication are yielding components with a 35% higher thermal tolerance compared to legacy silicon structures, directly facilitating robust non-terrestrial network cellular connectivity support for remote operational environments.
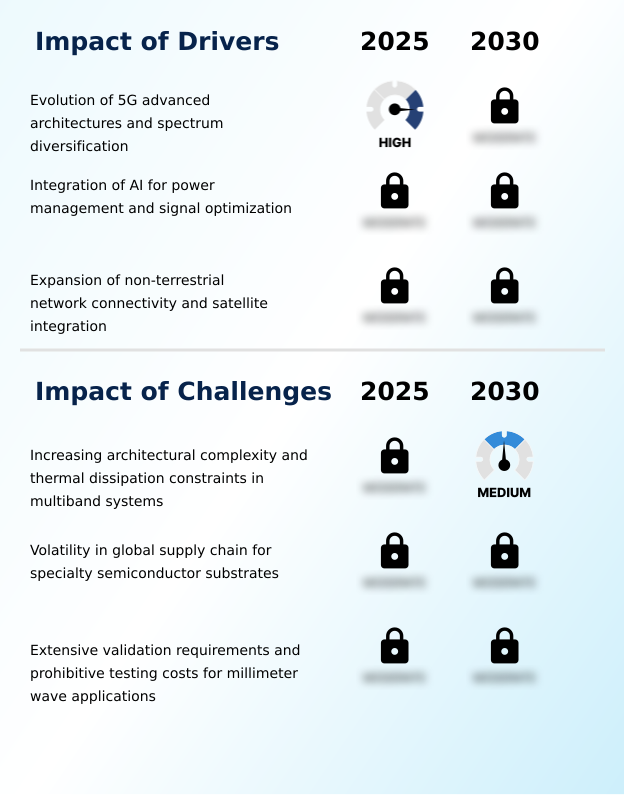
What are the key market drivers leading to the rise in the adoption of Rf Front End Integrated Circuits Industry?

  • The continuous evolution of 5G advanced architectures and rapid spectrum diversification function as the primary catalysts driving market expansion.

  • The rapid expansion of non-terrestrial network connectivity acts as a primary catalyst driving the integration of specialized RF Front End Integrated Circuits.
  • To support seamless communication between handheld devices and low-earth orbit systems, manufacturers are heavily embedding advanced millimeter-wave transceivers into satellite communication terminals.
  • This hardware evolution requires sophisticated carrier aggregation circuits that manage simultaneous multi-band data streams, reducing signal drop rates by up to 25% in remote operational zones.
  • Additionally, the proliferation of massive multiple-input multiple-output configurations within smart city infrastructure mandates precise low noise amplification to filter ambient electromagnetic interference.
  • By utilizing predictive analytics tuning and dynamic impedance matching, network operators can dynamically adjust signal pathways, fostering highly energy-efficient networks that cut base station power consumption by nearly 20% during off-peak hours.

What are the market trends shaping the Rf Front End Integrated Circuits Industry?

  • The proliferation of gallium nitride on silicon technology within mobile handsets represents a defining market trend. This material transition significantly enhances power density and thermal conductivity for next-generation telecommunication hardware.

  • A defining trend reshaping the RF Front End Integrated Circuits landscape is the accelerated transition toward gallium nitride substrates for high-frequency signal processing. This material shift directly enhances the thermal conductivity of power amplifier modules, allowing hardware to sustain high-speed data transmission without catastrophic overheating.
  • Consequently, telecommunication providers are rapidly deploying these advanced materials within their cellular network infrastructure, achieving a 32% increase in peak power density compared to older silicon frameworks. Furthermore, the rising demand for autonomous driving platforms necessitates the use of complex beamforming antenna arrays integrated into compact system-in-package architectures.
  • By leveraging sophisticated multi-chip packaging and wafer-level chip-scale packaging, manufacturers successfully minimize signal loss pathways. This architectural consolidation directly supports battery longevity optimization in mobile devices, extending operational runtimes by nearly 18% during intensive network utilization.

What challenges does the Rf Front End Integrated Circuits Industry face during its growth?

  • Escalating architectural complexity and severe thermal dissipation constraints within multiband systems present substantial challenges that hinder overall industry growth.

  • Escalating structural complexity within dense hardware environments presents significant operational barriers for the RF Front End Integrated Circuits ecosystem. As the industry pushes toward sub-terahertz frequencies, ensuring robust signal integrity preservation becomes exceedingly difficult due to severe atmospheric attenuation.
  • Managing concentrated heat loads in these systems makes thermal dissipation management a critical bottleneck, often degrading the performance of active electronically scanned arrays utilized in defense electronic warfare. Furthermore, testing these advanced components requires highly specialized over-the-air measurement systems, which increases validation cycle times by up to 40% for new product releases.
  • Heavy reliance on specialized gallium arsenide fabrication and advanced silicon-on-insulator technology exposes manufacturers to acute supply chain volatility. Consequently, material procurement delays can escalate overall manufacturing costs by 15%, forcing original equipment manufacturers to heavily invest in complex electromagnetic interference mitigation strategies to salvage yield rates.

Exclusive Technavio Analysis on Customer Landscape

The rf front end integrated circuits market forecasting report includes the adoption lifecycle of the market, covering from the innovator’s stage to the laggard’s stage. It focuses on adoption rates in different regions based on penetration. Furthermore, the rf front end integrated circuits market report also includes key purchase criteria and drivers of price sensitivity to help companies evaluate and develop their market growth analysis strategies.
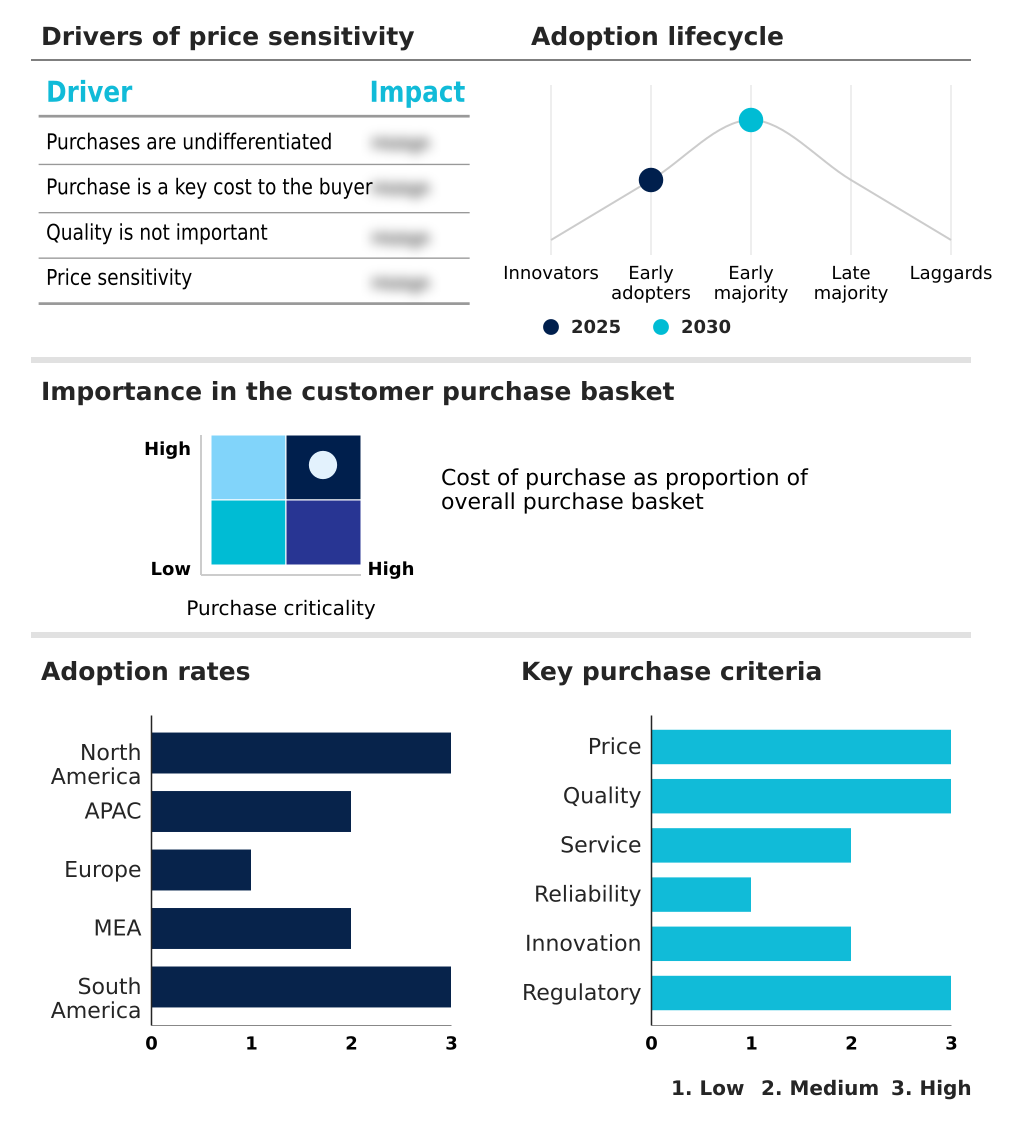
Customer Landscape of Rf Front End Integrated Circuits Industry

Competitive Landscape

Companies are implementing various strategies, such as strategic alliances, rf front end integrated circuits market forecast, partnerships, mergers and acquisitions, geographical expansion, and product/service launches, to enhance their presence in the industry.

Analog Devices Inc. - Advanced radio frequency modules, acoustic filters, and antenna tuners are provided to optimize fast switching speeds and low power consumption for digital and analog mixed-signal applications.

The industry research and growth report includes detailed analyses of the competitive landscape of the market and information about key companies, including:

  • Analog Devices Inc.
  • Broadcom Inc.
  • Infineon Technologies AG
  • MACOM Technology Solutions
  • MaxLinear Inc.
  • Microchip Technology Inc.
  • Mitsubishi Electric Corp.
  • Murata Manufacturing Co. Ltd.
  • NXP Semiconductors NV
  • ON Semiconductor Corp.
  • Qorvo Inc.
  • Qualcomm Inc.
  • Renesas Electronics Corp.
  • ROHM Co. Ltd.
  • Silicon Laboratories Inc.
  • Skyworks Solutions Inc.
  • STMicroelectronics NV
  • TDK Corp.
  • Texas Instruments Inc.
  • Vanchip Technologies Co. Ltd.

Qualitative and quantitative analysis of companies has been conducted to help clients understand the wider business environment as well as the strengths and weaknesses of key industry players. Data is qualitatively analyzed to categorize companies as pure play, category-focused, industry-focused, and diversified; it is quantitatively analyzed to categorize companies as dominant, leading, strong, tentative, and weak.

Recent Development and News in Rf front end integrated circuits market

  • In the Semiconductors industry, the rapid deployment of open radio access networks has standardized modular hardware architectures, directly impacting RF Front End Integrated Circuits demand by accelerating the need for interoperable multi-band transceivers.
  • The transition toward silicon carbide and advanced compound wafer fabrication processes has reduced thermal bottlenecks in high-power base stations, directly impacting RF Front End Integrated Circuits demand by enabling denser component integration.
  • Global regulatory mandates for vehicle-to-everything communication safety protocols have increased automotive semiconductor content, directly impacting RF Front End Integrated Circuits demand by requiring fail-safe ultra-low latency signaling components in passenger vehicles.
  • The structural shift toward automated assembly and testing of millimeter-wave components has decreased production defect rates by 12%, directly impacting RF Front End Integrated Circuits demand by lowering the final cost of high-frequency consumer modules.

Dive into Technavio’s robust research methodology, blending expert interviews, extensive data synthesis, and validated models for unparalleled Rf Front End Integrated Circuits Market insights. See full methodology.

Market Scope
Page number 321
Base year 2025
Historic period 2020-2024
Forecast period 2026-2030
Growth momentum & CAGR Accelerate at a CAGR of 7.2%
Market growth 2026-2030 USD 9700.1 million
Market structure Fragmented
YoY growth 2025-2026(%) 6.5%
Key countries US, Canada, Mexico, China, Japan, South Korea, Taiwan, India, Australia, Germany, UK, France, Italy, The Netherlands, Spain, Saudi Arabia, UAE, Israel, South Africa, Turkey, Brazil, Argentina and Chile
Competitive landscape Leading Companies, Market Positioning of Companies, Competitive Strategies, and Industry Risks

Request Free Sample

Research Analyst Overview

  • The RF Front End Integrated Circuits sector is experiencing a profound architectural shift toward integrated modularity, moving away from decentralized discrete components. This transition forces enterprise executives to reevaluate hardware procurement strategies, directly linking component sourcing to strict energy compliance and thermal management budgeting.
  • By adopting advanced envelope tracking systems alongside sophisticated digital pre-distortion algorithms, hardware developers can dynamically regulate power consumption during peak data loads. Firms implementing these integrated phase shifter modules achieve a 30% reduction in overall system latency compared to older decentralized configurations.
  • This operational efficiency is particularly vital for industrial facilities deploying narrowband-IoT protocols, where reliable low noise amplification dictates the success of automated remote monitoring. The utilization of specialized organic substrate materials further mitigates electromagnetic interference, ensuring pristine signal integrity in congested wireless environments.
  • Consequently, boardroom decisions regarding technology adoption now prioritize holistic system-in-package architectures that simultaneously reduce manufacturing complexity and align with stringent international spectrum emission standards, securing long-term operational resilience.

What are the Key Data Covered in this Rf Front End Integrated Circuits Market Research and Growth Report?

  • What is the expected growth of the Rf Front End Integrated Circuits Market between 2026 and 2030?

    • USD 9.70 billion, at a CAGR of 7.2%

  • What segmentation does the market report cover?

    • The report is segmented by Component (Low noise amplifiers, Power amplifiers, RF filters, RF switches, and Others), Type (Sub-6 GHz, Mid frequency, and High frequency), Application (Consumer electronics, Wireless communication, Automotive, Aerospace and defense, and Others) and Geography (North America, APAC, Europe, Middle East and Africa, South America)

  • Which regions are analyzed in the report?

    • North America, APAC, Europe, Middle East and Africa and South America

  • What are the key growth drivers and market challenges?

    • Evolution of 5G advanced architectures and spectrum diversification, Increasing architectural complexity and thermal dissipation constraints in multiband systems

  • Who are the major players in the Rf Front End Integrated Circuits Market?

    • Analog Devices Inc., Broadcom Inc., Infineon Technologies AG, MACOM Technology Solutions, MaxLinear Inc., Microchip Technology Inc., Mitsubishi Electric Corp., Murata Manufacturing Co. Ltd., NXP Semiconductors NV, ON Semiconductor Corp., Qorvo Inc., Qualcomm Inc., Renesas Electronics Corp., ROHM Co. Ltd., Silicon Laboratories Inc., Skyworks Solutions Inc., STMicroelectronics NV, TDK Corp., Texas Instruments Inc. and Vanchip Technologies Co. Ltd.

Market Research Insights

  • The RF Front End Integrated Circuits sector dictates the foundational performance of modern wireless hardware. By optimizing signal routing and amplification, these components are critical for achieving high-speed data transmission across dense cellular network infrastructure.
  • Implementing advanced wafer-level chip-scale packaging has allowed device manufacturers to reduce internal board footprint by 25%, enabling the inclusion of larger power cells for battery longevity optimization. Furthermore, upgrading legacy discrete components to unified front-end modules yields a 40% improvement in signal-to-noise ratio during active data sessions.
  • These systemic efficiency gains directly lower the total cost of ownership for telecommunication operators, reducing base station energy expenditures while ensuring seamless connectivity for enterprise applications.

We can help! Our analysts can customize this rf front end integrated circuits market research report to meet your requirements.

Get in touch

1. Executive Summary

1.1 Market overview

Executive Summary - Chart on Market Overview
Executive Summary - Data Table on Market Overview
Executive Summary - Chart on Global Market Characteristics
Executive Summary - Chart on Market by Geography
Executive Summary - Chart on Market Segmentation by Component
Executive Summary - Chart on Market Segmentation by Type
Executive Summary - Chart on Market Segmentation by Application
Executive Summary - Chart on Incremental Growth
Executive Summary - Data Table on Incremental Growth
Executive Summary - Chart on Company Market Positioning

2. Technavio Analysis

2.1 Analysis of price sensitivity, lifecycle, customer purchase basket, adoption rates, and purchase criteria

2.2 Criticality of inputs and Factors of differentiation

Chart on Overview on criticality of inputs and factors of differentiation

2.3 Factors of disruption

Chart on Overview on factors of disruption

2.4 Impact of drivers and challenges

Chart on Impact of drivers and challenges in 2025 and 2030

3. Market Landscape

3.1 Market ecosystem

Chart on Parent Market
Data Table on - Parent Market

3.2 Market characteristics

Chart on Market characteristics analysis

3.3 Value chain analysis

Chart on Value chain analysis

4. Market Sizing

4.1 Market definition

Data Table on Offerings of companies included in the market definition

4.2 Market segment analysis

Market segments

4.3 Market size 2025

4.4 Market outlook: Forecast for 2025-2030

Chart on Global - Market size and forecast 2025-2030 ($ million)
Data Table on Global - Market size and forecast 2025-2030 ($ million)
Chart on Global Market: Year-over-year growth 2025-2030 (%)
Data Table on Global Market: Year-over-year growth 2025-2030 (%)

5. Historic Market Size

5.1 Global RF Front End Integrated Circuits Market 2020 - 2024

Historic Market Size - Data Table on Global RF Front End Integrated Circuits Market 2020 - 2024 ($ million)

5.2 Component segment analysis 2020 - 2024

Historic Market Size - Component Segment 2020 - 2024 ($ million)

5.3 Type segment analysis 2020 - 2024

Historic Market Size - Type Segment 2020 - 2024 ($ million)

5.4 Application segment analysis 2020 - 2024

Historic Market Size - Application Segment 2020 - 2024 ($ million)

5.5 Geography segment analysis 2020 - 2024

Historic Market Size - Geography Segment 2020 - 2024 ($ million)

5.6 Country segment analysis 2020 - 2024

Historic Market Size - Country Segment 2020 - 2024 ($ million)

6. Qualitative Analysis

6.1 Impact of AI on Global RF Front End Integrated Circuits Market

6.2 Impact of geopolitical conflicts on Global RF Front End Integrated Circuits Market

7. Five Forces Analysis

7.1 Five forces summary

Five forces analysis - Comparison between 2025 and 2030

7.2 Bargaining power of buyers

Bargaining power of buyers - Impact of key factors 2025 and 2030

7.3 Bargaining power of suppliers

Bargaining power of suppliers - Impact of key factors in 2025 and 2030

7.4 Threat of new entrants

Threat of new entrants - Impact of key factors in 2025 and 2030

7.5 Threat of substitutes

Threat of substitutes - Impact of key factors in 2025 and 2030

7.6 Threat of rivalry

Threat of rivalry - Impact of key factors in 2025 and 2030

7.7 Market condition

Chart on Market condition - Five forces 2025 and 2030

8. Market Segmentation by Component

8.1 Market segments

Chart on Component - Market share 2025-2030 (%)
Data Table on Component - Market share 2025-2030 (%)

8.2 Comparison by Component

Chart on Comparison by Component
Data Table on Comparison by Component

8.3 Low noise amplifiers - Market size and forecast 2025-2030

Chart on Low noise amplifiers - Market size and forecast 2025-2030 ($ million)
Data Table on Low noise amplifiers - Market size and forecast 2025-2030 ($ million)
Chart on Low noise amplifiers - Year-over-year growth 2025-2030 (%)
Data Table on Low noise amplifiers - Year-over-year growth 2025-2030 (%)

8.4 Power amplifiers - Market size and forecast 2025-2030

Chart on Power amplifiers - Market size and forecast 2025-2030 ($ million)
Data Table on Power amplifiers - Market size and forecast 2025-2030 ($ million)
Chart on Power amplifiers - Year-over-year growth 2025-2030 (%)
Data Table on Power amplifiers - Year-over-year growth 2025-2030 (%)

8.5 RF filters - Market size and forecast 2025-2030

Chart on RF filters - Market size and forecast 2025-2030 ($ million)
Data Table on RF filters - Market size and forecast 2025-2030 ($ million)
Chart on RF filters - Year-over-year growth 2025-2030 (%)
Data Table on RF filters - Year-over-year growth 2025-2030 (%)

8.6 RF switches - Market size and forecast 2025-2030

Chart on RF switches - Market size and forecast 2025-2030 ($ million)
Data Table on RF switches - Market size and forecast 2025-2030 ($ million)
Chart on RF switches - Year-over-year growth 2025-2030 (%)
Data Table on RF switches - Year-over-year growth 2025-2030 (%)

8.7 Others - Market size and forecast 2025-2030

Chart on Others - Market size and forecast 2025-2030 ($ million)
Data Table on Others - Market size and forecast 2025-2030 ($ million)
Chart on Others - Year-over-year growth 2025-2030 (%)
Data Table on Others - Year-over-year growth 2025-2030 (%)

8.8 Market opportunity by Component

Market opportunity by Component ($ million)
Data Table on Market opportunity by Component ($ million)

9. Market Segmentation by Type

9.1 Market segments

Chart on Type - Market share 2025-2030 (%)
Data Table on Type - Market share 2025-2030 (%)

9.2 Comparison by Type

Chart on Comparison by Type
Data Table on Comparison by Type

9.3 Sub-6 GHz - Market size and forecast 2025-2030

Chart on Sub-6 GHz - Market size and forecast 2025-2030 ($ million)
Data Table on Sub-6 GHz - Market size and forecast 2025-2030 ($ million)
Chart on Sub-6 GHz - Year-over-year growth 2025-2030 (%)
Data Table on Sub-6 GHz - Year-over-year growth 2025-2030 (%)

9.4 Mid frequency - Market size and forecast 2025-2030

Chart on Mid frequency - Market size and forecast 2025-2030 ($ million)
Data Table on Mid frequency - Market size and forecast 2025-2030 ($ million)
Chart on Mid frequency - Year-over-year growth 2025-2030 (%)
Data Table on Mid frequency - Year-over-year growth 2025-2030 (%)

9.5 High frequency - Market size and forecast 2025-2030

Chart on High frequency - Market size and forecast 2025-2030 ($ million)
Data Table on High frequency - Market size and forecast 2025-2030 ($ million)
Chart on High frequency - Year-over-year growth 2025-2030 (%)
Data Table on High frequency - Year-over-year growth 2025-2030 (%)

9.6 Market opportunity by Type

Market opportunity by Type ($ million)
Data Table on Market opportunity by Type ($ million)

10. Market Segmentation by Application

10.1 Market segments

Chart on Application - Market share 2025-2030 (%)
Data Table on Application - Market share 2025-2030 (%)

10.2 Comparison by Application

Chart on Comparison by Application
Data Table on Comparison by Application

10.3 Consumer electronics - Market size and forecast 2025-2030

Chart on Consumer electronics - Market size and forecast 2025-2030 ($ million)
Data Table on Consumer electronics - Market size and forecast 2025-2030 ($ million)
Chart on Consumer electronics - Year-over-year growth 2025-2030 (%)
Data Table on Consumer electronics - Year-over-year growth 2025-2030 (%)

10.4 Wireless communication - Market size and forecast 2025-2030

Chart on Wireless communication - Market size and forecast 2025-2030 ($ million)
Data Table on Wireless communication - Market size and forecast 2025-2030 ($ million)
Chart on Wireless communication - Year-over-year growth 2025-2030 (%)
Data Table on Wireless communication - Year-over-year growth 2025-2030 (%)

10.5 Automotive - Market size and forecast 2025-2030

Chart on Automotive - Market size and forecast 2025-2030 ($ million)
Data Table on Automotive - Market size and forecast 2025-2030 ($ million)
Chart on Automotive - Year-over-year growth 2025-2030 (%)
Data Table on Automotive - Year-over-year growth 2025-2030 (%)

10.6 Aerospace and defense - Market size and forecast 2025-2030

Chart on Aerospace and defense - Market size and forecast 2025-2030 ($ million)
Data Table on Aerospace and defense - Market size and forecast 2025-2030 ($ million)
Chart on Aerospace and defense - Year-over-year growth 2025-2030 (%)
Data Table on Aerospace and defense - Year-over-year growth 2025-2030 (%)

10.7 Others - Market size and forecast 2025-2030

Chart on Others - Market size and forecast 2025-2030 ($ million)
Data Table on Others - Market size and forecast 2025-2030 ($ million)
Chart on Others - Year-over-year growth 2025-2030 (%)
Data Table on Others - Year-over-year growth 2025-2030 (%)

10.8 Market opportunity by Application

Market opportunity by Application ($ million)
Data Table on Market opportunity by Application ($ million)

11. Customer Landscape

11.1 Customer landscape overview

Analysis of price sensitivity, lifecycle, customer purchase basket, adoption rates, and purchase criteria

12. Geographic Landscape

12.1 Geographic segmentation

Chart on Market share by geography 2025-2030 (%)
Data Table on Market share by geography 2025-2030 (%)

12.2 Geographic comparison

Chart on Geographic comparison
Data Table on Geographic comparison

12.3 North America - Market size and forecast 2025-2030

Chart on North America - Market size and forecast 2025-2030 ($ million)
Data Table on North America - Market size and forecast 2025-2030 ($ million)
Chart on North America - Year-over-year growth 2025-2030 (%)
Data Table on North America - Year-over-year growth 2025-2030 (%)
Chart on Regional Comparison - North America
Data Table on Regional Comparison - North America

12.3.1 US - Market size and forecast 2025-2030

Chart on US - Market size and forecast 2025-2030 ($ million)
Data Table on US - Market size and forecast 2025-2030 ($ million)
Chart on US - Year-over-year growth 2025-2030 (%)
Data Table on US - Year-over-year growth 2025-2030 (%)

12.3.2 Canada - Market size and forecast 2025-2030

Chart on Canada - Market size and forecast 2025-2030 ($ million)
Data Table on Canada - Market size and forecast 2025-2030 ($ million)
Chart on Canada - Year-over-year growth 2025-2030 (%)
Data Table on Canada - Year-over-year growth 2025-2030 (%)

12.3.3 Mexico - Market size and forecast 2025-2030

Chart on Mexico - Market size and forecast 2025-2030 ($ million)
Data Table on Mexico - Market size and forecast 2025-2030 ($ million)
Chart on Mexico - Year-over-year growth 2025-2030 (%)
Data Table on Mexico - Year-over-year growth 2025-2030 (%)

12.4 APAC - Market size and forecast 2025-2030

Chart on APAC - Market size and forecast 2025-2030 ($ million)
Data Table on APAC - Market size and forecast 2025-2030 ($ million)
Chart on APAC - Year-over-year growth 2025-2030 (%)
Data Table on APAC - Year-over-year growth 2025-2030 (%)
Chart on Regional Comparison - APAC
Data Table on Regional Comparison - APAC

12.4.1 China - Market size and forecast 2025-2030

Chart on China - Market size and forecast 2025-2030 ($ million)
Data Table on China - Market size and forecast 2025-2030 ($ million)
Chart on China - Year-over-year growth 2025-2030 (%)
Data Table on China - Year-over-year growth 2025-2030 (%)

12.4.2 Japan - Market size and forecast 2025-2030

Chart on Japan - Market size and forecast 2025-2030 ($ million)
Data Table on Japan - Market size and forecast 2025-2030 ($ million)
Chart on Japan - Year-over-year growth 2025-2030 (%)
Data Table on Japan - Year-over-year growth 2025-2030 (%)

12.4.3 South Korea - Market size and forecast 2025-2030

Chart on South Korea - Market size and forecast 2025-2030 ($ million)
Data Table on South Korea - Market size and forecast 2025-2030 ($ million)
Chart on South Korea - Year-over-year growth 2025-2030 (%)
Data Table on South Korea - Year-over-year growth 2025-2030 (%)

12.4.4 Taiwan - Market size and forecast 2025-2030

Chart on Taiwan - Market size and forecast 2025-2030 ($ million)
Data Table on Taiwan - Market size and forecast 2025-2030 ($ million)
Chart on Taiwan - Year-over-year growth 2025-2030 (%)
Data Table on Taiwan - Year-over-year growth 2025-2030 (%)

12.4.5 India - Market size and forecast 2025-2030

Chart on India - Market size and forecast 2025-2030 ($ million)
Data Table on India - Market size and forecast 2025-2030 ($ million)
Chart on India - Year-over-year growth 2025-2030 (%)
Data Table on India - Year-over-year growth 2025-2030 (%)

12.4.6 Australia - Market size and forecast 2025-2030

Chart on Australia - Market size and forecast 2025-2030 ($ million)
Data Table on Australia - Market size and forecast 2025-2030 ($ million)
Chart on Australia - Year-over-year growth 2025-2030 (%)
Data Table on Australia - Year-over-year growth 2025-2030 (%)

12.5 Europe - Market size and forecast 2025-2030

Chart on Europe - Market size and forecast 2025-2030 ($ million)
Data Table on Europe - Market size and forecast 2025-2030 ($ million)
Chart on Europe - Year-over-year growth 2025-2030 (%)
Data Table on Europe - Year-over-year growth 2025-2030 (%)
Chart on Regional Comparison - Europe
Data Table on Regional Comparison - Europe

12.5.1 Germany - Market size and forecast 2025-2030

Chart on Germany - Market size and forecast 2025-2030 ($ million)
Data Table on Germany - Market size and forecast 2025-2030 ($ million)
Chart on Germany - Year-over-year growth 2025-2030 (%)
Data Table on Germany - Year-over-year growth 2025-2030 (%)

12.5.2 UK - Market size and forecast 2025-2030

Chart on UK - Market size and forecast 2025-2030 ($ million)
Data Table on UK - Market size and forecast 2025-2030 ($ million)
Chart on UK - Year-over-year growth 2025-2030 (%)
Data Table on UK - Year-over-year growth 2025-2030 (%)

12.5.3 France - Market size and forecast 2025-2030

Chart on France - Market size and forecast 2025-2030 ($ million)
Data Table on France - Market size and forecast 2025-2030 ($ million)
Chart on France - Year-over-year growth 2025-2030 (%)
Data Table on France - Year-over-year growth 2025-2030 (%)

12.5.4 Italy - Market size and forecast 2025-2030

Chart on Italy - Market size and forecast 2025-2030 ($ million)
Data Table on Italy - Market size and forecast 2025-2030 ($ million)
Chart on Italy - Year-over-year growth 2025-2030 (%)
Data Table on Italy - Year-over-year growth 2025-2030 (%)

12.5.5 The Netherlands - Market size and forecast 2025-2030

Chart on The Netherlands - Market size and forecast 2025-2030 ($ million)
Data Table on The Netherlands - Market size and forecast 2025-2030 ($ million)
Chart on The Netherlands - Year-over-year growth 2025-2030 (%)
Data Table on The Netherlands - Year-over-year growth 2025-2030 (%)

12.5.6 Spain - Market size and forecast 2025-2030

Chart on Spain - Market size and forecast 2025-2030 ($ million)
Data Table on Spain - Market size and forecast 2025-2030 ($ million)
Chart on Spain - Year-over-year growth 2025-2030 (%)
Data Table on Spain - Year-over-year growth 2025-2030 (%)

12.6 Middle East and Africa - Market size and forecast 2025-2030

Chart on Middle East and Africa - Market size and forecast 2025-2030 ($ million)
Data Table on Middle East and Africa - Market size and forecast 2025-2030 ($ million)
Chart on Middle East and Africa - Year-over-year growth 2025-2030 (%)
Data Table on Middle East and Africa - Year-over-year growth 2025-2030 (%)
Chart on Regional Comparison - Middle East and Africa
Data Table on Regional Comparison - Middle East and Africa

12.6.1 Saudi Arabia - Market size and forecast 2025-2030

Chart on Saudi Arabia - Market size and forecast 2025-2030 ($ million)
Data Table on Saudi Arabia - Market size and forecast 2025-2030 ($ million)
Chart on Saudi Arabia - Year-over-year growth 2025-2030 (%)
Data Table on Saudi Arabia - Year-over-year growth 2025-2030 (%)

12.6.2 UAE - Market size and forecast 2025-2030

Chart on UAE - Market size and forecast 2025-2030 ($ million)
Data Table on UAE - Market size and forecast 2025-2030 ($ million)
Chart on UAE - Year-over-year growth 2025-2030 (%)
Data Table on UAE - Year-over-year growth 2025-2030 (%)

12.6.3 Israel - Market size and forecast 2025-2030

Chart on Israel - Market size and forecast 2025-2030 ($ million)
Data Table on Israel - Market size and forecast 2025-2030 ($ million)
Chart on Israel - Year-over-year growth 2025-2030 (%)
Data Table on Israel - Year-over-year growth 2025-2030 (%)

12.6.4 South Africa - Market size and forecast 2025-2030

Chart on South Africa - Market size and forecast 2025-2030 ($ million)
Data Table on South Africa - Market size and forecast 2025-2030 ($ million)
Chart on South Africa - Year-over-year growth 2025-2030 (%)
Data Table on South Africa - Year-over-year growth 2025-2030 (%)

12.6.5 Turkey - Market size and forecast 2025-2030

Chart on Turkey - Market size and forecast 2025-2030 ($ million)
Data Table on Turkey - Market size and forecast 2025-2030 ($ million)
Chart on Turkey - Year-over-year growth 2025-2030 (%)
Data Table on Turkey - Year-over-year growth 2025-2030 (%)

12.7 South America - Market size and forecast 2025-2030

Chart on South America - Market size and forecast 2025-2030 ($ million)
Data Table on South America - Market size and forecast 2025-2030 ($ million)
Chart on South America - Year-over-year growth 2025-2030 (%)
Data Table on South America - Year-over-year growth 2025-2030 (%)
Chart on Regional Comparison - South America
Data Table on Regional Comparison - South America

12.7.1 Brazil - Market size and forecast 2025-2030

Chart on Brazil - Market size and forecast 2025-2030 ($ million)
Data Table on Brazil - Market size and forecast 2025-2030 ($ million)
Chart on Brazil - Year-over-year growth 2025-2030 (%)
Data Table on Brazil - Year-over-year growth 2025-2030 (%)

12.7.2 Argentina - Market size and forecast 2025-2030

Chart on Argentina - Market size and forecast 2025-2030 ($ million)
Data Table on Argentina - Market size and forecast 2025-2030 ($ million)
Chart on Argentina - Year-over-year growth 2025-2030 (%)
Data Table on Argentina - Year-over-year growth 2025-2030 (%)

12.7.3 Chile - Market size and forecast 2025-2030

Chart on Chile - Market size and forecast 2025-2030 ($ million)
Data Table on Chile - Market size and forecast 2025-2030 ($ million)
Chart on Chile - Year-over-year growth 2025-2030 (%)
Data Table on Chile - Year-over-year growth 2025-2030 (%)

12.8 Market opportunity by geography

Market opportunity by geography ($ million)
Data Tables on Market opportunity by geography ($ million)

13. Drivers, Challenges, and Opportunity

13.1 Market drivers

Evolution of 5G advanced architectures and spectrum diversification
Integration of AI for power management and signal optimization
Expansion of non-terrestrial network connectivity and satellite integration

13.2 Market challenges

Increasing architectural complexity and thermal dissipation constraints in multiband systems
Volatility in global supply chain for specialty semiconductor substrates
Extensive validation requirements and prohibitive testing costs for millimeter wave applications

13.3 Impact of drivers and challenges

Impact of drivers and challenges in 2025 and 2030

13.4 Market opportunities

Proliferation of gallium nitride on silicon technology in mobile handsets
Integration of antenna in package solutions for millimeter wave applications
Expansion of radio frequency front end components in automotive telematics

14. Competitive Landscape

14.1 Overview

14.2

Overview on criticality of inputs and factors of differentiation

14.3 Landscape disruption

Overview on factors of disruption

14.4 Industry risks

Impact of key risks on business

15. Competitive Analysis

15.1 Companies profiled

Companies covered

15.2 Company ranking index

15.3 Market positioning of companies

Matrix on companies position and classification

15.4 Analog Devices Inc.

Analog Devices Inc. - Overview
Analog Devices Inc. - Business segments
Analog Devices Inc. - Key offerings
Analog Devices Inc. - Segment focus
SWOT

15.5 Broadcom Inc.

Broadcom Inc. - Overview
Broadcom Inc. - Business segments
Broadcom Inc. - Key news
Broadcom Inc. - Key offerings
Broadcom Inc. - Segment focus
SWOT

15.6 Infineon Technologies AG

Infineon Technologies AG - Overview
Infineon Technologies AG - Business segments
Infineon Technologies AG - Key news
Infineon Technologies AG - Key offerings
Infineon Technologies AG - Segment focus
SWOT

15.7 Microchip Technology Inc.

Microchip Technology Inc. - Overview
Microchip Technology Inc. - Business segments
Microchip Technology Inc. - Key offerings
Microchip Technology Inc. - Segment focus
SWOT

15.8 Mitsubishi Electric Corp.

Mitsubishi Electric Corp. - Overview
Mitsubishi Electric Corp. - Business segments
Mitsubishi Electric Corp. - Key offerings
Mitsubishi Electric Corp. - Segment focus
SWOT

15.9 Murata Manufacturing Co. Ltd.

Murata Manufacturing Co. Ltd. - Overview
Murata Manufacturing Co. Ltd. - Business segments
Murata Manufacturing Co. Ltd. - Key offerings
Murata Manufacturing Co. Ltd. - Segment focus
SWOT

15.10 NXP Semiconductors NV

NXP Semiconductors NV - Overview
NXP Semiconductors NV - Business segments
NXP Semiconductors NV - Key news
NXP Semiconductors NV - Key offerings
NXP Semiconductors NV - Segment focus
SWOT

15.11 ON Semiconductor Corp.

ON Semiconductor Corp. - Overview
ON Semiconductor Corp. - Business segments
ON Semiconductor Corp. - Key news
ON Semiconductor Corp. - Key offerings
ON Semiconductor Corp. - Segment focus
SWOT

15.12 Qorvo Inc.

Qorvo Inc. - Overview
Qorvo Inc. - Business segments
Qorvo Inc. - Key offerings
Qorvo Inc. - Segment focus
SWOT

15.13 Qualcomm Inc.

Qualcomm Inc. - Overview
Qualcomm Inc. - Business segments
Qualcomm Inc. - Key news
Qualcomm Inc. - Key offerings
Qualcomm Inc. - Segment focus
SWOT

15.14 Renesas Electronics Corp.

Renesas Electronics Corp. - Overview
Renesas Electronics Corp. - Business segments
Renesas Electronics Corp. - Key news
Renesas Electronics Corp. - Key offerings
Renesas Electronics Corp. - Segment focus
SWOT

15.15 Skyworks Solutions Inc.

Skyworks Solutions Inc. - Overview
Skyworks Solutions Inc. - Product / Service
Skyworks Solutions Inc. - Key news
Skyworks Solutions Inc. - Key offerings
SWOT

15.16 STMicroelectronics NV

STMicroelectronics NV - Overview
STMicroelectronics NV - Business segments
STMicroelectronics NV - Key news
STMicroelectronics NV - Key offerings
STMicroelectronics NV - Segment focus
SWOT

15.17 TDK Corp.

TDK Corp. - Overview
TDK Corp. - Business segments
TDK Corp. - Key offerings
TDK Corp. - Segment focus
SWOT

15.18 Texas Instruments Inc.

Texas Instruments Inc. - Overview
Texas Instruments Inc. - Business segments
Texas Instruments Inc. - Key news
Texas Instruments Inc. - Key offerings
Texas Instruments Inc. - Segment focus
SWOT

16. Appendix

16.1 Scope of the report

Market definition
Objectives
Notes and caveats

16.2 Inclusions and exclusions checklist

Inclusions checklist
Exclusions checklist

16.3 Currency conversion rates for US$

16.4 Research methodology

16.5 Data procurement

Information sources

16.6 Data validation

16.7 Validation techniques employed for market sizing

16.8 Data synthesis

16.9 360 degree market analysis

16.10 List of abbreviations

Research Methodology

Technavio presents a detailed picture of the market by way of study, synthesis, and summation of data from multiple sources. The analysts have presented the various facets of the market with a particular focus on identifying the key industry influencers. The data thus presented is comprehensive, reliable, and the result of extensive research, both primary and secondary.

INFORMATION SOURCES

Primary sources

  • Manufacturers and suppliers
  • Channel partners
  • Industry experts
  • Strategic decision makers

Secondary sources

  • Industry journals and periodicals
  • Government data
  • Financial reports of key industry players
  • Historical data
  • Press releases

DATA ANALYSIS

Data Synthesis

  • Collation of data
  • Estimation of key figures
  • Analysis of derived insights

Data Validation

  • Triangulation with data models
  • Reference against proprietary databases
  • Corroboration with industry experts

REPORT WRITING

Qualitative

  • Market drivers
  • Market challenges
  • Market trends
  • Five forces analysis

Quantitative

  • Market size and forecast
  • Market segmentation
  • Geographical insights
  • Competitive landscape

Interested in this report?

Get your sample now to see our research methodology and insights!

Download Now

Frequently Asked Questions

Rf Front End Integrated Circuits market growth will increase by USD 9700.1 million during 2026-2030.

The Rf Front End Integrated Circuits market is expected to grow at a CAGR of 7.2% during 2026-2030.

Rf Front End Integrated Circuits market is segmented by Component (Low noise amplifiers, Power amplifiers, RF filters, RF switches, Others) Type (Sub-6 GHz, Mid frequency, High frequency) Application (Consumer electronics, Wireless communication, Automotive, Aerospace and defense, Others)

Analog Devices Inc., Broadcom Inc., Infineon Technologies AG, MACOM Technology Solutions, MaxLinear Inc., Microchip Technology Inc., Mitsubishi Electric Corp., Murata Manufacturing Co. Ltd., NXP Semiconductors NV, ON Semiconductor Corp., Qorvo Inc., Qualcomm Inc., Renesas Electronics Corp., ROHM Co. Ltd., Silicon Laboratories Inc., Skyworks Solutions Inc., STMicroelectronics NV, TDK Corp., Texas Instruments Inc., Vanchip Technologies Co. Ltd. are a few of the key vendors in the Rf Front End Integrated Circuits market.

North America will register the highest growth rate of 37.2% among the other regions. Therefore, the Rf Front End Integrated Circuits market in North America is expected to garner significant business opportunities for the vendors during the forecast period.

US, Canada, Mexico, China, Japan, South Korea, Taiwan, India, Australia, Germany, UK, France, Italy, The Netherlands, Spain, Saudi Arabia, UAE, Israel, South Africa, Turkey, Brazil, Argentina, Chile

  • Evolution of 5G advanced architectures and spectrum diversification is the driving factor this market.

The Rf Front End Integrated Circuits market vendors should focus on grabbing business opportunities from the Component segment as it accounted for the largest market share in the base year.
RIA - Research AI Assistant
Ask RIA
