
Ride Hailing Services Market Size 2025-2029
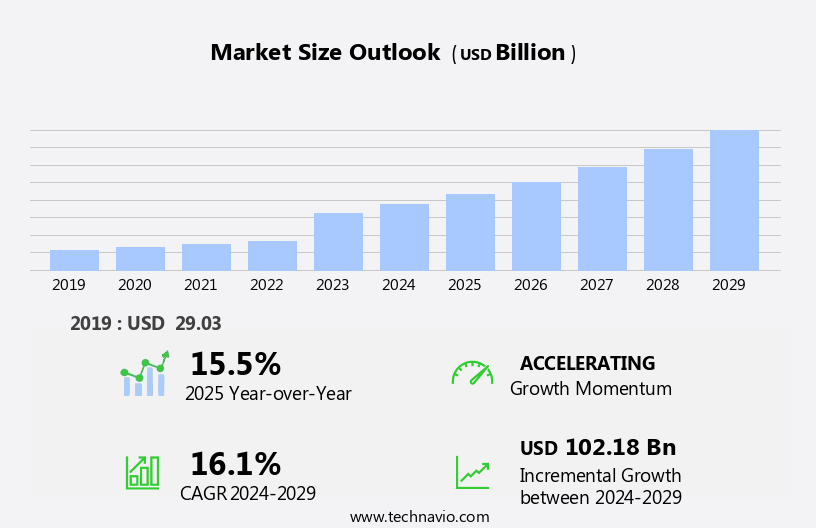
The ride hailing services market size is forecast to increase by USD 102.18 billion at a CAGR of 16.1% between 2024 and 2029.
- The market is experiencing significant growth, driven by the increasing preference for convenient and flexible transportation solutions among consumers. The market is witnessing a in the use of online ride hailing services, with more people opting for this mode of transportation due to its ease, affordability, and accessibility. Furthermore, merger and acquisition activities are on the rise in The market, as companies seek to expand their reach and strengthen their market position. However, compliance with government regulations remains a key challenge for players in this market. Governments worldwide are implementing stringent regulations to ensure the safety and security of ride hailing services, which can impact market growth.
- Companies must navigate these regulations effectively to capitalize on the market opportunities and maintain a competitive edge. In summary, the market is poised for continued growth, driven by consumer demand and merger and acquisition activities. However, compliance with government regulations presents a significant challenge that companies must address to succeed in this dynamic market. Companies seeking to capitalize on market opportunities and navigate challenges effectively must stay informed of regulatory developments and invest in technologies and strategies that enable compliance while enhancing the user experience.
What will be the Size of the Ride Hailing Services Market during the forecast period?
- The market in the United States has experienced significant activity and growth in recent years, driven by increasing consumer demand for convenient and flexible transportation solutions. The market's size is substantial, with millions of automobile journeys facilitated daily through digital platforms. The sector's expansion is fueled by various factors, including the integration of advanced technologies such as fleet conversion to electric vehicles (EVs) and the implementation of safety measures like digital thermometers and sanitizers to mitigate the spread of the virus. Barriers to entry, such as regulatory hurdles and the need for substantial capital investment, have not deterred new players from entering the market.
- Companies are also exploring the adoption of self-driving cars to reduce emissions and enhance operational efficiency. The ride hailing sector continues to evolve, with D1 Capital Partners' investment in an EV fleet and the EU's top court ruling on the legality of ride-sharing services being recent developments. Despite challenges posed by the virus infection and congestion concerns, the market's future direction remains positive.
How is this Ride Hailing Services Industry segmented?
The ride hailing services industry research report provides comprehensive data (region-wise segment analysis), with forecasts and estimates in "USD billion" for the period 2025-2029, as well as historical data from 2019-2023 for the following segments.
- Application
- Car sharing
- E-hailing
- Mode Of Booking
- Online
- Offline
- Vehicle Type
- Four wheelers
- Two wheelers
- Three wheelers
- Geography
- APAC
- China
- India
- Japan
- North America
- US
- Canada
- Mexico
- Europe
- France
- Germany
- UK
- South America
- Brazil
- Middle East and Africa
- APAC
By Application Insights
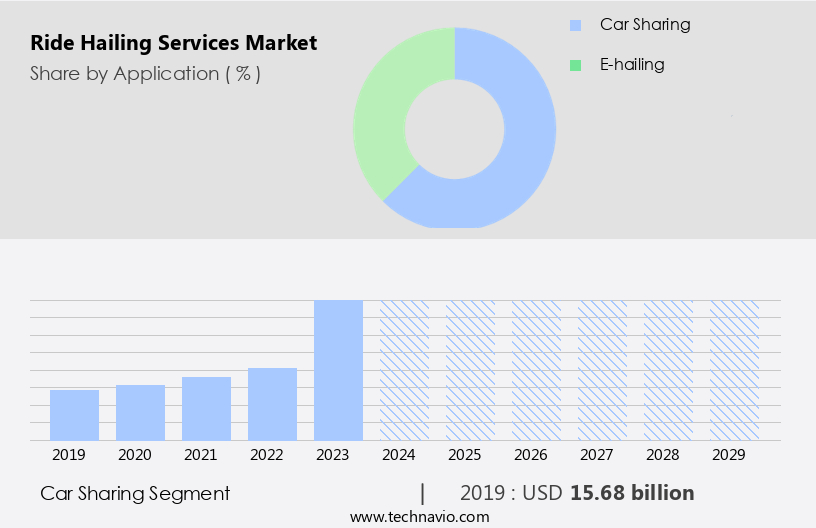
The car sharing segment is estimated to witness significant growth during the forecast period.
The market is witnessing significant growth due to the increasing adoption of digitally enabled car-sharing services. This model, where multiple individuals share the use of a vehicle and pay for the usage, is particularly popular in cities with insufficient public transportation systems or where they are inaccessible. Companies such as Uber Technologies Inc., Lyft Inc., and ANI Technologies Pvt. Ltd. Have recognized this potential and have introduced car sharing options. For instance, Uber's Uber Pool feature allows multiple passengers to travel together in one vehicle, reducing costs and environmental impact. The market is also focusing on measures to ensure passenger safety and convenience, such as sanitizers, digital thermometers, and smart wearables.
Emission norms are another factor driving innovation in the market, with companies converting their fleets to electric vehicles (EVs) from manufacturers like Renault, BYD, and XPRES-T EV units. The rising population and increasing interest in mobility-as-a-service (MaaS) are also contributing to the growth of the market. Despite these opportunities, challenges such as traffic congestion, wait times, and virus infection remain. However, companies are addressing these issues through service innovation and partnerships with banks, lenders, and vehicle maintenance providers like EVgo. Safety remains a top priority, with companies implementing measures such as self-driving cars and smartphone applications to enhance user-friendliness and convenience.
The e-hailing market segment, including ridesharing and MaaS, is expected to continue its growth trajectory, driven by factors such as fuel prices, vehicle maintenance costs, and the convenience of on-demand transportation.
Get a glance at the market report of share of various segments Request Free Sample
The Car sharing segment was valued at USD 15.68 billion in 2019 and showed a gradual increase during the forecast period.
Regional Analysis
APAC is estimated to contribute 31% to the growth of the global market during the forecast period.Technavio’s analysts have elaborately explained the regional trends and drivers that shape the market during the forecast period.

For more insights on the market size of various regions, Request Free Sample
The market in APAC is experiencing significant growth due to several factors. The increasing urban population and rising disposable income are driving the demand for convenient and digitally enabled car-sharing services. The growing adoption of smartphone devices and internet services has facilitated the use of ride-hailing apps, making transportation more accessible and user-friendly. Additionally, the presence of global and local companies, such as Bolt, BluSmart Mobility, and Uber, is fostering competition and innovation in the market. The spread of the virus and subsequent worldwide lockdowns have led to an increase in wait times for public transportation modes and a shift towards ride hailing services for passenger comfort and safety.
The market is also witnessing a trend towards the adoption of electric vehicles (EVs) and fleet conversion by companies like Renault and BYD. However, there are barriers to entry, such as emission norms, vehicle maintenance costs, and interest rates set by banks, that may impact the growth of the ride hailing market. Despite these challenges, the market is expected to continue growing due to the convenience and time-saving benefits it offers, especially in densely populated areas where traffic congestion is a significant issue. The e-hailing market segment, including Mobility-as-a-Service (MaaS) and ridesharing sector, is expected to witness significant growth in the coming years.
Companies are focusing on service innovation and reducing wait times to enhance the user experience and differentiate themselves from competitors. The market is also witnessing the adoption of smart wearables and digital thermometers to ensure passenger safety during the ongoing virus infection. The ride hailing market is expected to continue growing due to the increasing popularity of ride-sharing services, the availability of EV fleet options, and the need for convenient and safe transportation solutions. Companies are focusing on innovation and user-friendliness to meet the evolving needs of consumers and stay competitive in the market.
Market Dynamics
Our researchers analyzed the data with 2024 as the base year, along with the key drivers, trends, and challenges. A holistic analysis of drivers will help companies refine their marketing strategies to gain a competitive advantage.
What are the key market drivers leading to the rise in the adoption of Ride Hailing Services Industry?
- Rising use of online ride hailing services is the key driver of the market.
- The market is experiencing significant growth due to the increasing adoption of user-friendly mobile applications that enable consumers to book rides conveniently using their smartphones. Uber Technologies Inc. And Grab Holdings Ltd. Are prominent players in this market, leading the way in their respective countries. Investments from venture capitalists have enabled these companies and others to expand into untapped developed and developing markets, offering ample opportunities for growth and increased revenue. Moreover, urbanization in the Asia Pacific region is accelerating, creating a favorable environment for the expansion of ride hailing services. This trend is expected to continue, providing further opportunities for market participants to establish a strong presence and capitalize on the growing demand for convenient and affordable transportation solutions.
- The market's growth is driven by the convenience and flexibility offered by ride hailing services, which cater to the increasing mobility needs of consumers in both developed and developing economies. The integration of advanced technologies, such as artificial intelligence and machine learning, is also enhancing the user experience and enabling providers to offer more personalized services. In , the market is poised for continued growth, driven by increasing urbanization, technological advancements, and the convenience and flexibility offered by these services. Companies that can effectively leverage these trends and adapt to the evolving market dynamics will be well-positioned to succeed in this dynamic and competitive market.
What are the market trends shaping the Ride Hailing Services Industry?
- Growing merger and acquisition activities in global ride hailing services market is the upcoming market trend.
- The market is experiencing notable growth through strategic alliances and partnerships among competing companies and service providers. These collaborations enable ride hailing businesses to expand their reach and improve operations. Mergers and acquisitions serve as key growth strategies, allowing companies to enter new markets and strengthen their presence in existing ones. By acquiring local players or partnering with them, ride hailing services can swiftly gain access to new territories and establish a stronger market position.
- Mergers and acquisitions also provide an opportunity for companies to broaden their offerings and enhance their service portfolios. This market trend underscores the increasing competition and the importance of strategic partnerships and expansion in the ride hailing industry.
What challenges does the Ride Hailing Services Industry face during its growth?
- Compliance with government regulations in ride hailing services is a key challenge affecting the industry growth.
- Ride hailing services have become a popular mode of transportation in many parts of the world. However, these services are not without regulatory oversight. Governments and environmental agencies are implementing stringent regulations to minimize the environmental impact of ride hailing services. For instance, the Environmental Protection Agency (EPA) in Ghana enforces an act for motor emissions, ensuring all vehicles and motorized equipment meet acceptable emission standards. Similarly, the Road Traffic Act of the UK mandates annual Ministry of Transport (MOT) tests to maintain vehicle emissions within acceptable levels.
- These regulations aim to reduce the emission of gases such as nitrogen oxides, carbon monoxide, and carbon dioxide, which contribute to air pollution. Compliance with these regulations is essential for ride hailing service providers to ensure sustainable and eco-friendly operations.
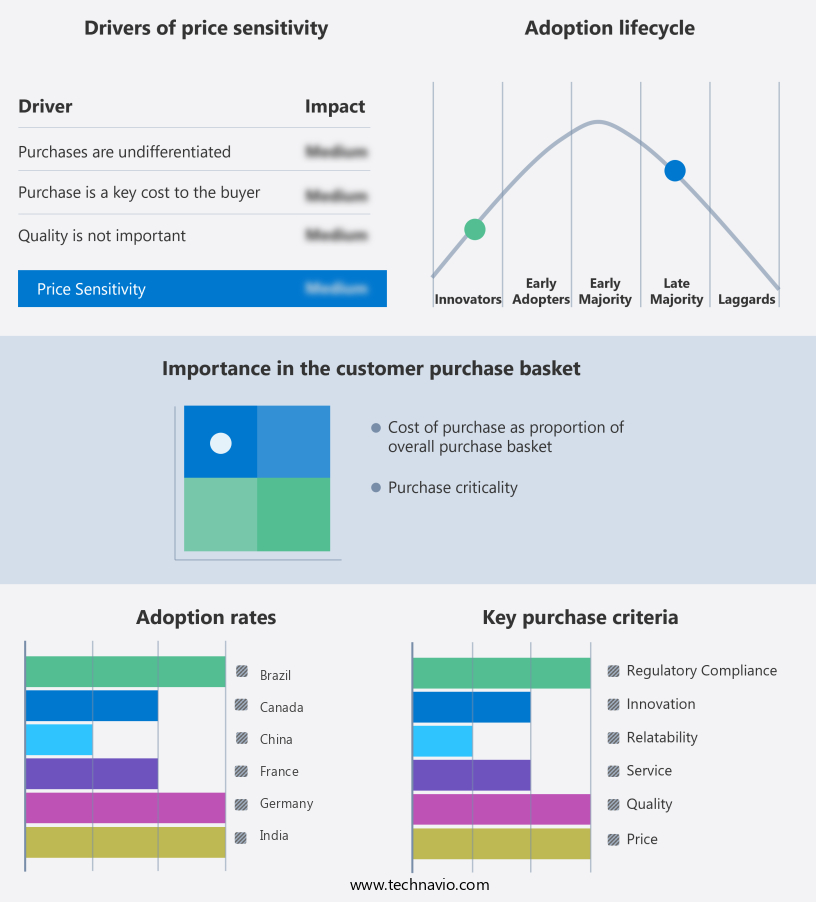
Exclusive Customer Landscape
The ride hailing services market forecasting report includes the adoption lifecycle of the market, covering from the innovator’s stage to the laggard’s stage. It focuses on adoption rates in different regions based on penetration. Furthermore, the ride hailing services market report also includes key purchase criteria and drivers of price sensitivity to help companies evaluate and develop their market growth analysis strategies.
Customer Landscape
Key Companies & Market Insights
Companies are implementing various strategies, such as strategic alliances, ride hailing services market forecast, partnerships, mergers and acquisitions, geographical expansion, and product/service launches, to enhance their presence in the industry.
ANI Technologies Pvt. Ltd. - This forward-thinking organization provides a diverse range of ride hailing options, including Mini, Bike, and Prime Sedan, catering to various customer preferences and mobility needs. Each service offering is designed to deliver a seamless and efficient transportation experience. Mini provides an economical solution for solo travelers, while Bike offers an eco-friendly and cost-effective alternative for short distances. Prime Sedan provides a premium experience with spacious vehicles and professional drivers. By offering a multitude of options, this company positions itself as a leader in the evolving ride hailing industry.
The industry research and growth report includes detailed analyses of the competitive landscape of the market and information about key companies, including:
- ANI Technologies Pvt. Ltd.
- Be Group Joint Stock Co.
- Bolt Technology OU
- Comuto SA
- DiDi Global Inc.
- FastGo Joint stock Co.
- Grab Holdings Ltd.
- GT Gettaxi UK Ltd.
- Junoride
- Lyft Inc.
- My Taxi Ride Inc.
- Ridecell Inc
- SUOL INNOVATIONS LTD
- The Addison Lee Group
- TomTom NV
- Transopco UK Ltd.
- Uber Technologies Inc.
- Via Transportation Inc.
- Wheely Technologies Ltd.
- YandexGo
Qualitative and quantitative analysis of companies has been conducted to help clients understand the wider business environment as well as the strengths and weaknesses of key industry players. Data is qualitatively analyzed to categorize companies as pure play, category-focused, industry-focused, and diversified; it is quantitatively analyzed to categorize companies as dominant, leading, strong, tentative, and weak.
Research Analyst Overview
The ride-hailing market has experienced significant shifts in recent times, driven by various measures aimed at enhancing user experience and addressing emerging challenges. One such measure is the implementation of sanitization protocols to mitigate the spread of viruses in vehicles. This trend is observed across digitally enabled car-sharing platforms, which have gained traction due to their convenience and flexibility. The increasing popularity of ride-hailing services can be attributed to several factors. The rising population and the proliferation of internet services have led to a in demand for on-demand transportation solutions. Smart phone devices have become an integral part of our daily lives, enabling users to book rides with just a few taps.
Moreover, the adoption of emission norms has led to the emergence of electric vehicles (EVs) in the ride-hailing market. Companies such as Blusmart Mobility and BYD have been at the forefront of this trend, converting their fleets to EVs to reduce their carbon footprint and offer cleaner rides to passengers. The ride-hailing market is also witnessing innovation in the form of self-driving cars. Renault and other automobile manufacturers are investing heavily in this technology to provide a more efficient and safer ride experience. However, the implementation of self-driving cars raises concerns around safety and wait times, which need to be addressed to gain widespread acceptance.
The ride-hailing market is not without its challenges. Traffic congestion and safety are major concerns, leading to longer wait times and increased operating costs for ride-hailing companies. Additionally, the rising interest rates and fuel prices have put pressure on lenders and banks, making it challenging for ride-hailing companies to secure financing for fleet expansion and maintenance. Despite these challenges, the ride-hailing market continues to grow, driven by the convenience it offers to users. The e-hailing market segment, in particular, is expected to witness growth due to its digital nature and the ease of booking rides through smartphone applications.
The mobility-as-a-service (MAAS) sector, which includes ride-hailing, car-sharing, and public transportation modes, is expected to see significant growth in the coming years. However, there are several barriers to entry, including regulatory challenges and competition from traditional transportation modes. In , the ride-hailing market is undergoing significant changes, driven by factors such as user experience, emerging technologies, and regulatory requirements. Companies that can adapt to these changes and address the challenges will be well-positioned to succeed in this dynamic market.
|
Market Scope |
|
|
Report Coverage |
Details |
|
Page number |
209 |
|
Base year |
2024 |
|
Historic period |
2019-2023 |
|
Forecast period |
2025-2029 |
|
Growth momentum & CAGR |
Accelerate at a CAGR of 16.1% |
|
Market growth 2025-2029 |
USD 102.18 billion |
|
Market structure |
Fragmented |
|
YoY growth 2024-2025(%) |
15.5 |
|
Key countries |
US, China, Canada, UK, India, Germany, Brazil, Mexico, Japan, and France |
|
Competitive landscape |
Leading Companies, Market Positioning of Companies, Competitive Strategies, and Industry Risks |
What are the Key Data Covered in this Ride Hailing Services Market Research and Growth Report?
- CAGR of the Ride Hailing Services industry during the forecast period
- Detailed information on factors that will drive the growth and forecasting between 2025 and 2029
- Precise estimation of the size of the market and its contribution of the industry in focus to the parent market
- Accurate predictions about upcoming growth and trends and changes in consumer behaviour
- Growth of the market across APAC, North America, Europe, South America, and Middle East and Africa
- Thorough analysis of the market’s competitive landscape and detailed information about companies
- Comprehensive analysis of factors that will challenge the ride hailing services market growth of industry companies
We can help! Our analysts can customize this ride hailing services market research report to meet your requirements.
 RIA -
RIA - 
