Safety Shoes Market Analysis, Size, and Forecast 2026-2030: APAC (China, India, and Japan), North America (US, Canada, and Mexico), Europe (Germany, UK, and France), South America (Brazil, Argentina, and Colombia), Middle East and Africa (Saudi Arabia, UAE, and South Africa), and Rest of World (ROW)

Safety Shoes Market Analysis, Size, and Forecast 2026-2030:
APAC (China, India, and Japan), North America (US, Canada, and Mexico), Europe (Germany, UK, and France), South America (Brazil, Argentina, and Colombia), Middle East and Africa (Saudi Arabia, UAE, and South Africa), and Rest of World (ROW)

Published: Mar 2026 304 Pages SKU: IRTNTR44597

Market Overview at a Glance

$2.23 B
Market Opportunity
6.3%
CAGR 2025 - 2030
39.3%
APAC Growth
$4.06 B
Offline segment 2024

Safety Shoes Market Size 2026-2030

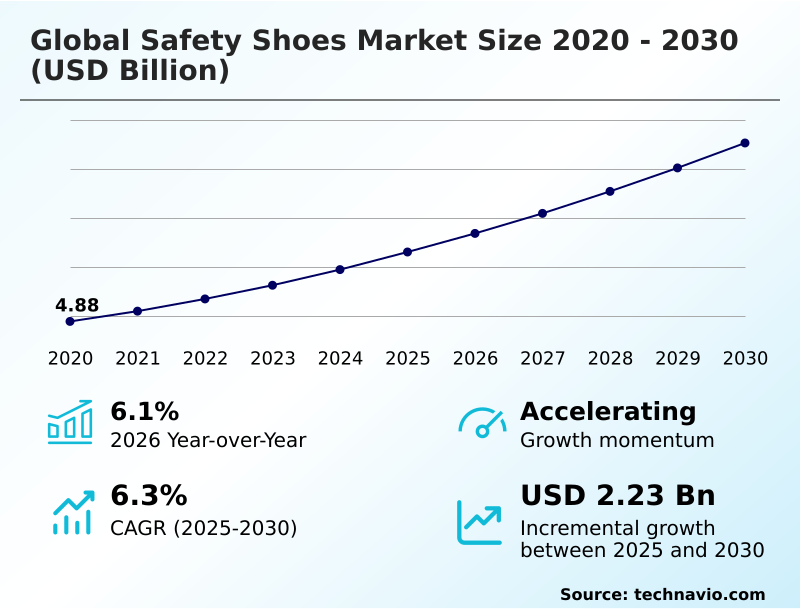
The safety shoes market size is valued to increase by USD 2.23 billion, at a CAGR of 6.3% from 2025 to 2030. Stringent standards for manufacturing safety shoes will drive the safety shoes market.

Major Market Trends & Insights

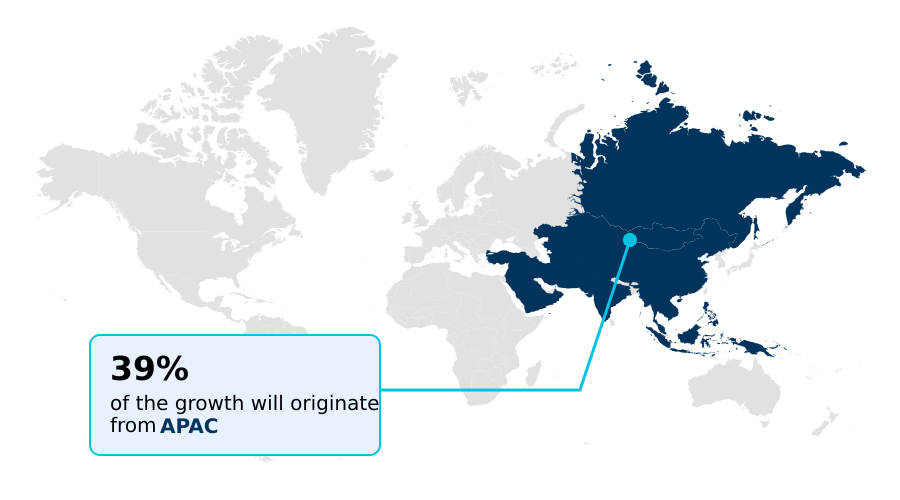
  • APAC dominated the market and accounted for a 39.3% growth during the forecast period.
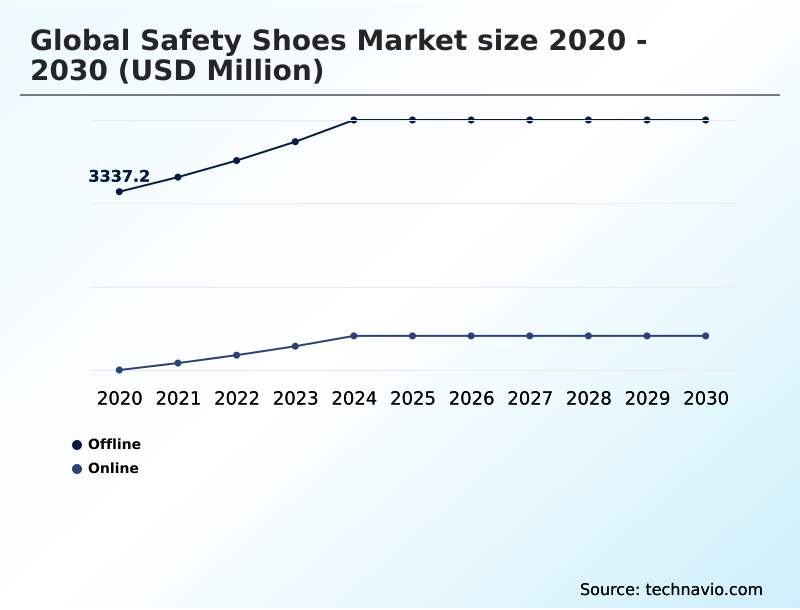
  • By Distribution Channel - Offline segment was valued at USD 4.06 billion in 2024
  • By End-user - Construction segment accounted for the largest market revenue share in 2024

Market Size & Forecast

  • Market Opportunities: USD 3.66 billion
  • Market Future Opportunities: USD 2.23 billion
  • CAGR from 2025 to 2030 : 6.3%

Market Summary

  • The safety shoes market is evolving beyond basic protection, driven by advancements in material science and a growing emphasis on occupational health. Stringent adherence to compliance, including EN ISO 20345, dictates product development, ensuring features like puncture-resistant midsoles and effective slip-resistant outsoles are standard.
  • A key trend is the integration of comfort-focused technologies, with innovations in breathable safety shoes and lightweight composite toe caps addressing long-standing issues of worker fatigue. This shift is particularly evident in specialized segments such as food industry safety clogs and cleanroom-compatible footwear, which demand both protection and specific functional properties.
  • For instance, a large-scale logistics firm implementing a footwear program with certified anti-static footwear saw a significant reduction in component damage in its electronics handling division. However, the market faces challenges from the circulation of non-compliant products, which necessitates robust verification of specifications like ISO certification and non-metallic construction for high-security environments, including insulated work boots and high-visibility footwear.

What will be the Size of the Safety Shoes Market during the forecast period?

Get Key Insights on Market Forecast (PDF) Request Free Sample

How is the Safety Shoes Market Segmented?

The safety shoes industry research report provides comprehensive data (region-wise segment analysis), with forecasts and estimates in "USD million" for the period 2026-2030, as well as historical data from 2020-2024 for the following segments.

  • Distribution channel
    • Offline
    • Online
  • End-user
    • Construction
    • Chemical
    • Manufacturing
    • Mining
    • Others
  • Material
    • Leather
    • Rubber
    • Polyurethane
    • EVA
    • Others
  • Geography
    • APAC
      • China
      • India
      • Japan
    • North America
      • US
      • Canada
      • Mexico
    • Europe
      • Germany
      • UK
      • France
    • South America
      • Brazil
      • Argentina
      • Colombia
    • Middle East and Africa
      • Saudi Arabia
      • UAE
      • South Africa
    • Rest of World (ROW)

By Distribution Channel Insights

The offline segment is estimated to witness significant growth during the forecast period.

The offline channel remains critical for the distribution of specialized industrial protective footwear, where hands-on evaluation is paramount.

Procurement for heavy-duty work boots and chemical-resistant boots often involves tactile assessment of materials like full-grain leather uppers and vulcanized rubber to ensure durability.

This channel allows buyers to verify the construction of occupational safety footwear, from dual-density polyurethane midsoles to thermoplastic polyurethane reinforcements.

The trend toward lightweight work boots and athletic-style safety sneakers also benefits from in-person fittings, where components such as EVA midsoles and carbon fiber components can be assessed for comfort.

Corporate buyers report a 15% lower rate of fit-related returns when procurement decisions are made through specialized distributors who can provide expert guidance.

Request Free Sample

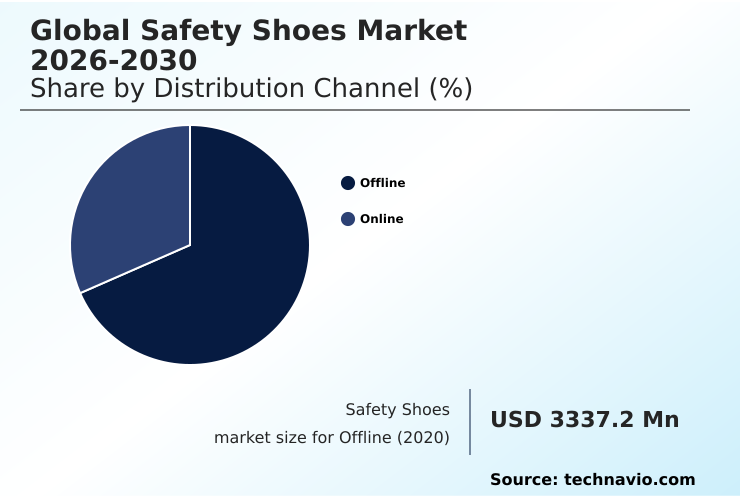
The Offline segment was valued at USD 4.06 billion in 2024 and showed a gradual increase during the forecast period.

Request Free Sample

Regional Analysis

APAC is estimated to contribute 39.3% to the growth of the global market during the forecast period.Technavio’s analysts have elaborately explained the regional trends and drivers that shape the market during the forecast period.

See How Safety Shoes Market Demand is Rising in APAC Request Free Sample

The market's geographic landscape is shaped by regional industrial specializations and regulatory climates. APAC leads market expansion, contributing nearly 40% of incremental growth, driven by manufacturing and construction.

In North America, which accounts for over 30%, strict adherence to the ASTM F2413 standard drives demand for advanced footwear, including footwear for electricians and those with heat-resistant materials.

Europe, representing more than 22% of growth, prioritizes EN ISO 20345 compliance and sustainable materials, with strong demand for non-metallic construction and waterproof membranes.

Specialized needs, such as healthcare safety footwear with hygienic solutions in mature markets and ergonomic footbeds for cold environment work boots, create further regional differentiation, with steel toe caps remaining a baseline requirement globally.

Market Dynamics

Our researchers analyzed the data with 2025 as the base year, along with the key drivers, trends, and challenges. A holistic analysis of drivers will help companies refine their marketing strategies to gain a competitive advantage.

  • A modern safety manager's role involves complex decisions, moving beyond simple procurement to a detailed analysis of footwear performance. Key questions arise, such as the trade-offs between composite toe vs steel toe for different environments and identifying the best safety shoes for concrete floors where workers stand for long shifts.
  • For specialized sectors, the focus is granular: selecting the right slip resistant shoes for kitchens requires different outsole properties than electrical hazard rated work boots. The growing demand for lightweight safety shoes for women reflects a more inclusive approach to workplace safety.
  • In high-risk areas, the choice between waterproof safety boots for construction and breathable work boots for hot weather is critical for both compliance and comfort. Many now seek the most comfortable safety toe shoes, which often incorporate anti fatigue technology in work boots to reduce long-term strain.
  • The process of how to choose mining safety boots is particularly stringent, often requiring metatarsal guard boots for heavy industry. Similarly, specifying puncture resistant boots for waste management or the right safety shoes for automotive industry requires a deep understanding of task-specific risks.
  • The benefits of ergonomic safety footwear are now widely recognized, though debates continue on topics like 'are carbon fiber toe caps safe?' for all applications. Ultimately, understanding technical guides like 'what is ASTM F2413 standard' is crucial for selecting the best outsole for oily surfaces or certified food grade non slip shoes.
  • Firms that invest in this detailed approach to preventing foot fatigue at work and embrace sustainable and recycled safety footwear often see a 50% longer replacement cycle compared to those using generic alternatives.

What are the key market drivers leading to the rise in the adoption of Safety Shoes Industry?

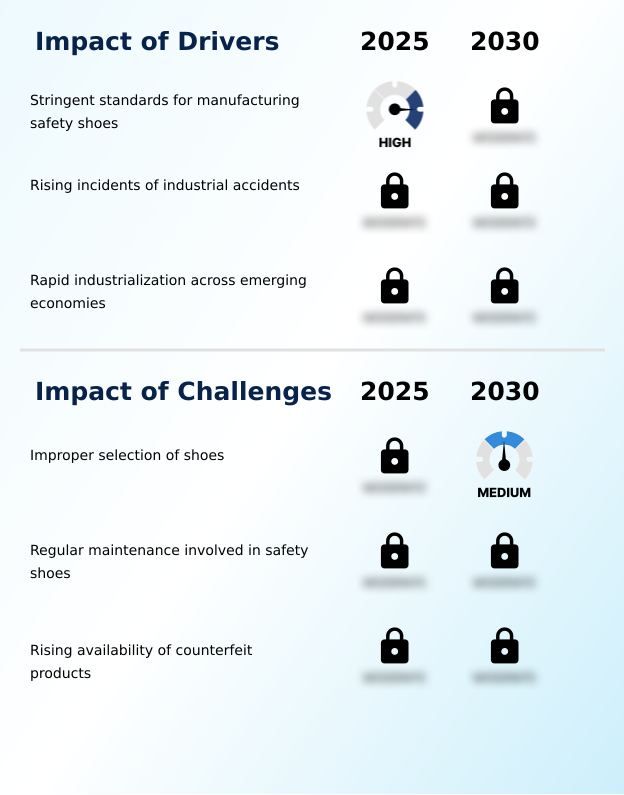
  • Stringent manufacturing standards are a key driver for the market, compelling innovation in product quality and ensuring compliance across industries.

  • Market growth is significantly influenced by a heightened focus on holistic worker health and stringent regulatory standards.
  • The push for improved worker fatigue management and musculoskeletal disorder prevention is driving the adoption of footwear with advanced cushioning technology and energy-return foam. Designs now frequently feature moisture-wicking linings and are often podiatrist-approved, reflecting a deeper biomechanical footwear analysis.
  • Achieving workplace safety compliance is a non-negotiable for enterprises, reinforcing the role of personal protective equipment. The market for recycled material footwear is expanding, with seamless upper construction techniques improving durability.
  • Furthermore, demand for custom-fit safety insoles is rising as companies recognize that optimized slip-and-fall prevention strategies improve operational efficiency by up to 20%.

What are the market trends shaping the Safety Shoes Industry?

  • The market is witnessing a significant trend toward ergonomically designed safety shoes. This shift prioritizes worker comfort, long-term health, and productivity alongside traditional protection.

  • Key market trends are centered on enhancing worker well-being without compromising safety. There is a rising demand for ergonomically superior, breathable safety shoes, particularly women's safety footwear. Innovations include advanced breathable mesh uppers and shock-absorbing midsoles that pass rigorous impact resistance testing.
  • The food industry safety clogs and cleanroom-compatible footwear sectors are seeing growth, with a focus on specialized chemical-resistant materials and designs that facilitate hygiene. The push for sustainable safety shoes is also driving the adoption of new materials that undergo stringent compression resistance tests.
  • The integration of high-visibility features is becoming standard in many sectors, while designs incorporating advanced biomechanical design principles are now applied even to insulated work boots, reducing long-term strain by over 20%.

What challenges does the Safety Shoes Industry face during its growth?

  • A key challenge affecting industry growth is the improper selection of safety footwear, which can undermine protection and lead to low user compliance.

  • Market integrity is tested by the prevalence of counterfeit products and improper footwear selection, which undermine safety protocols. In sectors requiring specialized oil and gas footwear or agricultural work boots, using a shoe without the correct oil-resistant soles or puncture-resistant midsoles poses significant risk. Similarly, in logistics and construction, the effectiveness of slip-resistant outsoles is critical.
  • Misapplication of manufacturing plant shoes or construction site footwear, such as selecting footwear without proper electrical hazard protection or anti-static footwear features where needed, can lead to severe incidents. The failure to specify features like composite toe caps or adequate metatarsal guards for mining industry boots increases liability, with improper selection contributing to over 50% of preventable foot injuries.

Exclusive Technavio Analysis on Customer Landscape

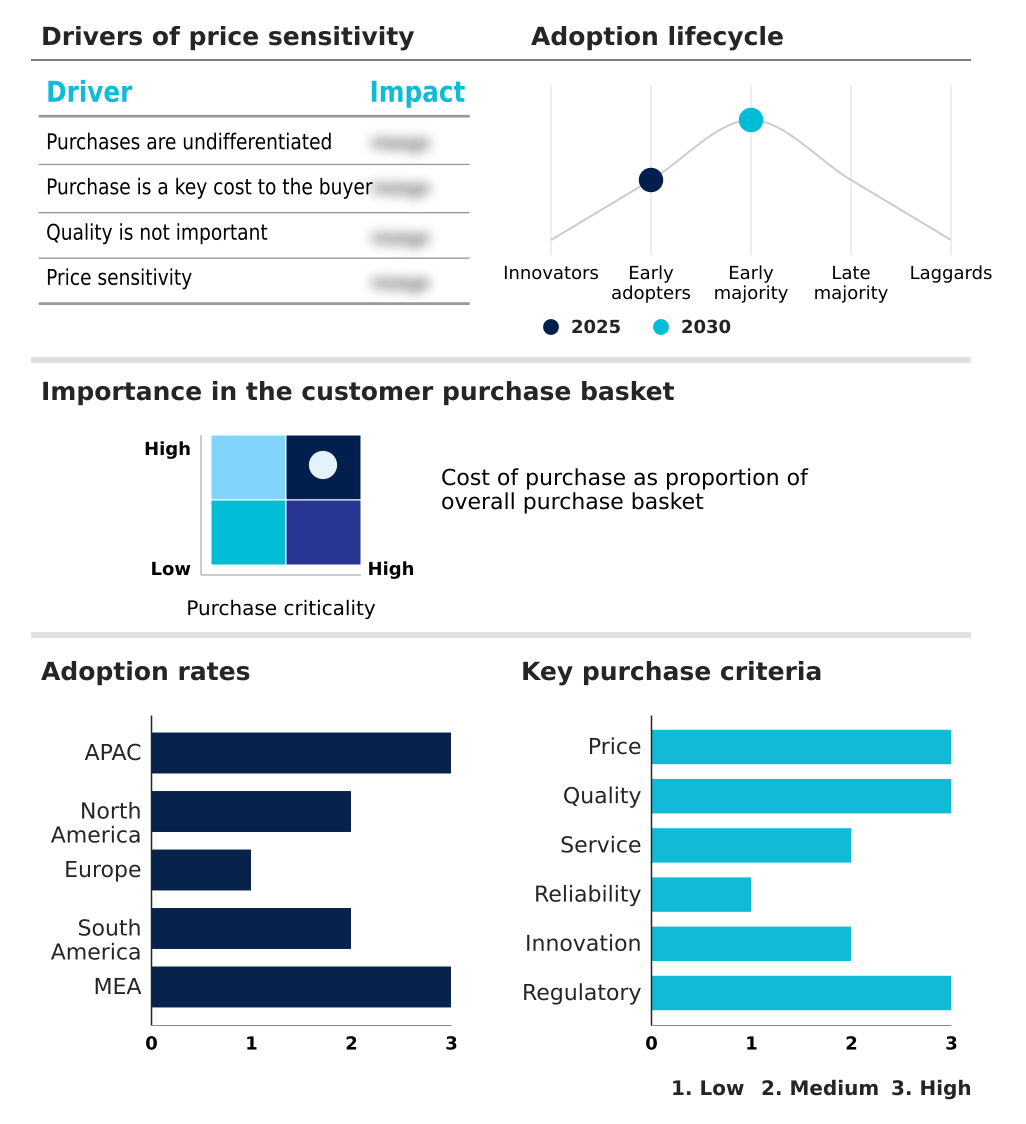
The safety shoes market forecasting report includes the adoption lifecycle of the market, covering from the innovator’s stage to the laggard’s stage. It focuses on adoption rates in different regions based on penetration. Furthermore, the safety shoes market report also includes key purchase criteria and drivers of price sensitivity to help companies evaluate and develop their market growth analysis strategies.

Customer Landscape of Safety Shoes Industry

Competitive Landscape

Companies are implementing various strategies, such as strategic alliances, safety shoes market forecast, partnerships, mergers and acquisitions, geographical expansion, and product/service launches, to enhance their presence in the industry.

Bata Corp. - Key offerings comprise specialized safety footwear with features like steel toes and slip resistance, engineered for worker protection in demanding industrial and construction environments.

The industry research and growth report includes detailed analyses of the competitive landscape of the market and information about key companies, including:

  • Bata Corp.
  • Carhartt Inc.
  • Caterpillar Inc.
  • Cofra Srl
  • Dunlop Protective Footwear
  • ELTEN GmbH
  • Gabri Shoes
  • Honeywell International Inc.
  • KARAM Safety Pvt. Ltd.
  • KEEN Inc.
  • Pezzol Industries Srl
  • Rahman Group
  • Red Wing Brands of America
  • Safetyking Industrial Footwear
  • Steel Blue
  • U Power Group SpA
  • Uvex Group
  • VF Corp.
  • W L Gore and Associates Inc.

Qualitative and quantitative analysis of companies has been conducted to help clients understand the wider business environment as well as the strengths and weaknesses of key industry players. Data is qualitatively analyzed to categorize companies as pure play, category-focused, industry-focused, and diversified; it is quantitatively analyzed to categorize companies as dominant, leading, strong, tentative, and weak.

Recent Development and News in Safety shoes market

  • In February, 2025, Honeywell International Inc. launched a new series of protective footwear equipped with integrated sensors that provide real-time data regarding worker posture and fatigue, reflecting a broader movement toward digitizing personal protective equipment.
  • In February, 2025, the Bureau of Indian Standards (BIS) conducted a workplace labor safety awareness program, engaging over 80 stakeholders to discuss updated safety standards on respiratory protection, fall prevention, fire safety, and occupational health.
  • In December, 2024, Wolverine Worldwide launched a 'Made in America' work boot program for its Wolverine brand, partnering with a Texas-based manufacturing facility to strengthen domestic production and mitigate tariff impacts.
  • In October, 2024, Adidas announced its entry into the safety shoes market through a partnership with GLO Brands B.V., unveiling the Adidas Pro Work range that combines industrial-grade protection with its signature comfort and performance design.

Dive into Technavio’s robust research methodology, blending expert interviews, extensive data synthesis, and validated models for unparalleled Safety Shoes Market insights. See full methodology.

Market Scope
Page number 304
Base year 2025
Historic period 2020-2024
Forecast period 2026-2030
Growth momentum & CAGR Accelerate at a CAGR of 6.3%
Market growth 2026-2030 USD 2233.9 million
Market structure Fragmented
YoY growth 2025-2026(%) 6.1%
Key countries China, India, Japan, South Korea, Australia, Indonesia, US, Canada, Mexico, Germany, UK, France, Italy, The Netherlands, Spain, Brazil, Argentina, Colombia, Saudi Arabia, UAE, South Africa, Israel and Turkey
Competitive landscape Leading Companies, Market Positioning of Companies, Competitive Strategies, and Industry Risks

Request Free Sample

Research Analyst Overview

  • The safety shoes market is strategically evolving from compliance-driven sales to performance-based solutions that enhance worker well-being. Boardroom decisions now weigh the ROI of advanced personal protective equipment, with ergonomic footbeds and podiatrist-approved design features reducing worker fatigue management costs.
  • This is driving innovation in materials, including lightweight composite toe caps and non-metallic construction using carbon fiber components as alternatives to traditional steel toe caps. Core to this trend is advanced cushioning technology, with shock-absorbing midsoles made from dual-density polyurethane or EVA midsoles, and energy-return foam for enhanced comfort.
  • Durability remains paramount, ensured through rigorous impact resistance testing and compression resistance checks on materials like full-grain leather uppers and outsoles of vulcanized rubber or nitrile rubber compounds. Specialized protection is non-negotiable, requiring features like puncture-resistant midsoles, metatarsal guards, electrical hazard protection, and anti-static footwear with oil-resistant soles and heat-resistant or chemical-resistant materials.
  • Environmental adaptability is addressed with waterproof membranes, breathable mesh uppers with moisture-wicking linings, and high-visibility features. This holistic approach, guided by standards like ASTM F2413 standard and EN ISO 20345, demonstrates how biomechanical design and slip-and-fall prevention are integral to modern occupational safety.

What are the Key Data Covered in this Safety Shoes Market Research and Growth Report?

  • What is the expected growth of the Safety Shoes Market between 2026 and 2030?

    • USD 2.23 billion, at a CAGR of 6.3%

  • What segmentation does the market report cover?

    • The report is segmented by Distribution Channel (Offline, and Online), End-user (Construction, Chemical, Manufacturing, Mining, and Others), Material (Leather, Rubber, Polyurethane, EVA, and Others) and Geography (APAC, North America, Europe, South America, Middle East and Africa)

  • Which regions are analyzed in the report?

    • APAC, North America, Europe, South America and Middle East and Africa

  • What are the key growth drivers and market challenges?

    • Stringent standards for manufacturing safety shoes, Improper selection of shoes

  • Who are the major players in the Safety Shoes Market?

    • Bata Corp., Carhartt Inc., Caterpillar Inc., Cofra Srl, Dunlop Protective Footwear, ELTEN GmbH, Gabri Shoes, Honeywell International Inc., KARAM Safety Pvt. Ltd., KEEN Inc., Pezzol Industries Srl, Rahman Group, Red Wing Brands of America, Safetyking Industrial Footwear, Steel Blue, U Power Group SpA, Uvex Group, VF Corp. and W L Gore and Associates Inc.

Market Research Insights

  • The market is undergoing a dynamic shift as enterprises prioritize comprehensive worker well-being and operational efficiency. A core focus is on worker fatigue management and musculoskeletal disorder prevention, with advanced ergonomic designs reducing reported discomfort by up to 30%.
  • The adoption of specialized footwear, such as lightweight work boots and athletic-style safety sneakers, is growing, driven by a younger workforce that values comfort and modern aesthetics. Achieving workplace safety compliance remains a top priority, with companies using certified personal protective equipment reporting a 25% reduction in injury-related downtime.
  • This evolution reflects a strategic move toward viewing high-quality occupational safety footwear not as a cost but as an investment in productivity and risk mitigation.

We can help! Our analysts can customize this safety shoes market research report to meet your requirements.

Get in touch

1. Executive Summary

1.1 Market overview

Executive Summary - Chart on Market Overview
Executive Summary - Data Table on Market Overview
Executive Summary - Chart on Global Market Characteristics
Executive Summary - Chart on Market by Geography
Executive Summary - Chart on Market Segmentation by Distribution Channel
Executive Summary - Chart on Market Segmentation by End-user
Executive Summary - Chart on Market Segmentation by Material
Executive Summary - Chart on Incremental Growth
Executive Summary - Data Table on Incremental Growth
Executive Summary - Chart on Company Market Positioning

2. Technavio Analysis

2.1 Analysis of price sensitivity, lifecycle, customer purchase basket, adoption rates, and purchase criteria

2.2 Criticality of inputs and Factors of differentiation

Chart on Overview on criticality of inputs and factors of differentiation

2.3 Factors of disruption

Chart on Overview on factors of disruption

2.4 Impact of drivers and challenges

Chart on Impact of drivers and challenges in 2025 and 2030

3. Market Landscape

3.1 Market ecosystem

Chart on Parent Market
Data Table on - Parent Market

3.2 Market characteristics

Chart on Market characteristics analysis

3.3 Value chain analysis

Chart on Value chain analysis

4. Market Sizing

4.1 Market definition

Data Table on Offerings of companies included in the market definition

4.2 Market segment analysis

Market segments

4.3 Market size 2025

4.4 Market outlook: Forecast for 2025-2030

Chart on Global - Market size and forecast 2025-2030 ($ million)
Data Table on Global - Market size and forecast 2025-2030 ($ million)
Chart on Global Market: Year-over-year growth 2025-2030 (%)
Data Table on Global Market: Year-over-year growth 2025-2030 (%)

5. Historic Market Size

5.1 Global Safety Shoes Market 2020 - 2024

Historic Market Size - Data Table on Global Safety Shoes Market 2020 - 2024 ($ million)

5.2 Distribution Channel segment analysis 2020 - 2024

Historic Market Size - Distribution Channel Segment 2020 - 2024 ($ million)

5.3 End-user segment analysis 2020 - 2024

Historic Market Size - End-user Segment 2020 - 2024 ($ million)

5.4 Material segment analysis 2020 - 2024

Historic Market Size - Material Segment 2020 - 2024 ($ million)

5.5 Geography segment analysis 2020 - 2024

Historic Market Size - Geography Segment 2020 - 2024 ($ million)

5.6 Country segment analysis 2020 - 2024

Historic Market Size - Country Segment 2020 - 2024 ($ million)

6. Qualitative Analysis

6.1 The AI Impact on Global Safety Shoes Market

7. Five Forces Analysis

7.1 Five forces summary

Five forces analysis - Comparison between 2025 and 2030

7.2 Bargaining power of buyers

Bargaining power of buyers - Impact of key factors 2025 and 2030

7.3 Bargaining power of suppliers

Bargaining power of suppliers - Impact of key factors in 2025 and 2030

7.4 Threat of new entrants

Threat of new entrants - Impact of key factors in 2025 and 2030

7.5 Threat of substitutes

Threat of substitutes - Impact of key factors in 2025 and 2030

7.6 Threat of rivalry

Threat of rivalry - Impact of key factors in 2025 and 2030

7.7 Market condition

Chart on Market condition - Five forces 2025 and 2030

8. Market Segmentation by Distribution Channel

8.1 Market segments

Chart on Distribution Channel - Market share 2025-2030 (%)
Data Table on Distribution Channel - Market share 2025-2030 (%)

8.2 Comparison by Distribution Channel

Chart on Comparison by Distribution Channel
Data Table on Comparison by Distribution Channel

8.3 Offline - Market size and forecast 2025-2030

Chart on Offline - Market size and forecast 2025-2030 ($ million)
Data Table on Offline - Market size and forecast 2025-2030 ($ million)
Chart on Offline - Year-over-year growth 2025-2030 (%)
Data Table on Offline - Year-over-year growth 2025-2030 (%)

8.4 Online - Market size and forecast 2025-2030

Chart on Online - Market size and forecast 2025-2030 ($ million)
Data Table on Online - Market size and forecast 2025-2030 ($ million)
Chart on Online - Year-over-year growth 2025-2030 (%)
Data Table on Online - Year-over-year growth 2025-2030 (%)

8.5 Market opportunity by Distribution Channel

Market opportunity by Distribution Channel ($ million)
Data Table on Market opportunity by Distribution Channel ($ million)

9. Market Segmentation by End-user

9.1 Market segments

Chart on End-user - Market share 2025-2030 (%)
Data Table on End-user - Market share 2025-2030 (%)

9.2 Comparison by End-user

Chart on Comparison by End-user
Data Table on Comparison by End-user

9.3 Construction - Market size and forecast 2025-2030

Chart on Construction - Market size and forecast 2025-2030 ($ million)
Data Table on Construction - Market size and forecast 2025-2030 ($ million)
Chart on Construction - Year-over-year growth 2025-2030 (%)
Data Table on Construction - Year-over-year growth 2025-2030 (%)

9.4 Chemical - Market size and forecast 2025-2030

Chart on Chemical - Market size and forecast 2025-2030 ($ million)
Data Table on Chemical - Market size and forecast 2025-2030 ($ million)
Chart on Chemical - Year-over-year growth 2025-2030 (%)
Data Table on Chemical - Year-over-year growth 2025-2030 (%)

9.5 Manufacturing - Market size and forecast 2025-2030

Chart on Manufacturing - Market size and forecast 2025-2030 ($ million)
Data Table on Manufacturing - Market size and forecast 2025-2030 ($ million)
Chart on Manufacturing - Year-over-year growth 2025-2030 (%)
Data Table on Manufacturing - Year-over-year growth 2025-2030 (%)

9.6 Mining - Market size and forecast 2025-2030

Chart on Mining - Market size and forecast 2025-2030 ($ million)
Data Table on Mining - Market size and forecast 2025-2030 ($ million)
Chart on Mining - Year-over-year growth 2025-2030 (%)
Data Table on Mining - Year-over-year growth 2025-2030 (%)

9.7 Others - Market size and forecast 2025-2030

Chart on Others - Market size and forecast 2025-2030 ($ million)
Data Table on Others - Market size and forecast 2025-2030 ($ million)
Chart on Others - Year-over-year growth 2025-2030 (%)
Data Table on Others - Year-over-year growth 2025-2030 (%)

9.8 Market opportunity by End-user

Market opportunity by End-user ($ million)
Data Table on Market opportunity by End-user ($ million)

10. Market Segmentation by Material

10.1 Market segments

Chart on Material - Market share 2025-2030 (%)
Data Table on Material - Market share 2025-2030 (%)

10.2 Comparison by Material

Chart on Comparison by Material
Data Table on Comparison by Material

10.3 Leather - Market size and forecast 2025-2030

Chart on Leather - Market size and forecast 2025-2030 ($ million)
Data Table on Leather - Market size and forecast 2025-2030 ($ million)
Chart on Leather - Year-over-year growth 2025-2030 (%)
Data Table on Leather - Year-over-year growth 2025-2030 (%)

10.4 Rubber - Market size and forecast 2025-2030

Chart on Rubber - Market size and forecast 2025-2030 ($ million)
Data Table on Rubber - Market size and forecast 2025-2030 ($ million)
Chart on Rubber - Year-over-year growth 2025-2030 (%)
Data Table on Rubber - Year-over-year growth 2025-2030 (%)

10.5 Polyurethane - Market size and forecast 2025-2030

Chart on Polyurethane - Market size and forecast 2025-2030 ($ million)
Data Table on Polyurethane - Market size and forecast 2025-2030 ($ million)
Chart on Polyurethane - Year-over-year growth 2025-2030 (%)
Data Table on Polyurethane - Year-over-year growth 2025-2030 (%)

10.6 EVA - Market size and forecast 2025-2030

Chart on EVA - Market size and forecast 2025-2030 ($ million)
Data Table on EVA - Market size and forecast 2025-2030 ($ million)
Chart on EVA - Year-over-year growth 2025-2030 (%)
Data Table on EVA - Year-over-year growth 2025-2030 (%)

10.7 Others - Market size and forecast 2025-2030

Chart on Others - Market size and forecast 2025-2030 ($ million)
Data Table on Others - Market size and forecast 2025-2030 ($ million)
Chart on Others - Year-over-year growth 2025-2030 (%)
Data Table on Others - Year-over-year growth 2025-2030 (%)

10.8 Market opportunity by Material

Market opportunity by Material ($ million)
Data Table on Market opportunity by Material ($ million)

11. Customer Landscape

11.1 Customer landscape overview

Analysis of price sensitivity, lifecycle, customer purchase basket, adoption rates, and purchase criteria

12. Geographic Landscape

12.1 Geographic segmentation

Chart on Market share by geography 2025-2030 (%)
Data Table on Market share by geography 2025-2030 (%)

12.2 Geographic comparison

Chart on Geographic comparison
Data Table on Geographic comparison

12.3 APAC - Market size and forecast 2025-2030

Chart on APAC - Market size and forecast 2025-2030 ($ million)
Data Table on APAC - Market size and forecast 2025-2030 ($ million)
Chart on APAC - Year-over-year growth 2025-2030 (%)
Data Table on APAC - Year-over-year growth 2025-2030 (%)
Chart on Regional Comparison - APAC
Data Table on Regional Comparison - APAC

12.3.1 China - Market size and forecast 2025-2030

Chart on China - Market size and forecast 2025-2030 ($ million)
Data Table on China - Market size and forecast 2025-2030 ($ million)
Chart on China - Year-over-year growth 2025-2030 (%)
Data Table on China - Year-over-year growth 2025-2030 (%)

12.3.2 India - Market size and forecast 2025-2030

Chart on India - Market size and forecast 2025-2030 ($ million)
Data Table on India - Market size and forecast 2025-2030 ($ million)
Chart on India - Year-over-year growth 2025-2030 (%)
Data Table on India - Year-over-year growth 2025-2030 (%)

12.3.3 Japan - Market size and forecast 2025-2030

Chart on Japan - Market size and forecast 2025-2030 ($ million)
Data Table on Japan - Market size and forecast 2025-2030 ($ million)
Chart on Japan - Year-over-year growth 2025-2030 (%)
Data Table on Japan - Year-over-year growth 2025-2030 (%)

12.3.4 South Korea - Market size and forecast 2025-2030

Chart on South Korea - Market size and forecast 2025-2030 ($ million)
Data Table on South Korea - Market size and forecast 2025-2030 ($ million)
Chart on South Korea - Year-over-year growth 2025-2030 (%)
Data Table on South Korea - Year-over-year growth 2025-2030 (%)

12.3.5 Australia - Market size and forecast 2025-2030

Chart on Australia - Market size and forecast 2025-2030 ($ million)
Data Table on Australia - Market size and forecast 2025-2030 ($ million)
Chart on Australia - Year-over-year growth 2025-2030 (%)
Data Table on Australia - Year-over-year growth 2025-2030 (%)

12.3.6 Indonesia - Market size and forecast 2025-2030

Chart on Indonesia - Market size and forecast 2025-2030 ($ million)
Data Table on Indonesia - Market size and forecast 2025-2030 ($ million)
Chart on Indonesia - Year-over-year growth 2025-2030 (%)
Data Table on Indonesia - Year-over-year growth 2025-2030 (%)

12.4 North America - Market size and forecast 2025-2030

Chart on North America - Market size and forecast 2025-2030 ($ million)
Data Table on North America - Market size and forecast 2025-2030 ($ million)
Chart on North America - Year-over-year growth 2025-2030 (%)
Data Table on North America - Year-over-year growth 2025-2030 (%)
Chart on Regional Comparison - North America
Data Table on Regional Comparison - North America

12.4.1 US - Market size and forecast 2025-2030

Chart on US - Market size and forecast 2025-2030 ($ million)
Data Table on US - Market size and forecast 2025-2030 ($ million)
Chart on US - Year-over-year growth 2025-2030 (%)
Data Table on US - Year-over-year growth 2025-2030 (%)

12.4.2 Canada - Market size and forecast 2025-2030

Chart on Canada - Market size and forecast 2025-2030 ($ million)
Data Table on Canada - Market size and forecast 2025-2030 ($ million)
Chart on Canada - Year-over-year growth 2025-2030 (%)
Data Table on Canada - Year-over-year growth 2025-2030 (%)

12.4.3 Mexico - Market size and forecast 2025-2030

Chart on Mexico - Market size and forecast 2025-2030 ($ million)
Data Table on Mexico - Market size and forecast 2025-2030 ($ million)
Chart on Mexico - Year-over-year growth 2025-2030 (%)
Data Table on Mexico - Year-over-year growth 2025-2030 (%)

12.5 Europe - Market size and forecast 2025-2030

Chart on Europe - Market size and forecast 2025-2030 ($ million)
Data Table on Europe - Market size and forecast 2025-2030 ($ million)
Chart on Europe - Year-over-year growth 2025-2030 (%)
Data Table on Europe - Year-over-year growth 2025-2030 (%)
Chart on Regional Comparison - Europe
Data Table on Regional Comparison - Europe

12.5.1 Germany - Market size and forecast 2025-2030

Chart on Germany - Market size and forecast 2025-2030 ($ million)
Data Table on Germany - Market size and forecast 2025-2030 ($ million)
Chart on Germany - Year-over-year growth 2025-2030 (%)
Data Table on Germany - Year-over-year growth 2025-2030 (%)

12.5.2 UK - Market size and forecast 2025-2030

Chart on UK - Market size and forecast 2025-2030 ($ million)
Data Table on UK - Market size and forecast 2025-2030 ($ million)
Chart on UK - Year-over-year growth 2025-2030 (%)
Data Table on UK - Year-over-year growth 2025-2030 (%)

12.5.3 France - Market size and forecast 2025-2030

Chart on France - Market size and forecast 2025-2030 ($ million)
Data Table on France - Market size and forecast 2025-2030 ($ million)
Chart on France - Year-over-year growth 2025-2030 (%)
Data Table on France - Year-over-year growth 2025-2030 (%)

12.5.4 Italy - Market size and forecast 2025-2030

Chart on Italy - Market size and forecast 2025-2030 ($ million)
Data Table on Italy - Market size and forecast 2025-2030 ($ million)
Chart on Italy - Year-over-year growth 2025-2030 (%)
Data Table on Italy - Year-over-year growth 2025-2030 (%)

12.5.5 The Netherlands - Market size and forecast 2025-2030

Chart on The Netherlands - Market size and forecast 2025-2030 ($ million)
Data Table on The Netherlands - Market size and forecast 2025-2030 ($ million)
Chart on The Netherlands - Year-over-year growth 2025-2030 (%)
Data Table on The Netherlands - Year-over-year growth 2025-2030 (%)

12.5.6 Spain - Market size and forecast 2025-2030

Chart on Spain - Market size and forecast 2025-2030 ($ million)
Data Table on Spain - Market size and forecast 2025-2030 ($ million)
Chart on Spain - Year-over-year growth 2025-2030 (%)
Data Table on Spain - Year-over-year growth 2025-2030 (%)

12.6 South America - Market size and forecast 2025-2030

Chart on South America - Market size and forecast 2025-2030 ($ million)
Data Table on South America - Market size and forecast 2025-2030 ($ million)
Chart on South America - Year-over-year growth 2025-2030 (%)
Data Table on South America - Year-over-year growth 2025-2030 (%)
Chart on Regional Comparison - South America
Data Table on Regional Comparison - South America

12.6.1 Brazil - Market size and forecast 2025-2030

Chart on Brazil - Market size and forecast 2025-2030 ($ million)
Data Table on Brazil - Market size and forecast 2025-2030 ($ million)
Chart on Brazil - Year-over-year growth 2025-2030 (%)
Data Table on Brazil - Year-over-year growth 2025-2030 (%)

12.6.2 Argentina - Market size and forecast 2025-2030

Chart on Argentina - Market size and forecast 2025-2030 ($ million)
Data Table on Argentina - Market size and forecast 2025-2030 ($ million)
Chart on Argentina - Year-over-year growth 2025-2030 (%)
Data Table on Argentina - Year-over-year growth 2025-2030 (%)

12.6.3 Colombia - Market size and forecast 2025-2030

Chart on Colombia - Market size and forecast 2025-2030 ($ million)
Data Table on Colombia - Market size and forecast 2025-2030 ($ million)
Chart on Colombia - Year-over-year growth 2025-2030 (%)
Data Table on Colombia - Year-over-year growth 2025-2030 (%)

12.7 Middle East and Africa - Market size and forecast 2025-2030

Chart on Middle East and Africa - Market size and forecast 2025-2030 ($ million)
Data Table on Middle East and Africa - Market size and forecast 2025-2030 ($ million)
Chart on Middle East and Africa - Year-over-year growth 2025-2030 (%)
Data Table on Middle East and Africa - Year-over-year growth 2025-2030 (%)
Chart on Regional Comparison - Middle East and Africa
Data Table on Regional Comparison - Middle East and Africa

12.7.1 Saudi Arabia - Market size and forecast 2025-2030

Chart on Saudi Arabia - Market size and forecast 2025-2030 ($ million)
Data Table on Saudi Arabia - Market size and forecast 2025-2030 ($ million)
Chart on Saudi Arabia - Year-over-year growth 2025-2030 (%)
Data Table on Saudi Arabia - Year-over-year growth 2025-2030 (%)

12.7.2 UAE - Market size and forecast 2025-2030

Chart on UAE - Market size and forecast 2025-2030 ($ million)
Data Table on UAE - Market size and forecast 2025-2030 ($ million)
Chart on UAE - Year-over-year growth 2025-2030 (%)
Data Table on UAE - Year-over-year growth 2025-2030 (%)

12.7.3 South Africa - Market size and forecast 2025-2030

Chart on South Africa - Market size and forecast 2025-2030 ($ million)
Data Table on South Africa - Market size and forecast 2025-2030 ($ million)
Chart on South Africa - Year-over-year growth 2025-2030 (%)
Data Table on South Africa - Year-over-year growth 2025-2030 (%)

12.7.4 Israel - Market size and forecast 2025-2030

Chart on Israel - Market size and forecast 2025-2030 ($ million)
Data Table on Israel - Market size and forecast 2025-2030 ($ million)
Chart on Israel - Year-over-year growth 2025-2030 (%)
Data Table on Israel - Year-over-year growth 2025-2030 (%)

12.7.5 Turkey - Market size and forecast 2025-2030

Chart on Turkey - Market size and forecast 2025-2030 ($ million)
Data Table on Turkey - Market size and forecast 2025-2030 ($ million)
Chart on Turkey - Year-over-year growth 2025-2030 (%)
Data Table on Turkey - Year-over-year growth 2025-2030 (%)

12.8 Market opportunity by geography

Market opportunity by geography ($ million)
Data Tables on Market opportunity by geography ($ million)

13. Drivers, Challenges, and Opportunity

13.1 Market drivers

Stringent standards for manufacturing safety shoes
Rising incidents of industrial accidents
Rapid industrialization across emerging economies

13.2 Market challenges

Improper selection of shoes
Regular maintenance involved in safety shoes
Rising availability of counterfeit products

13.3 Impact of drivers and challenges

Impact of drivers and challenges in 2025 and 2030

13.4 Market opportunities

Ergonomically designed safety shoes
Safety shoes designed for food industry
Use of lightweight materials to make safety shoes

14. Competitive Landscape

14.1 Overview

14.2

Overview on criticality of inputs and factors of differentiation

14.3 Landscape disruption

Overview on factors of disruption

14.4 Industry risks

Impact of key risks on business

15. Competitive Analysis

15.1 Companies profiled

Companies covered

15.2 Company ranking index

15.3 Market positioning of companies

Matrix on companies position and classification

15.4 Bata Corp.

Bata Corp. - Overview
Bata Corp. - Product / Service
Bata Corp. - Key offerings
SWOT

15.5 Carhartt Inc.

Carhartt Inc. - Overview
Carhartt Inc. - Product / Service
Carhartt Inc. - Key offerings
SWOT

15.6 Caterpillar Inc.

Caterpillar Inc. - Overview
Caterpillar Inc. - Business segments
Caterpillar Inc. - Key news
Caterpillar Inc. - Key offerings
Caterpillar Inc. - Segment focus
SWOT

15.7 Dunlop Protective Footwear

Dunlop Protective Footwear - Overview
Dunlop Protective Footwear - Product / Service
Dunlop Protective Footwear - Key offerings
SWOT

15.8 Gabri Shoes

Gabri Shoes - Overview
Gabri Shoes - Product / Service
Gabri Shoes - Key offerings
SWOT

15.9 Honeywell International Inc.

Honeywell International Inc. - Overview
Honeywell International Inc. - Business segments
Honeywell International Inc. - Key news
Honeywell International Inc. - Key offerings
Honeywell International Inc. - Segment focus
SWOT

15.10 KARAM Safety Pvt. Ltd.

KARAM Safety Pvt. Ltd. - Overview
KARAM Safety Pvt. Ltd. - Product / Service
KARAM Safety Pvt. Ltd. - Key offerings
SWOT

15.11 KEEN Inc.

KEEN Inc. - Overview
KEEN Inc. - Product / Service
KEEN Inc. - Key offerings
SWOT

15.12 Pezzol Industries Srl

Pezzol Industries Srl - Overview
Pezzol Industries Srl - Product / Service
Pezzol Industries Srl - Key offerings
SWOT

15.13 Rahman Group

Rahman Group - Overview
Rahman Group - Product / Service
Rahman Group - Key offerings
SWOT

15.14 Red Wing Brands of America

Red Wing Brands of America - Overview
Red Wing Brands of America - Product / Service
Red Wing Brands of America - Key offerings
SWOT

15.15 Safetyking Industrial Footwear

Safetyking Industrial Footwear - Overview
Safetyking Industrial Footwear - Product / Service
Safetyking Industrial Footwear - Key offerings
SWOT

15.16 Steel Blue

Steel Blue - Overview
Steel Blue - Product / Service
Steel Blue - Key offerings
SWOT

15.17 Uvex Group

Uvex Group - Overview
Uvex Group - Product / Service
Uvex Group - Key news
Uvex Group - Key offerings
SWOT

15.18 VF Corp.

VF Corp. - Overview
VF Corp. - Business segments
VF Corp. - Key news
VF Corp. - Key offerings
VF Corp. - Segment focus
SWOT

16. Appendix

16.1 Scope of the report

Market definition
Objectives
Notes and caveats

16.2 Inclusions and exclusions checklist

Inclusions checklist
Exclusions checklist

16.3 Currency conversion rates for US$

16.4 Research methodology

16.5 Data procurement

Information sources

16.6 Data validation

16.7 Validation techniques employed for market sizing

16.8 Data synthesis

16.9 360 degree market analysis

16.10 List of abbreviations

Research Methodology

Technavio presents a detailed picture of the market by way of study, synthesis, and summation of data from multiple sources. The analysts have presented the various facets of the market with a particular focus on identifying the key industry influencers. The data thus presented is comprehensive, reliable, and the result of extensive research, both primary and secondary.

INFORMATION SOURCES

Primary sources

  • Manufacturers and suppliers
  • Channel partners
  • Industry experts
  • Strategic decision makers

Secondary sources

  • Industry journals and periodicals
  • Government data
  • Financial reports of key industry players
  • Historical data
  • Press releases

DATA ANALYSIS

Data Synthesis

  • Collation of data
  • Estimation of key figures
  • Analysis of derived insights

Data Validation

  • Triangulation with data models
  • Reference against proprietary databases
  • Corroboration with industry experts

REPORT WRITING

Qualitative

  • Market drivers
  • Market challenges
  • Market trends
  • Five forces analysis

Quantitative

  • Market size and forecast
  • Market segmentation
  • Geographical insights
  • Competitive landscape

Interested in this report?

Get your sample now to see our research methodology and insights!

Download Now

Frequently Asked Questions

Safety Shoes market growth will increase by USD 2233.9 million during 2026-2030.

The Safety Shoes market is expected to grow at a CAGR of 6.3% during 2026-2030.

Safety Shoes market is segmented by Distribution channel (Offline, Online) End-user (Construction, Chemical , Manufacturing , Mining , Others) Material (Leather, Rubber, Polyurethane, EVA, Others)

Bata Corp., Carhartt Inc., Caterpillar Inc., Cofra Srl, Dunlop Protective Footwear, ELTEN GmbH, Gabri Shoes, Honeywell International Inc., KARAM Safety Pvt. Ltd., KEEN Inc., Pezzol Industries Srl, Rahman Group, Red Wing Brands of America, Safetyking Industrial Footwear, Steel Blue, U Power Group SpA, Uvex Group, VF Corp., W L Gore and Associates Inc. are a few of the key vendors in the Safety Shoes market.

APAC will register the highest growth rate of 39.3% among the other regions. Therefore, the Safety Shoes market in APAC is expected to garner significant business opportunities for the vendors during the forecast period.

China, India, Japan, South Korea, Australia, Indonesia, US, Canada, Mexico, Germany, UK, France, Italy, The Netherlands, Spain, Brazil, Argentina, Colombia, Saudi Arabia, UAE, South Africa, Israel, Turkey

  • Stringent standards for manufacturing safety shoes is the driving factor this market.

The Safety Shoes market vendors should focus on grabbing business opportunities from the Distribution channel segment as it accounted for the largest market share in the base year.
RIA - Research AI Assistant
Ask RIA