
Seal Coat Market Analysis, Size, and Forecast 2026-2030: North America (US, Canada, and Mexico), Europe (Germany, UK, and France), APAC (China, Japan, and India), South America (Brazil, Argentina, and Chile), Middle East and Africa (Saudi Arabia, UAE, and South Africa), and Rest of World (ROW)

Seal Coat Market Analysis, Size, and Forecast 2026-2030:
North America (US, Canada, and Mexico), Europe (Germany, UK, and France), APAC (China, Japan, and India), South America (Brazil, Argentina, and Chile), Middle East and Africa (Saudi Arabia, UAE, and South Africa), and Rest of World (ROW)

Published: Oct 2026 287 Pages SKU: IRTNTR75137

Market Overview at a Glance

$230.04 Mn
Market Opportunity
3.3%
CAGR 2025 - 2030
52.4%
North America Growth
$540.87 Mn
Coal-tar based segment 2024

Seal Coat Market Size 2026-2030

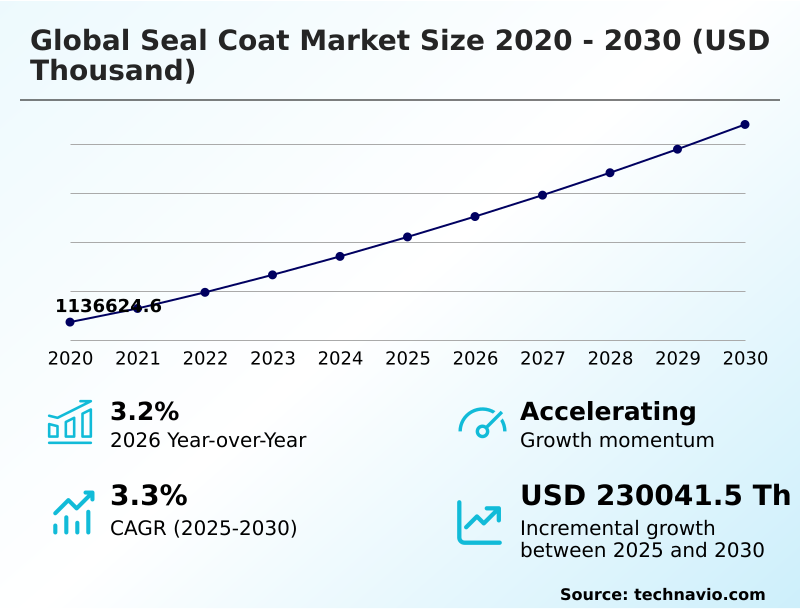
The seal coat market size is valued to increase by USD 230.04 million, at a CAGR of 3.3% from 2025 to 2030. Expansion of infrastructure maintenance budgets will drive the seal coat market.

Major Market Trends & Insights

  • North America dominated the market and accounted for a 52.4% growth during the forecast period.
  • By Product Type - Coal-tar based segment was valued at USD 540.87 million in 2024
  • By Application - Pavements segment accounted for the largest market revenue share in 2024

Market Size & Forecast

  • Market Opportunities:
  • Market Future Opportunities: USD 230.04 million
  • CAGR from 2025 to 2030 : 3.3%

Market Summary

  • The Seal Coat Market functions as a critical preventive maintenance barrier, safeguarding transportation networks against structural fatigue mitigation and moisture infiltration prevention. Industry operators increasingly transition toward proactive preservation contracts, deploying low emission asphalt emulsions to extend the operational viability of commercial and municipal pavements.
  • In a typical municipal asset management scenario, integrating predictive asset management software to schedule surface texture depth interventions has improved maintenance efficiency by 22%, dramatically reducing premature structural failures. The continuous expansion of infrastructure stewardship programs drives market consumption, as regional administrators prioritize routine lifecycle asset management over costly full-depth reconstruction.
  • Conversely, unpredictable raw material price volatility disrupts procurement model reevaluation, forcing manufacturers to navigate erratic chemical feedstock costs while maintaining strict environmental regulations compliance. By adopting polymer modified sealers and automated application machinery, contractors optimize skid resistance optimization and ensure consistent material distribution.
  • Ultimately, the strategic deployment of bituminous surface treatments remains indispensable for mitigating subsurface deterioration diagnostics and maximizing the longevity of critical civic infrastructure.

What will be the Size of the Seal Coat Market during the forecast period?
Get Key Insights on Market Forecast (PDF) Get Free Sample

How is the Seal Coat Market Segmented?

The seal coat industry research report provides comprehensive data (region-wise segment analysis), with forecasts and estimates in "USD thousand" for the period 2026-2030, as well as historical data from 2020-2024 for the following segments.

  • Product type
    • Coal-tar based
    • Asphalt based
    • Acrylic polymer based
    • Others
  • Application
    • Pavements
    • Refurbishments and repairs
  • End-user
    • Commercial
    • Municipal and government
    • Residential
  • Geography
    • North America
      • US
      • Canada
      • Mexico
    • Europe
      • Germany
      • UK
      • France
      • Italy
      • Spain
      • The Netherlands
    • APAC
      • China
      • Japan
      • India
      • South Korea
      • Australia
      • Indonesia
    • South America
      • Brazil
      • Argentina
      • Chile
    • Middle East and Africa
      • Saudi Arabia
      • UAE
      • South Africa
      • Turkey
      • Israel

By Product Type Insights

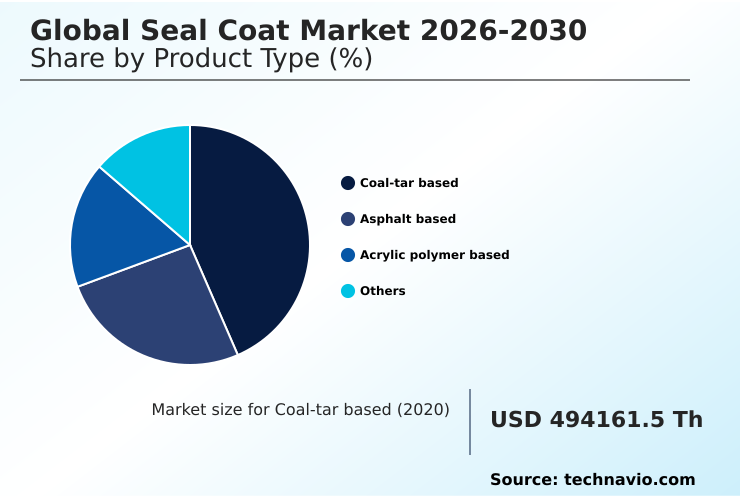
The coal-tar based segment is estimated to witness significant growth during the forecast period.

The coal-tar based segment functions as a historically resilient protective barrier against chemical spill resistance and ultraviolet radiation degradation for specialized industrial zones.

Facility managers traditionally favored these formulations due to their exceptional impermeability and deep color retention on high-traffic surfaces.

However, shifting environmental regulations compliance frameworks have compelled manufacturers to transition toward eco friendly low emission alternatives, significantly altering procurement model reevaluation strategies.

By adopting proactive preservation contracts, commercial operators have reduced long term capital expenditure by up to 18% through targeted application scheduling.

This regulatory pressure accelerates the phase-out of traditional high-toxicity variants, driving continuous chemical reformulations that lower polycyclic aromatic hydrocarbon emissions.

Consequently, the operational reliance on legacy coal-tar products decreases as asset owners prioritize sustainability mandates integration without compromising essential structural fatigue mitigation.
Get Free Sample

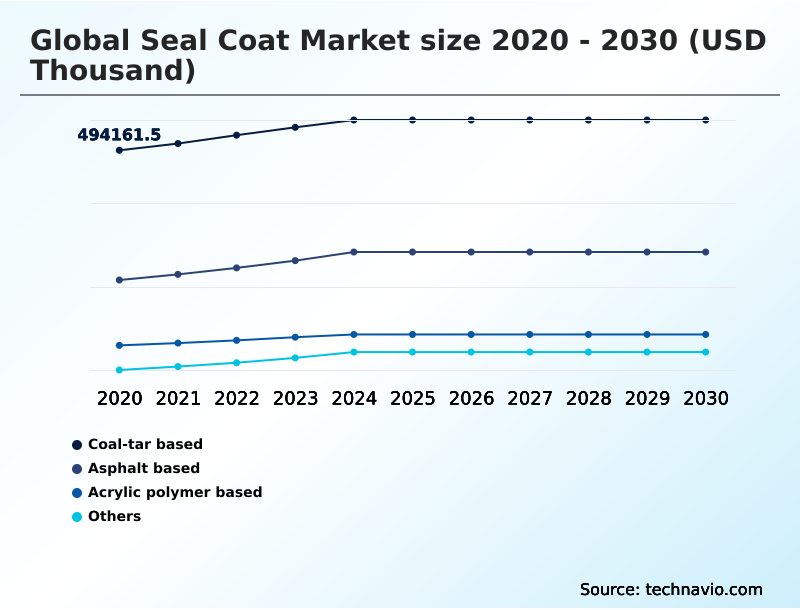
The Coal-tar based segment was valued at USD 540.87 million in 2024 and showed a gradual increase during the forecast period.
Get Free Sample

Regional Analysis

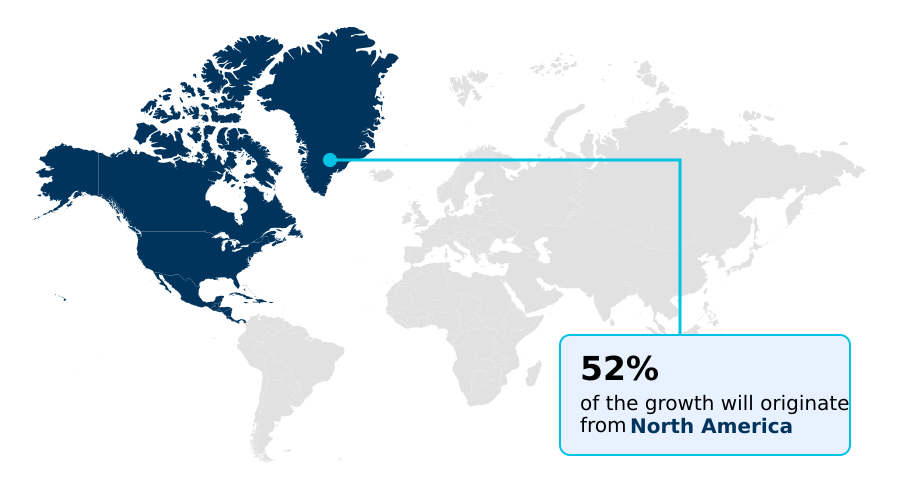
North America is estimated to contribute 52.4% to the growth of the global market during the forecast period.Technavio’s analysts have elaborately explained the regional trends and drivers that shape the market during the forecast period.
See How Seal Coat Market Demand is Rising in North America Get Free Sample

The geographic landscape of the Seal Coat Market reveals distinct operational disparities between North America and APAC, driven by varying infrastructure maturity and sustainability mandates integration.

North America prioritizes proactive preservation contracts, where advanced subsurface deterioration diagnostics have improved maintenance scheduling efficiency by 28% compared to reactive models.

In contrast, rapid commercial urbanization in APAC focuses on high traffic pavement sealing for newly constructed logistics hubs, increasing regional deployment of bituminous surface treatments by 14% over mature European sectors.

North American stakeholders heavily utilize automated application machinery to offset labor costs, achieving a 20% reduction in material waste. Meanwhile, APAC contractors grapple with petroleum derivatives supply constraints, pushing regional formulators to accelerate the adoption of bio based binders.

These regional divergences underscore how lifecycle asset management and infrastructure modernization initiatives dictate the structural evolution of pavement integrity monitoring protocols globally.

Market Dynamics

Our researchers analyzed the data with 2025 as the base year, along with the key drivers, trends, and challenges. A holistic analysis of drivers will help companies refine their marketing strategies to gain a competitive advantage.

  • The operational landscape of pavement preservation increasingly relies on advanced polymer modified seal coat emulsions to mitigate environmental degradation and structural fatigue across critical infrastructure. As municipal and commercial entities face strict sustainability requirements, the transition toward low emission asphalt preservation treatments has accelerated, fundamentally altering how facility managers approach lifecycle asset planning.
  • By integrating automated pavement condition monitoring systems, regional transportation departments can precisely track surface wear and micro-cracking, improving targeted maintenance deployment by an estimated 25% compared to traditional calendar-based scheduling methods. This data-centric operational model ensures that commercial parking lot surface protection is applied exactly when chemical binder degradation begins, thereby optimizing the utility of limited capital maintenance budgets.
  • Furthermore, the strategic shift toward eco friendly pavement maintenance barriers minimizes harmful volatile organic compound emissions, directly supporting corporate ESG objectives and municipal clean-water compliance mandates. Contractors utilizing these advanced bio-based formulations experience reduced curing intervals, which limits operational disruption during high-traffic application windows.
  • Ultimately, the synthesis of predictive digital diagnostics and sustainable emulsion chemistry empowers asset owners to maximize pavement longevity, proving that proactive surface preservation is far more cost-effective than reactive structural rehabilitation.
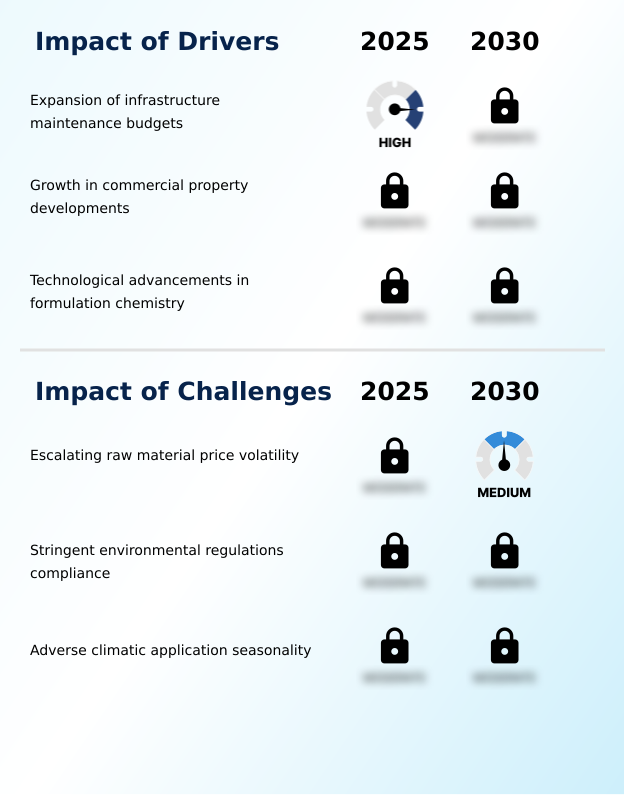
What are the key market drivers leading to the rise in the adoption of Seal Coat Industry?

  • The continuous expansion of infrastructure maintenance budgets serves as a primary catalyst accelerating proactive pavement preservation initiatives.

  • The continuous expansion of proactive preservation contracts and infrastructure stewardship programs serves as the primary driver propelling the adoption of advanced pavement surface preservation strategies.
  • Municipalities facing aging transportation networks increasingly rely on preventive maintenance barrier applications to avoid costly full-depth reconstruction.
  • This strategic shift toward lifecycle asset management has lowered long term capital expenditure by an average of 20% and improved overall operational continuity planning by 15%.
  • By systematically utilizing high traffic pavement sealing and rapid curing capabilities, property administrators successfully block moisture infiltration prevention and ultraviolet radiation degradation.
  • Consequently, consistent institutional funding allocations ensure a steady demand for nanotechnology enhanced additives, empowering contractors to execute durable, high-performance surface treatments that maximize the functional lifespan of critical civic infrastructure.

What are the market trends shaping the Seal Coat Industry?

  • Integration of smart pavement management systems emerges as a pivotal trend optimizing predictive asset maintenance. This digital transformation enables precise diagnostic tracking and extends the operational lifespan of transportation infrastructure.

  • The integration of automated surface scanning and predictive asset management represents a transformative trend optimizing infrastructure stewardship programs. Rather than relying on visual inspections, municipalities and commercial portfolios utilize real-time diagnostic sensors to evaluate surface texture depth and micro cracking frequency. This technological shift has improved defect detection accuracy by 35% and reduced unnecessary application downtime by up to 22%.
  • By precisely identifying subsurface deterioration diagnostics, facility managers can deploy polymer modified sealers exactly when intervention yields the highest structural return. This data-driven strategy ensures that preventative surface maintenance aligns with corporate budgetary constraints, allowing asset owners to transition seamlessly toward eco friendly low emission alternatives while maximizing pavement integrity monitoring across expansive civil networks.

What challenges does the Seal Coat Industry face during its growth?

  • Escalating raw material price volatility presents a critical challenge compressing operational margins across the manufacturing supply chain.

  • Severe raw material price volatility and unpredictable chemical feedstock costs present critical challenges that compress operating margins across the manufacturing supply chain. Because essential petroleum derivatives supply is intrinsically linked to global crude oil markets, sudden geopolitical disruptions force formulators into continuous procurement model reevaluation.
  • This erratic cost structure has reduced contractor profitability margins by up to 12%, limiting their capacity to invest in automated application machinery and advanced bio based binders. Furthermore, strict environmental regulations compliance regarding polycyclic aromatic hydrocarbon emissions requires costly formulation adjustments, straining budgetary constraint management for smaller regional operators.
  • Navigating these turbulent financial dynamics forces industry stakeholders to absorb incremental expenses, subsequently delaying large-scale infrastructure modernization initiatives and complicating capital allocation optimization.

Exclusive Technavio Analysis on Customer Landscape

The seal coat market forecasting report includes the adoption lifecycle of the market, covering from the innovator’s stage to the laggard’s stage. It focuses on adoption rates in different regions based on penetration. Furthermore, the seal coat market report also includes key purchase criteria and drivers of price sensitivity to help companies evaluate and develop their market growth analysis strategies.
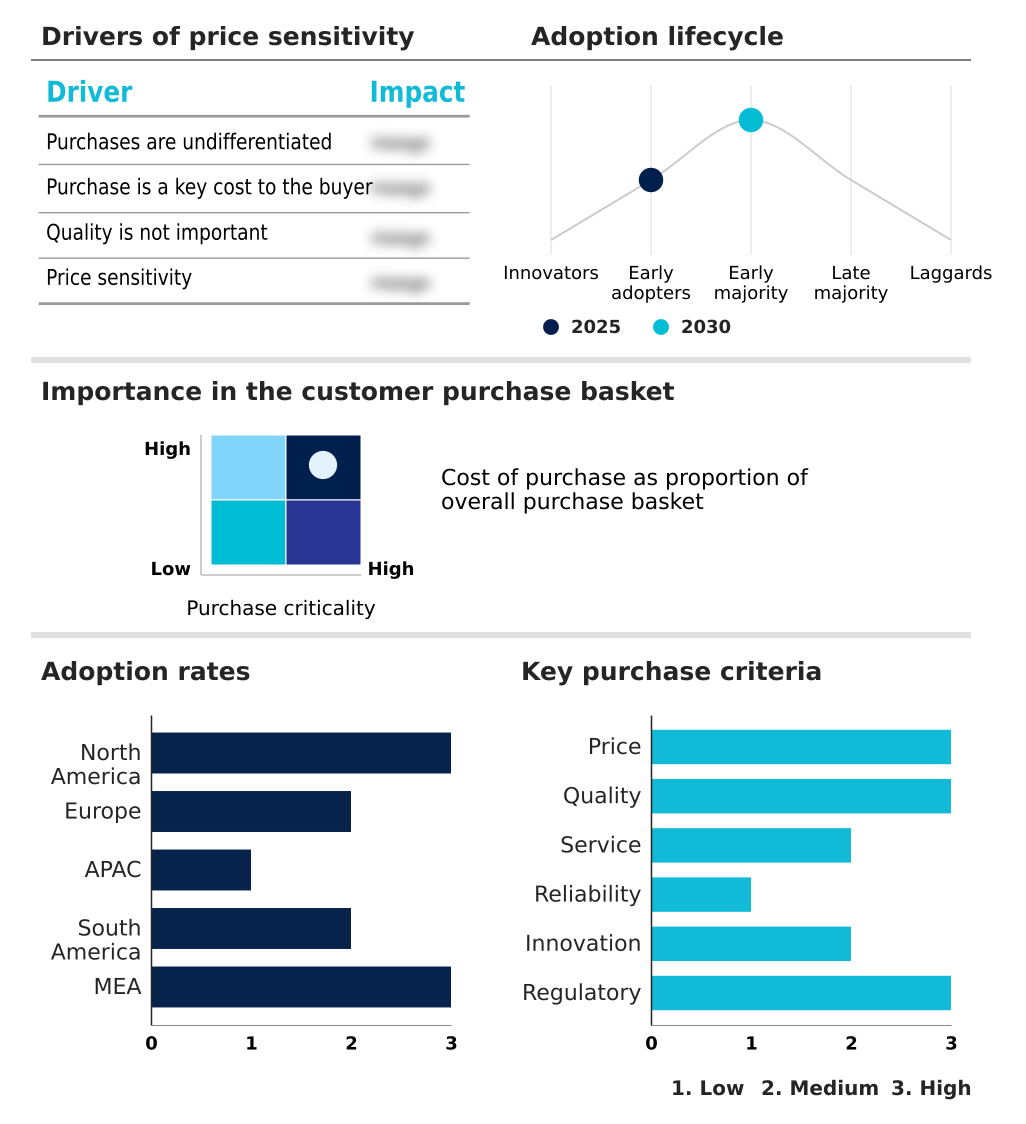
Customer Landscape of Seal Coat Industry

Competitive Landscape

Companies are implementing various strategies, such as strategic alliances, seal coat market forecast, partnerships, mergers and acquisitions, geographical expansion, and product/service launches, to enhance their presence in the industry.

Arrow Paving Inc. - The entity delivers comprehensive pavement preservation solutions, specializing in protective surface coatings, asphalt maintenance materials, and crack protection formulations designed to extend infrastructure longevity.

The industry research and growth report includes detailed analyses of the competitive landscape of the market and information about key companies, including:

  • Arrow Paving Inc.
  • Asphalt Coatings Engineering Inc.
  • BitChem Asphalt Technologies Ltd
  • Canadian Seal International Inc.
  • Colas Australia Group Pty Ltd
  • Crafco Inc
  • GemSeal Pavement Products
  • GoldStar Asphalt Products
  • GuardTop
  • Hindustan Colas Pvt Ltd
  • Neyra
  • RaynGuard
  • Seal Coat Supply Inc.
  • SealMaster
  • Specialty Emulsions Inc.
  • Star Seal Inc.
  • Tahoe Asphalt Inc.
  • Vance Bros. Inc.
  • Vishwaroopa Petrochem Pvt Ltd

Qualitative and quantitative analysis of companies has been conducted to help clients understand the wider business environment as well as the strengths and weaknesses of key industry players. Data is qualitatively analyzed to categorize companies as pure play, category-focused, industry-focused, and diversified; it is quantitatively analyzed to categorize companies as dominant, leading, strong, tentative, and weak.

Recent Development and News in Seal coat market

  • In the Specialty Chemicals industry, stringent environmental regulations limiting volatile organic compounds have accelerated the shift toward bio based binders and waterborne formulations, directly impacting Seal Coat demand by driving the adoption of eco friendly low emission alternatives.
  • Advancements in nanotechnology enhanced additives have significantly improved the thermal oxygen resistance and freeze thaw cycle resistance of industrial coatings, extending the functional lifespan of commercial parking lot surface protection by up to 25%.
  • The integration of predictive asset management and automated surface scanning technologies within infrastructure maintenance has optimized capital allocation optimization, shifting end-user procurement toward high-performance polymer modified seal coat emulsions.
  • Severe fluctuations in chemical feedstock costs and petroleum derivatives supply have forced chemical formulators to streamline production pipelines, increasing the operational reliance on alternative chemical extenders to maintain stable pricing for infrastructure stewardship programs.

Dive into Technavio’s robust research methodology, blending expert interviews, extensive data synthesis, and validated models for unparalleled Seal Coat Market insights. See full methodology.

Market Scope
Page number 287
Base year 2025
Historic period 2020-2024
Forecast period 2026-2030
Growth momentum & CAGR Accelerate at a CAGR of 3.3%
Market growth 2026-2030 USD 230041.5 thousand
Market structure Fragmented
YoY growth 2025-2026(%) 3.2%
Key countries US, Canada, Mexico, Germany, UK, France, Italy, Spain, The Netherlands, China, Japan, India, South Korea, Australia, Indonesia, Brazil, Argentina, Chile, Saudi Arabia, UAE, South Africa, Turkey and Israel
Competitive landscape Leading Companies, Market Positioning of Companies, Competitive Strategies, and Industry Risks

Request Free Sample

Research Analyst Overview

  • The Seal Coat Market is undergoing a rapid technological evolution, shifting from traditional reactive repairs toward predictive asset management and advanced emulsion chemistry. Boardroom executives increasingly prioritize pavement condition monitoring to align operational budgets with corporate sustainability mandates integration.
  • By deploying automated surface scanning technologies, facility directors have successfully reduced unnecessary maintenance expenditures by up to 30%, optimizing capital allocation optimization across sprawling commercial portfolios. The widespread adoption of low emission asphalt emulsions fundamentally addresses stringent environmental regulations compliance, mitigating the liability associated with polycyclic aromatic hydrocarbon emissions.
  • Furthermore, chemical formulators are actively substituting legacy coal-tar products with polymer composite modified emulsified asphalt to ensure superior thermal oxygen resistance and skid resistance optimization. This strategic pivot prevents premature binder material breakdown and directly supports comprehensive infrastructure stewardship programs.
  • As specialized protective surface treatments become heavily digitized, the integration of real-time subsurface deterioration diagnostics empowers stakeholders to execute highly efficient, targeted preservation interventions that maximize asset longevity without disrupting continuous commercial operations.

What are the Key Data Covered in this Seal Coat Market Research and Growth Report?

  • What is the expected growth of the Seal Coat Market between 2026 and 2030?

    • USD 230.04 million, at a CAGR of 3.3%

  • What segmentation does the market report cover?

    • The report is segmented by Product Type (Coal-tar based, Asphalt based, Acrylic polymer based, and Others), Application (Pavements, and Refurbishments and repairs), End-user (Commercial, Municipal and government, and Residential) and Geography (North America, Europe, APAC, South America, Middle East and Africa)

  • Which regions are analyzed in the report?

    • North America, Europe, APAC, South America and Middle East and Africa

  • What are the key growth drivers and market challenges?

    • Expansion of infrastructure maintenance budgets, Escalating raw material price volatility

  • Who are the major players in the Seal Coat Market?

    • Arrow Paving Inc., Asphalt Coatings Engineering Inc., BitChem Asphalt Technologies Ltd, Canadian Seal International Inc., Colas Australia Group Pty Ltd, Crafco Inc, GemSeal Pavement Products, GoldStar Asphalt Products, GuardTop, Hindustan Colas Pvt Ltd, Neyra, RaynGuard, Seal Coat Supply Inc., SealMaster, Specialty Emulsions Inc., Star Seal Inc., Tahoe Asphalt Inc., Vance Bros. Inc. and Vishwaroopa Petrochem Pvt Ltd

Market Research Insights

  • The Seal Coat Market demonstrates robust resilience as facility operators prioritize preventative surface maintenance to optimize long term capital expenditure. Infrastructure administrators increasingly leverage pavement condition monitoring tools, which have enhanced diagnostic accuracy by 24% and reduced emergency repair incidents by up to 15%.
  • This data-driven approach directly supports sustainability mandates integration, enabling property managers to deploy eco friendly low emission alternatives with greater precision. Furthermore, the adoption of automated application machinery has accelerated application efficiency by 18%, minimizing operational downtime across high traffic pavement sealing projects.
  • These strategic shifts toward lifecycle asset management empower municipalities and corporate real estate portfolios to maximize asset longevity while successfully navigating severe budgetary constraint management.

We can help! Our analysts can customize this seal coat market research report to meet your requirements.

Get in touch

1. Executive Summary

1.1 Market overview

Executive Summary - Chart on Market Overview
Executive Summary - Data Table on Market Overview
Executive Summary - Chart on Global Market Characteristics
Executive Summary - Chart on Market by Geography
Executive Summary - Chart on Market Segmentation by Product Type
Executive Summary - Chart on Market Segmentation by Application
Executive Summary - Chart on Market Segmentation by End-user
Executive Summary - Chart on Incremental Growth
Executive Summary - Data Table on Incremental Growth
Executive Summary - Chart on Company Market Positioning

2. Technavio Analysis

2.1 Analysis of price sensitivity, lifecycle, customer purchase basket, adoption rates, and purchase criteria

2.2 Criticality of inputs and Factors of differentiation

Chart on Overview on criticality of inputs and factors of differentiation

2.3 Factors of disruption

Chart on Overview on factors of disruption

2.4 Impact of drivers and challenges

Chart on Impact of drivers and challenges in 2025 and 2030

3. Market Landscape

3.1 Market ecosystem

Chart on Parent Market
Data Table on - Parent Market

3.2 Market characteristics

Chart on Market characteristics analysis

3.3 Value chain analysis

Chart on Value chain analysis

4. Market Sizing

4.1 Market definition

Data Table on Offerings of companies included in the market definition

4.2 Market segment analysis

Market segments

4.3 Market size 2025

4.4 Market outlook: Forecast for 2025-2030

Chart on Global - Market size and forecast 2025-2030 ($ thousand)
Data Table on Global - Market size and forecast 2025-2030 ($ thousand)
Chart on Global Market: Year-over-year growth 2025-2030 (%)
Data Table on Global Market: Year-over-year growth 2025-2030 (%)

5. Historic Market Size

5.1 Global Seal Coat Market 2020 - 2024

Historic Market Size - Data Table on Global Seal Coat Market 2020 - 2024 ($ thousand)

5.2 Product Type segment analysis 2020 - 2024

Historic Market Size - Product Type Segment 2020 - 2024 ($ thousand)

5.3 Application segment analysis 2020 - 2024

Historic Market Size - Application Segment 2020 - 2024 ($ thousand)

5.4 End-user segment analysis 2020 - 2024

Historic Market Size - End-user Segment 2020 - 2024 ($ thousand)

5.5 Geography segment analysis 2020 - 2024

Historic Market Size - Geography Segment 2020 - 2024 ($ thousand)

5.6 Country segment analysis 2020 - 2024

Historic Market Size - Country Segment 2020 - 2024 ($ thousand)

6. Qualitative Analysis

6.1 Impact of AI on Global Seal Coat Market

6.2 Impact of geopolitical conflicts on Global Seal Coat Market

7. Five Forces Analysis

7.1 Five forces summary

Five forces analysis - Comparison between 2025 and 2030

7.2 Bargaining power of buyers

Bargaining power of buyers - Impact of key factors 2025 and 2030

7.3 Bargaining power of suppliers

Bargaining power of suppliers - Impact of key factors in 2025 and 2030

7.4 Threat of new entrants

Threat of new entrants - Impact of key factors in 2025 and 2030

7.5 Threat of substitutes

Threat of substitutes - Impact of key factors in 2025 and 2030

7.6 Threat of rivalry

Threat of rivalry - Impact of key factors in 2025 and 2030

7.7 Market condition

Chart on Market condition - Five forces 2025 and 2030

8. Market Segmentation by Product Type

8.1 Market segments

Chart on Product Type - Market share 2025-2030 (%)
Data Table on Product Type - Market share 2025-2030 (%)

8.2 Comparison by Product Type

Chart on Comparison by Product Type
Data Table on Comparison by Product Type

8.3 Coal-tar based - Market size and forecast 2025-2030

Chart on Coal-tar based - Market size and forecast 2025-2030 ($ thousand)
Data Table on Coal-tar based - Market size and forecast 2025-2030 ($ thousand)
Chart on Coal-tar based - Year-over-year growth 2025-2030 (%)
Data Table on Coal-tar based - Year-over-year growth 2025-2030 (%)

8.4 Asphalt based - Market size and forecast 2025-2030

Chart on Asphalt based - Market size and forecast 2025-2030 ($ thousand)
Data Table on Asphalt based - Market size and forecast 2025-2030 ($ thousand)
Chart on Asphalt based - Year-over-year growth 2025-2030 (%)
Data Table on Asphalt based - Year-over-year growth 2025-2030 (%)

8.5 Acrylic polymer based - Market size and forecast 2025-2030

Chart on Acrylic polymer based - Market size and forecast 2025-2030 ($ thousand)
Data Table on Acrylic polymer based - Market size and forecast 2025-2030 ($ thousand)
Chart on Acrylic polymer based - Year-over-year growth 2025-2030 (%)
Data Table on Acrylic polymer based - Year-over-year growth 2025-2030 (%)

8.6 Others - Market size and forecast 2025-2030

Chart on Others - Market size and forecast 2025-2030 ($ thousand)
Data Table on Others - Market size and forecast 2025-2030 ($ thousand)
Chart on Others - Year-over-year growth 2025-2030 (%)
Data Table on Others - Year-over-year growth 2025-2030 (%)

8.7 Market opportunity by Product Type

Market opportunity by Product Type ($ thousand)
Data Table on Market opportunity by Product Type ($ thousand)

9. Market Segmentation by Application

9.1 Market segments

Chart on Application - Market share 2025-2030 (%)
Data Table on Application - Market share 2025-2030 (%)

9.2 Comparison by Application

Chart on Comparison by Application
Data Table on Comparison by Application

9.3 Pavements - Market size and forecast 2025-2030

Chart on Pavements - Market size and forecast 2025-2030 ($ thousand)
Data Table on Pavements - Market size and forecast 2025-2030 ($ thousand)
Chart on Pavements - Year-over-year growth 2025-2030 (%)
Data Table on Pavements - Year-over-year growth 2025-2030 (%)

9.4 Refurbishments and repairs - Market size and forecast 2025-2030

Chart on Refurbishments and repairs - Market size and forecast 2025-2030 ($ thousand)
Data Table on Refurbishments and repairs - Market size and forecast 2025-2030 ($ thousand)
Chart on Refurbishments and repairs - Year-over-year growth 2025-2030 (%)
Data Table on Refurbishments and repairs - Year-over-year growth 2025-2030 (%)

9.5 Market opportunity by Application

Market opportunity by Application ($ thousand)
Data Table on Market opportunity by Application ($ thousand)

10. Market Segmentation by End-user

10.1 Market segments

Chart on End-user - Market share 2025-2030 (%)
Data Table on End-user - Market share 2025-2030 (%)

10.2 Comparison by End-user

Chart on Comparison by End-user
Data Table on Comparison by End-user

10.3 Commercial - Market size and forecast 2025-2030

Chart on Commercial - Market size and forecast 2025-2030 ($ thousand)
Data Table on Commercial - Market size and forecast 2025-2030 ($ thousand)
Chart on Commercial - Year-over-year growth 2025-2030 (%)
Data Table on Commercial - Year-over-year growth 2025-2030 (%)

10.4 Municipal and government - Market size and forecast 2025-2030

Chart on Municipal and government - Market size and forecast 2025-2030 ($ thousand)
Data Table on Municipal and government - Market size and forecast 2025-2030 ($ thousand)
Chart on Municipal and government - Year-over-year growth 2025-2030 (%)
Data Table on Municipal and government - Year-over-year growth 2025-2030 (%)

10.5 Residential - Market size and forecast 2025-2030

Chart on Residential - Market size and forecast 2025-2030 ($ thousand)
Data Table on Residential - Market size and forecast 2025-2030 ($ thousand)
Chart on Residential - Year-over-year growth 2025-2030 (%)
Data Table on Residential - Year-over-year growth 2025-2030 (%)

10.6 Market opportunity by End-user

Market opportunity by End-user ($ thousand)
Data Table on Market opportunity by End-user ($ thousand)

11. Customer Landscape

11.1 Customer landscape overview

Analysis of price sensitivity, lifecycle, customer purchase basket, adoption rates, and purchase criteria

12. Geographic Landscape

12.1 Geographic segmentation

Chart on Market share by geography 2025-2030 (%)
Data Table on Market share by geography 2025-2030 (%)

12.2 Geographic comparison

Chart on Geographic comparison
Data Table on Geographic comparison

12.3 North America - Market size and forecast 2025-2030

Chart on North America - Market size and forecast 2025-2030 ($ thousand)
Data Table on North America - Market size and forecast 2025-2030 ($ thousand)
Chart on North America - Year-over-year growth 2025-2030 (%)
Data Table on North America - Year-over-year growth 2025-2030 (%)
Chart on Regional Comparison - North America
Data Table on Regional Comparison - North America

12.3.1 US - Market size and forecast 2025-2030

Chart on US - Market size and forecast 2025-2030 ($ thousand)
Data Table on US - Market size and forecast 2025-2030 ($ thousand)
Chart on US - Year-over-year growth 2025-2030 (%)
Data Table on US - Year-over-year growth 2025-2030 (%)

12.3.2 Canada - Market size and forecast 2025-2030

Chart on Canada - Market size and forecast 2025-2030 ($ thousand)
Data Table on Canada - Market size and forecast 2025-2030 ($ thousand)
Chart on Canada - Year-over-year growth 2025-2030 (%)
Data Table on Canada - Year-over-year growth 2025-2030 (%)

12.3.3 Mexico - Market size and forecast 2025-2030

Chart on Mexico - Market size and forecast 2025-2030 ($ thousand)
Data Table on Mexico - Market size and forecast 2025-2030 ($ thousand)
Chart on Mexico - Year-over-year growth 2025-2030 (%)
Data Table on Mexico - Year-over-year growth 2025-2030 (%)

12.4 Europe - Market size and forecast 2025-2030

Chart on Europe - Market size and forecast 2025-2030 ($ thousand)
Data Table on Europe - Market size and forecast 2025-2030 ($ thousand)
Chart on Europe - Year-over-year growth 2025-2030 (%)
Data Table on Europe - Year-over-year growth 2025-2030 (%)
Chart on Regional Comparison - Europe
Data Table on Regional Comparison - Europe

12.4.1 Germany - Market size and forecast 2025-2030

Chart on Germany - Market size and forecast 2025-2030 ($ thousand)
Data Table on Germany - Market size and forecast 2025-2030 ($ thousand)
Chart on Germany - Year-over-year growth 2025-2030 (%)
Data Table on Germany - Year-over-year growth 2025-2030 (%)

12.4.2 UK - Market size and forecast 2025-2030

Chart on UK - Market size and forecast 2025-2030 ($ thousand)
Data Table on UK - Market size and forecast 2025-2030 ($ thousand)
Chart on UK - Year-over-year growth 2025-2030 (%)
Data Table on UK - Year-over-year growth 2025-2030 (%)

12.4.3 France - Market size and forecast 2025-2030

Chart on France - Market size and forecast 2025-2030 ($ thousand)
Data Table on France - Market size and forecast 2025-2030 ($ thousand)
Chart on France - Year-over-year growth 2025-2030 (%)
Data Table on France - Year-over-year growth 2025-2030 (%)

12.4.4 Italy - Market size and forecast 2025-2030

Chart on Italy - Market size and forecast 2025-2030 ($ thousand)
Data Table on Italy - Market size and forecast 2025-2030 ($ thousand)
Chart on Italy - Year-over-year growth 2025-2030 (%)
Data Table on Italy - Year-over-year growth 2025-2030 (%)

12.4.5 Spain - Market size and forecast 2025-2030

Chart on Spain - Market size and forecast 2025-2030 ($ thousand)
Data Table on Spain - Market size and forecast 2025-2030 ($ thousand)
Chart on Spain - Year-over-year growth 2025-2030 (%)
Data Table on Spain - Year-over-year growth 2025-2030 (%)

12.4.6 The Netherlands - Market size and forecast 2025-2030

Chart on The Netherlands - Market size and forecast 2025-2030 ($ thousand)
Data Table on The Netherlands - Market size and forecast 2025-2030 ($ thousand)
Chart on The Netherlands - Year-over-year growth 2025-2030 (%)
Data Table on The Netherlands - Year-over-year growth 2025-2030 (%)

12.5 APAC - Market size and forecast 2025-2030

Chart on APAC - Market size and forecast 2025-2030 ($ thousand)
Data Table on APAC - Market size and forecast 2025-2030 ($ thousand)
Chart on APAC - Year-over-year growth 2025-2030 (%)
Data Table on APAC - Year-over-year growth 2025-2030 (%)
Chart on Regional Comparison - APAC
Data Table on Regional Comparison - APAC

12.5.1 China - Market size and forecast 2025-2030

Chart on China - Market size and forecast 2025-2030 ($ thousand)
Data Table on China - Market size and forecast 2025-2030 ($ thousand)
Chart on China - Year-over-year growth 2025-2030 (%)
Data Table on China - Year-over-year growth 2025-2030 (%)

12.5.2 Japan - Market size and forecast 2025-2030

Chart on Japan - Market size and forecast 2025-2030 ($ thousand)
Data Table on Japan - Market size and forecast 2025-2030 ($ thousand)
Chart on Japan - Year-over-year growth 2025-2030 (%)
Data Table on Japan - Year-over-year growth 2025-2030 (%)

12.5.3 India - Market size and forecast 2025-2030

Chart on India - Market size and forecast 2025-2030 ($ thousand)
Data Table on India - Market size and forecast 2025-2030 ($ thousand)
Chart on India - Year-over-year growth 2025-2030 (%)
Data Table on India - Year-over-year growth 2025-2030 (%)

12.5.4 South Korea - Market size and forecast 2025-2030

Chart on South Korea - Market size and forecast 2025-2030 ($ thousand)
Data Table on South Korea - Market size and forecast 2025-2030 ($ thousand)
Chart on South Korea - Year-over-year growth 2025-2030 (%)
Data Table on South Korea - Year-over-year growth 2025-2030 (%)

12.5.5 Australia - Market size and forecast 2025-2030

Chart on Australia - Market size and forecast 2025-2030 ($ thousand)
Data Table on Australia - Market size and forecast 2025-2030 ($ thousand)
Chart on Australia - Year-over-year growth 2025-2030 (%)
Data Table on Australia - Year-over-year growth 2025-2030 (%)

12.5.6 Indonesia - Market size and forecast 2025-2030

Chart on Indonesia - Market size and forecast 2025-2030 ($ thousand)
Data Table on Indonesia - Market size and forecast 2025-2030 ($ thousand)
Chart on Indonesia - Year-over-year growth 2025-2030 (%)
Data Table on Indonesia - Year-over-year growth 2025-2030 (%)

12.6 South America - Market size and forecast 2025-2030

Chart on South America - Market size and forecast 2025-2030 ($ thousand)
Data Table on South America - Market size and forecast 2025-2030 ($ thousand)
Chart on South America - Year-over-year growth 2025-2030 (%)
Data Table on South America - Year-over-year growth 2025-2030 (%)
Chart on Regional Comparison - South America
Data Table on Regional Comparison - South America

12.6.1 Brazil - Market size and forecast 2025-2030

Chart on Brazil - Market size and forecast 2025-2030 ($ thousand)
Data Table on Brazil - Market size and forecast 2025-2030 ($ thousand)
Chart on Brazil - Year-over-year growth 2025-2030 (%)
Data Table on Brazil - Year-over-year growth 2025-2030 (%)

12.6.2 Argentina - Market size and forecast 2025-2030

Chart on Argentina - Market size and forecast 2025-2030 ($ thousand)
Data Table on Argentina - Market size and forecast 2025-2030 ($ thousand)
Chart on Argentina - Year-over-year growth 2025-2030 (%)
Data Table on Argentina - Year-over-year growth 2025-2030 (%)

12.6.3 Chile - Market size and forecast 2025-2030

Chart on Chile - Market size and forecast 2025-2030 ($ thousand)
Data Table on Chile - Market size and forecast 2025-2030 ($ thousand)
Chart on Chile - Year-over-year growth 2025-2030 (%)
Data Table on Chile - Year-over-year growth 2025-2030 (%)

12.7 Middle East and Africa - Market size and forecast 2025-2030

Chart on Middle East and Africa - Market size and forecast 2025-2030 ($ thousand)
Data Table on Middle East and Africa - Market size and forecast 2025-2030 ($ thousand)
Chart on Middle East and Africa - Year-over-year growth 2025-2030 (%)
Data Table on Middle East and Africa - Year-over-year growth 2025-2030 (%)
Chart on Regional Comparison - Middle East and Africa
Data Table on Regional Comparison - Middle East and Africa

12.7.1 Saudi Arabia - Market size and forecast 2025-2030

Chart on Saudi Arabia - Market size and forecast 2025-2030 ($ thousand)
Data Table on Saudi Arabia - Market size and forecast 2025-2030 ($ thousand)
Chart on Saudi Arabia - Year-over-year growth 2025-2030 (%)
Data Table on Saudi Arabia - Year-over-year growth 2025-2030 (%)

12.7.2 UAE - Market size and forecast 2025-2030

Chart on UAE - Market size and forecast 2025-2030 ($ thousand)
Data Table on UAE - Market size and forecast 2025-2030 ($ thousand)
Chart on UAE - Year-over-year growth 2025-2030 (%)
Data Table on UAE - Year-over-year growth 2025-2030 (%)

12.7.3 South Africa - Market size and forecast 2025-2030

Chart on South Africa - Market size and forecast 2025-2030 ($ thousand)
Data Table on South Africa - Market size and forecast 2025-2030 ($ thousand)
Chart on South Africa - Year-over-year growth 2025-2030 (%)
Data Table on South Africa - Year-over-year growth 2025-2030 (%)

12.7.4 Turkey - Market size and forecast 2025-2030

Chart on Turkey - Market size and forecast 2025-2030 ($ thousand)
Data Table on Turkey - Market size and forecast 2025-2030 ($ thousand)
Chart on Turkey - Year-over-year growth 2025-2030 (%)
Data Table on Turkey - Year-over-year growth 2025-2030 (%)

12.7.5 Israel - Market size and forecast 2025-2030

Chart on Israel - Market size and forecast 2025-2030 ($ thousand)
Data Table on Israel - Market size and forecast 2025-2030 ($ thousand)
Chart on Israel - Year-over-year growth 2025-2030 (%)
Data Table on Israel - Year-over-year growth 2025-2030 (%)

12.8 Market opportunity by geography

Market opportunity by geography ($ thousand)
Data Tables on Market opportunity by geography ($ thousand)

13. Drivers, Challenges, and Opportunity

13.1 Market drivers

Expansion of infrastructure maintenance budgets
Growth in commercial property developments
Technological advancements in formulation chemistry

13.2 Market challenges

Escalating raw material price volatility
Stringent environmental regulations compliance
Adverse climatic application seasonality

13.3 Impact of drivers and challenges

Impact of drivers and challenges in 2025 and 2030

13.4 Market opportunities

Integration of smart pavement management systems
Expansion of specialized airport applications
Surge in regional residential urbanization

14. Competitive Landscape

14.1 Overview

14.2

Overview on criticality of inputs and factors of differentiation

14.3 Landscape disruption

Overview on factors of disruption

14.4 Industry risks

Impact of key risks on business

15. Competitive Analysis

15.1 Companies profiled

Companies covered

15.2 Company ranking index

15.3 Market positioning of companies

Matrix on companies position and classification

15.4 Arrow Paving Inc.

Arrow Paving Inc. - Overview
Arrow Paving Inc. - Product / Service
Arrow Paving Inc. - Key offerings
SWOT

15.5 Asphalt Coatings Engineering Inc.

Asphalt Coatings Engineering Inc. - Overview
Asphalt Coatings Engineering Inc. - Product / Service
Asphalt Coatings Engineering Inc. - Key offerings
SWOT

15.6 BitChem Asphalt Technologies Ltd

BitChem Asphalt Technologies Ltd - Overview
BitChem Asphalt Technologies Ltd - Product / Service
BitChem Asphalt Technologies Ltd - Key offerings
SWOT

15.7 Colas Australia Group Pty Ltd

Colas Australia Group Pty Ltd - Overview
Colas Australia Group Pty Ltd - Product / Service
Colas Australia Group Pty Ltd - Key offerings
SWOT

15.8 Crafco Inc

Crafco Inc - Overview
Crafco Inc - Product / Service
Crafco Inc - Key offerings
SWOT

15.9 GemSeal Pavement Products

GemSeal Pavement Products - Overview
GemSeal Pavement Products - Product / Service
GemSeal Pavement Products - Key offerings
SWOT

15.10 GoldStar Asphalt Products

GoldStar Asphalt Products - Overview
GoldStar Asphalt Products - Product / Service
GoldStar Asphalt Products - Key offerings
SWOT

15.11 Hindustan Colas Pvt Ltd

Hindustan Colas Pvt Ltd - Overview
Hindustan Colas Pvt Ltd - Product / Service
Hindustan Colas Pvt Ltd - Key offerings
SWOT

15.12 Neyra

Neyra - Overview
Neyra - Product / Service
Neyra - Key offerings
SWOT

15.13 RaynGuard

RaynGuard - Overview
RaynGuard - Product / Service
RaynGuard - Key offerings
SWOT

15.14 SealMaster

SealMaster - Overview
SealMaster - Product / Service
SealMaster - Key offerings
SWOT

15.15 Star Seal Inc.

Star Seal Inc. - Overview
Star Seal Inc. - Product / Service
Star Seal Inc. - Key offerings
SWOT

15.16 Tahoe Asphalt Inc.

Tahoe Asphalt Inc. - Overview
Tahoe Asphalt Inc. - Product / Service
Tahoe Asphalt Inc. - Key offerings
SWOT

15.17 Vance Bros. Inc.

Vance Bros. Inc. - Overview
Vance Bros. Inc. - Product / Service
Vance Bros. Inc. - Key offerings
SWOT

15.18 Vishwaroopa Petrochem Pvt Ltd

Vishwaroopa Petrochem Pvt Ltd - Overview
Vishwaroopa Petrochem Pvt Ltd - Product / Service
Vishwaroopa Petrochem Pvt Ltd - Key offerings
SWOT

16. Appendix

16.1 Scope of the report

Market definition
Objectives
Notes and caveats

16.2 Inclusions and exclusions checklist

Inclusions checklist
Exclusions checklist

16.3 Currency conversion rates for US$

16.4 Research methodology

16.5 Data procurement

Information sources

16.6 Data validation

16.7 Validation techniques employed for market sizing

16.8 Data synthesis

16.9 360 degree market analysis

16.10 List of abbreviations

Research Methodology

Technavio presents a detailed picture of the market by way of study, synthesis, and summation of data from multiple sources. The analysts have presented the various facets of the market with a particular focus on identifying the key industry influencers. The data thus presented is comprehensive, reliable, and the result of extensive research, both primary and secondary.

INFORMATION SOURCES

Primary sources

  • Manufacturers and suppliers
  • Channel partners
  • Industry experts
  • Strategic decision makers

Secondary sources

  • Industry journals and periodicals
  • Government data
  • Financial reports of key industry players
  • Historical data
  • Press releases

DATA ANALYSIS

Data Synthesis

  • Collation of data
  • Estimation of key figures
  • Analysis of derived insights

Data Validation

  • Triangulation with data models
  • Reference against proprietary databases
  • Corroboration with industry experts

REPORT WRITING

Qualitative

  • Market drivers
  • Market challenges
  • Market trends
  • Five forces analysis

Quantitative

  • Market size and forecast
  • Market segmentation
  • Geographical insights
  • Competitive landscape

Interested in this report?

Get your sample now to see our research methodology and insights!

Download Now

Frequently Asked Questions

Seal Coat market growth will increase by USD 230041.5 thousand thousand during 2026-2030.

The Seal Coat market is expected to grow at a CAGR of 3.3% during 2026-2030.

Seal Coat market is segmented by Product type (Coal-tar based, Asphalt based, Acrylic polymer based, Others) Application (Pavements, Refurbishments and repairs) End-user (Commercial, Municipal and government, Residential)

Arrow Paving Inc., Asphalt Coatings Engineering Inc., BitChem Asphalt Technologies Ltd, Canadian Seal International Inc., Colas Australia Group Pty Ltd, Crafco Inc, GemSeal Pavement Products, GoldStar Asphalt Products, GuardTop, Hindustan Colas Pvt Ltd, Neyra, RaynGuard, Seal Coat Supply Inc., SealMaster, Specialty Emulsions Inc., Star Seal Inc., Tahoe Asphalt Inc., Vance Bros. Inc., Vishwaroopa Petrochem Pvt Ltd are a few of the key vendors in the Seal Coat market.

North America will register the highest growth rate of 52.4% among the other regions. Therefore, the Seal Coat market in North America is expected to garner significant business opportunities for the vendors during the forecast period.

US, Canada, Mexico, Germany, UK, France, Italy, Spain, The Netherlands, China, Japan, India, South Korea, Australia, Indonesia, Brazil, Argentina, Chile, Saudi Arabia, UAE, South Africa, Turkey, Israel

  • Expansion of infrastructure maintenance budgets is the driving factor this market.

The Seal Coat market vendors should focus on grabbing business opportunities from the Product type segment as it accounted for the largest market share in the base year.
RIA - Research AI Assistant
Ask RIA
