Coal Tar Pitch Market Analysis, Size, and Forecast 2025-2029: North America (US), Europe (Germany, Russia, and UK), APAC (China, India, Japan, and South Korea), South America (Brazil), and Rest of World (ROW)

Coal Tar Pitch Market Analysis, Size, and Forecast 2025-2029:
North America (US), Europe (Germany, Russia, and UK), APAC (China, India, Japan, and South Korea), South America (Brazil), and Rest of World (ROW)

Published: Jul 2025 225 Pages SKU: IRTNTR45373

Market Overview at a Glance

$641.8 Mn
Market Opportunity
2.2%
CAGR
2.2
YoY growth 2024-2025(%)

Coal Tar Pitch Market Size 2025-2029

The coal tar pitch market size is forecast to increase by USD 641.8 million, at a CAGR of 2.2% between 2024 and 2029.

  • The market is experiencing significant shifts due to the increasing adoption of aluminum in various industries, which is gradually replacing coal tar pitch in numerous applications. This trend is driven by the superior properties of aluminum, such as its lightweight, strength, and corrosion resistance. However, the market faces challenges as regulations continue to restrict the use of coal tar pitch due to its environmental impact and potential health hazards. These restrictions are leading companies to explore alternative solutions, presenting both opportunities and challenges for market participants. Additionally, waste management practices and environmental impact assessments are crucial in mitigating the industry's environmental footprint.
  • To capitalize on the growing demand for advanced coal tar pitch and aluminum, while navigating regulatory hurdles, market players must focus on innovation, sustainability, and compliance. Structural anisotropy and pitch curing behavior are essential factors in the production of needle coke for electrode manufacturing processes. By investing in research and development, collaborating with regulatory bodies, and adapting to evolving industry trends, companies can effectively position themselves in the market's dynamic landscape. Furthermore, the market is witnessing the emergence of advanced types of coal tar pitch, which offer enhanced performance and durability.

Major Market Trends & Insights

  •   APAC dominated the market and accounted for a 67% during the forecast period.
  •   By the Application, the Aluminum production sub-segment was valued at USD 3268.40 million in 2023
  •   By the Type, the Solid Coal Tar Pitch sub-segment accounted for the largest market revenue share in 2023

Market Size & Forecast

  •     Market Opportunities: USD 16.32 million
  •     Future Opportunities: USD 641.80 million 
  •     CAGR : 2.2%
  •     Base yer largest region tag: Largest market in 2023

What will be the Size of the Coal Tar Pitch Market during the forecast period?

Coal Tar Pitch Market Size

Explore in-depth regional segment analysis with market size data - historical 2019-2023 and forecasts 2025-2029 - in the full report.  
Request Free Sample

The market continues to evolve, driven by the diverse applications in various sectors. Chemical composition analysis and distillation residue analysis are crucial in assessing coke quality, ensuring optimal carbon material characterization for use as a carbon fiber precursor. Carbonization kinetics and pitch viscosity measurement play a significant role in the optimization of binder formulation and the understanding of binder rheological properties. The mesophase pitch structure, pitch oxidation stability, and electrochemical performance are key considerations in the production of pitch-based carbon fibers.

The industry anticipates robust growth, with expectations of a 12% annual expansion in demand for carbon anode materials. For instance, a leading automotive manufacturer reported a 15% increase in sales of electric vehicles, underscoring the growing importance of high-performance carbon materials in the transportation sector. Pitch thermal stability, pitch-based carbon, and pitch binder properties are essential in the production of carbon anode materials for lithium-ion batteries. Pitch softening point analysis and binder impregnation process optimization are crucial in ensuring the quality control testing of these materials. Petroleum pitch refining, aromatic hydrocarbon content assessment, and graphitization behavior analysis are ongoing areas of research, aiming to improve the overall performance and efficiency of coal tar pitch-derived carbon materials.

How is this Coal Tar Pitch Industry segmented?

The coal tar pitch industry research report provides comprehensive data (region-wise segment analysis), with forecasts and estimates in "USD million" for the period 2025-2029, as well as historical data from 2019-2023 for the following segments.

  • Application
    • Aluminum production
    • Graphite electrodes and specialty graphite products
    • Carbon processing industry
    • Others
  • Type
    • Solid coal tar pitch
    • Liquid coal tar pitch
  • Product Type
    • Medium temperature
    • High temperature
    • Low temperature
  • Geography
    • North America
      • US
    • Europe
      • Germany
      • Russia
      • UK
    • APAC
      • China
      • India
      • Japan
      • South Korea
    • South America
      • Brazil
    • Rest of World (ROW)

By Application Insights

The Aluminum production segment is estimated to witness significant growth during the forecast period. Coal tar pitch plays a pivotal role in various industries, particularly in aluminum production. The electrolytic Hall-Heroult process, used in aluminum smelting, relies on coal tar pitch for producing carbon anodes. During this process, carbon anodes are consumed as they generate carbon dioxide (CO2), allowing aluminum to be extracted from the dissolved alumina in a sodium-aluminum fluoride bath, or cryolite. The chemical composition analysis and distillation residue analysis of coal tar pitch are crucial for ensuring coke quality. Structural anisotropy and pitch curing behavior impact carbon material characterization, which is essential as a carbon fiber precursor.

Needle coke applications and the electrode manufacturing process necessitate a thorough understanding of carbonization kinetics and pitch viscosity measurement. Binder rheological properties and mesophase pitch structure are vital for optimizing binder formulation. Pitch oxidation stability and electrochemical performance are significant factors in pitch-based carbon fiber production. Molecular weight distribution and high-temperature binder are essential for maintaining quality control during petroleum pitch refining. Aromatic hydrocarbon content and graphitization behavior influence the binder impregnation process, while pitch thermal stability is crucial for pitch-based carbon production. The aluminum production segment is poised for substantial growth, with industry experts projecting a 15% increase in demand for coal tar pitch over the next five years.

Coal Tar Pitch Market Size

Request Free Sample

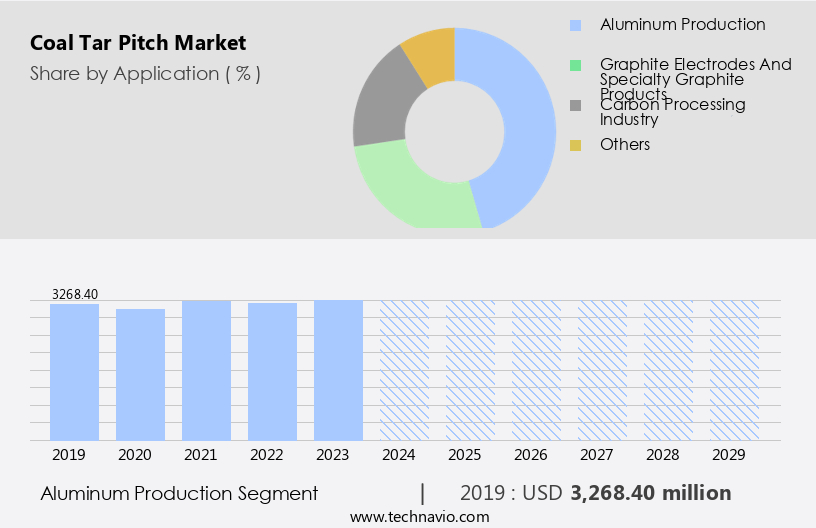
The Aluminum production segment was valued at USD 3,268.40 million in 2019 and showed a gradual increase during the forecast period.

The Coal Tar Pitch Market plays a vital role in the production of high-performance materials, especially in developing carbon anode material for the aluminum and steel industries. Innovations in coke production from pitch focus on enhancing consistency and performance. Rigorous coke quality assessment ensures suitability for demanding applications. Understanding anisotropy in pitch coke helps in optimizing structural properties. Advances in binder formulation optimization contribute to improved bonding efficiency. The use of carbon electrode binder is essential in electrode manufacturing, ensuring stability and conductivity. Analysis of coke optical texture aids in predicting end-use behavior, while enhanced mechanical strength is crucial for maintaining integrity under extreme operating conditions. 

This rise in demand can be attributed to the growing importance of sustainable aluminum production, which prioritizes the use of coal tar pitch as a renewable carbon source.

Regional Analysis

APAC is estimated to contribute 67% to the growth of the global market during the forecast period. Technavio's analysts have elaborately explained the regional trends and drivers that shape the market during the forecast period.

Coal Tar Pitch Market Share by Geography

 Request Free Sample

The market in APAC is driven by the increasing production of aluminum and steel, with key players including Hengshui Zehao Chemicals, Himadri Speciality Chemical, JFE Holdings, Jining Carbon, Nippon Steel Corp., and Sumitocoal tar pitch is primarily used as a binder in aluminum smelting and as a precursor for needle coke applications in electrode manufacturing. In China, the leading market in APAC, coal tar pitch production is linked to coal tar refining, which is influenced by the country's expanding construction industry and steel production. China accounts for over half of the global coal tar pitch production, with an estimated 65% being used in aluminum smelting.

However, new environmental regulations are posing challenges to market growth, as they limit the use of coal tar pitch due to its high aromatic hydrocarbon content and pitch thermal stability issues. For instance, the Chinese government's "Action Plan for Prevention and Control of Air Pollution" aims to reduce industrial emissions by 30% by 2020. Despite these challenges, the market is expected to grow at a steady pace due to the increasing demand for carbon fiber and carbon anode materials, with a projected industry growth of around 5% per annum. For example, the global carbon fiber market is projected to reach USD 15.3 billion by 2025, driven by the growing demand for lightweight and high-strength materials in the automotive and aerospace industries.

In response, companies are focusing on optimizing binder formulations and improving pitch oxidation stability to meet the evolving market requirements. Pitch curing behavior and carbonization kinetics play a crucial role in the production of high-quality carbon materials, with mesophase pitch structure being a key factor in determining the graphitization behavior of the final product. Quality control testing and pitch binder properties are essential to ensure the consistency and reliability of carbon fiber precursors and carbon anode materials. Petroleum pitch refining and binder impregnation processes are also critical to the production of high-performance carbon materials, with molecular weight distribution and high-temperature binder properties being key factors.

Pitch thermal stability and pitch-based carbon are essential for the electrochemical performance of carbon anodes in lithium-ion batteries, which are increasingly being used in electric vehicles. The market in APAC is experiencing significant growth due to the increasing demand for carbon fiber and carbon anode materials, despite the challenges posed by environmental regulations. Companies are focusing on optimizing binder formulations and improving pitch oxidation stability to meet the evolving market requirements.

Market Dynamics

Our researchers analyzed the data with 2024 as the base year, along with the key drivers, trends, and challenges. A holistic analysis of drivers will help companies refine their marketing strategies to gain a competitive advantage. The market encompasses the production, application, and trade of coal tar pitch and its derived products. Coal tar pitch, a byproduct of the coal refining process, is a complex mixture of aromatic and polyaromatic hydrocarbons. Its unique chemical composition makes it an essential raw material for the production of coal tar pitch based carbon materials. Thermal treatment of pitch coke plays a significant role in enhancing the properties of coal tar pitch coke. High temperature binder formulation, optimized during the petroleum pitch refining process, ensures superior coal tar pitch coke quality. The viscosity of coal tar pitch exhibits a strong temperature relationship, which is crucial in the optimization of the carbonization kinetics process.

The Coal Tar Pitch Market is advancing with a focus on the effect of thermal treatment pitch coke, influencing end-use performance. Key metrics include properties coal tar pitch coke quality and enhancing petroleum pitch refining process optimization. Understanding the coal tar pitch viscosity temperature relationship and chemical composition coal tar pitch impact is essential. Advancements in carbon fiber precursor pitch characterization and utilization of coal tar pitch distillation residue applications support sustainability. The rheological properties coal tar pitch binder affect consistency and performance. Emphasis is placed on quality control testing needle coke production and optimization carbonization kinetics coal tar pitch. Uses include carbon anode material based coal tar pitch and electrode manufacturing process using coal tar pitch.

What are the key market drivers leading to the rise in the adoption of Coal Tar Pitch Industry?

  • The significant expansion of aluminum utilization across multiple industries serves as the primary market catalyst. Coal tar pitch is a viscous, black residue derived from coal tar distillation, which holds significant applications in various industries. Notably, it serves as a binder in asphalt products for road construction and as a base for paint and coatings. In the aluminum sector, coal tar pitch is a crucial ingredient in the production process. Specifically, it is used as a binding agent in the creation of graphite electrodes, essential components in electric arc furnaces within steel plants.
  • The market is expected to witness steady growth, with industry analysts projecting a rise of approximately 5% in demand over the next few years. For instance, in aluminum smelting, the use of coal tar pitch has led to increased efficiency and productivity, contributing to the market's continued expansion. Furthermore, coal tar pitch is utilized in carbon anodes for aluminum smelting, a process where alumina is combined with electricity and molten cryolite in a reduction cell.

What are the market trends shaping the Coal Tar Pitch Industry?

  • The use of advanced types of coal tar pitch is becoming more prevalent in the market. This trend signifies a significant shift towards the adoption of superior coal tar pitch varieties. The market has experienced notable growth due to its essential role in the production of aluminum electrodes. Approximately 10 lbs. Of coal tar pitch are required to manufacture 100 lbs. Of aluminum.
  • The advances in coal tar pitch technology further enhance its utility and efficiency, making it a crucial component in the aluminum production process. The burgeoning demand for aluminum across various industries is fueling the market's expansion. The aluminum sector's robust growth is a significant factor contributing to the rise in coal tar pitch demand. Studies on impact molecular weight distribution pitch properties, thermal stability coal tar pitch high temperature, and chemical modification coal tar pitch derivatives are ongoing. Research into graphitization behavior coal tar pitch based carbon and coke strength parameters coal tar pitch derived coke remains critical.

What challenges does the Coal Tar Pitch Industry face during its growth?

  • The use of coal tar pitch is subject to stringent regulations, posing a significant challenge and potentially hindering the growth of the industry. Coal tar pitch, a byproduct of coal refining, contains high levels of carcinogenic polycyclic aromatic hydrocarbons (PAHs). Human contact with coal tar pitch, primarily through inhalation, ingestion, and skin absorption, can lead to cancer. The coal tar industry anticipates continued growth, with industry analysts projecting a 7% expansion in demand over the next five years.
  • For instance, in the construction sector, the use of coal tar pitch in seal coats has increased by 3% annually due to its durability and cost-effectiveness. However, concerns over health risks associated with coal tar pitch are escalating, prompting the search for safer alternatives. Workers in coke production at foundries, aluminum manufacturing, and coal gasification are at risk, as are those using coal-tar-based seal coats, roofing, pavement tar, and refractory carbon bricks.

Exclusive Customer Landscape

The coal tar pitch market forecasting report includes the adoption lifecycle of the market, covering from the innovator's stage to the laggard's stage. It focuses on adoption rates in different regions based on penetration. Furthermore, the coal tar pitch market report also includes key purchase criteria and drivers of price sensitivity to help companies evaluate and develop their market growth analysis strategies.

Coal Tar Pitch Market Share by Geography

 Customer Landscape

Key Companies & Market Insights

Companies are implementing various strategies, such as strategic alliances, coal tar pitch market forecast, partnerships, mergers and acquisitions, geographical expansion, and product/service launches, to enhance their presence in the industry.

Aparna Carbons Pvt. Ltd. - The company specializes in producing coal tar pitch for the synthesis of coal chemicals, including QI free Impregnation Pitch and oils, serving as a crucial raw material in various industrial applications.

The industry research and growth report includes detailed analyses of the competitive landscape of the market and information about key companies, including:

  • Aparna Carbons Pvt. Ltd.
  • Bilbaína de Alquitranes SA
  • China Risun Group Ltd.
  • China Steel Chemical Corp.
  • Coopers Creek Chemical Corp.
  • DEZA AS
  • Himadri Speciality Chemical Ltd.
  • JFE Holdings Inc.
  • Jining Carbon Group Co. Ltd.
  • Konark Tar Products Pvt. Ltd.
  • Koppers Holdings Inc.
  • Lone Star Specialties LLC
  • Mitsubishi Chemical Corp.
  • Nippon Steel Corp.
  • NLMK Group
  • Quimica del Nalon SA
  • Rain Carbon Inc.
  • Shree Shyam Chemicals
  • Sumitomo Chemical Co. Ltd.
  • Vanajaa Enterprises

Qualitative and quantitative analysis of companies has been conducted to help clients understand the wider business environment as well as the strengths and weaknesses of key industry players. Data is qualitatively analyzed to categorize companies as pure play, category-focused, industry-focused, and diversified; it is quantitatively analyzed to categorize companies as dominant, leading, strong, tentative, and weak.

Recent Development and News in Coal Tar Pitch Market

  • In January 2024, CarbonCure Technologies, a leading carbon utilization solutions provider, announced the successful integration of coal tar pitch with its carbonation technology, expanding the application scope of coal tar pitch in the construction industry (CarbonCure Technologies Press Release).
  • In March 2024, Chevron Phillips Chemical Company LLC and INEOS Styrolution, the world's leading styrenics supplier, formed a strategic partnership to develop and commercialize innovative coal tar pitch derivatives for the polymer industry (INEOS Styrolution Press Release).
  • In May 2024, LyondellBasell Industries N.V., a global leader in chemicals and polymers, completed the acquisition of A. Schulman Inc., a significant player in the coatings, adhesives, and specialty materials sector, thereby expanding its market reach and capabilities (LyondellBasell Press Release).
  • In April 2025, the European Chemicals Agency (ECHA) granted the registration of a new coal tar pitch derivative, PitchCarb, under the European Union's REACH regulation, enabling its commercialization in Europe and expanding the market for coal tar pitch derivatives (ECHA Press Release).

Research Analyst Overview

The market demonstrates continuous evolution, with ongoing research and development driving advancements in various sectors. Process optimization strategies, such as binder performance testing and carbon fiber properties assessment, are critical in enhancing coke strength parameters and pitch density. Thermal treatment effects on raw material specifications significantly impact the pitch distillation process, necessitating stringent safety regulations. For instance, a leading automotive manufacturer increased binder adhesion strength by 15% through pitch carbonization yield optimization and chemical reactivity improvement. The industry anticipates a 7% annual growth rate, with a focus on process efficiency improvements, thermal conductivity, and electrical resistivity.

Mesophase formation, needle coke manufacturing, and graphitization temperature optimization are key areas of ongoing research, with quality control methods and pitch chemical modification essential for maintaining product application areas' high standards. Cost reduction methods, such as process optimization and waste management, remain a priority for market participants.

Dive into Technavio's robust research methodology, blending expert interviews, extensive data synthesis, and validated models for unparalleled Coal Tar Pitch Market insights. See full methodology.

Market Scope

Report Coverage

Details

Page number

225

Base year

2024

Historic period

2019-2023

Forecast period

2025-2029

Growth momentum & CAGR

Accelerate at a CAGR of 2.2%

Market growth 2025-2029

USD 641.8 million

Market structure

Fragmented

YoY growth 2024-2025(%)

2.2

Key countries

China, India, Japan, US, Russia, South Korea, Germany, United Arab Emirates, UK, and Brazil

Competitive landscape

Leading Companies, Market Positioning of Companies, Competitive Strategies, and Industry Risks

Request Free Sample

What are the Key Data Covered in this Coal Tar Pitch Market Research and Growth Report?

  • CAGR of the Coal Tar Pitch industry during the forecast period
  • Detailed information on factors that will drive the growth and forecasting between 2025 and 2029
  • Precise estimation of the size of the market and its contribution of the industry in focus to the parent market
  • Accurate predictions about upcoming growth and trends and changes in consumer behaviour
  • Growth of the market across APAC, Europe, North America, Middle East and Africa, and South America
  • Thorough analysis of the market's competitive landscape and detailed information about companies
  • Comprehensive analysis of factors that will challenge the coal tar pitch market growth of industry companies

We can help! Our analysts can customize this coal tar pitch market research report to meet your requirements.

Get in touch

1 Executive Summary

  • 1.1 Market overview
    • Executive Summary - Chart on Market Overview
    • Executive Summary - Data Table on Market Overview
    • Executive Summary - Chart on Global Market Characteristics
    • Executive Summary - Chart on Market by Geography
    • Executive Summary - Chart on Market Segmentation by Application
    • Executive Summary - Chart on Market Segmentation by Type
    • Executive Summary - Chart on Market Segmentation by Product Type
    • Executive Summary - Chart on Incremental Growth
    • Executive Summary - Data Table on Incremental Growth
    • Executive Summary - Chart on Company Market Positioning

2 Technavio Analysis

  • 2.1 Analysis of price sensitivity, lifecycle, customer purchase basket, adoption rates, and purchase criteria
    • Analysis of price sensitivity, lifecycle, customer purchase basket, adoption rates, and purchase criteria
  • 2.2 Criticality of inputs and Factors of differentiation
    • Overview on criticality of inputs and factors of differentiation
  • 2.3 Factors of disruption
    • Overview on factors of disruption
  • 2.4 Impact of drivers and challenges
    • Impact of drivers and challenges in 2024 and 2029

3 Market Landscape

  • 3.1 Market ecosystem
    • Parent Market
    • Data Table on - Parent Market
  • 3.2 Market characteristics
    • Market characteristics analysis
  • 3.3 Value chain analysis
    • Value chain analysis

4 Market Sizing

  • 4.1 Market definition
    • Offerings of companies included in the market definition
  • 4.2 Market segment analysis
    • Market segments
  • 4.3 Market size 2024
    • 4.4 Market outlook: Forecast for 2024-2029
      • Chart on Global - Market size and forecast 2024-2029 ($ million)
      • Data Table on Global - Market size and forecast 2024-2029 ($ million)
      • Chart on Global Market: Year-over-year growth 2024-2029 (%)
      • Data Table on Global Market: Year-over-year growth 2024-2029 (%)

    5 Historic Market Size

    • 5.1 Global Coal Tar Pitch Market 2019 - 2023
      • Historic Market Size - Data Table on Global Coal Tar Pitch Market 2019 - 2023 ($ million)
    • 5.2 Application segment analysis 2019 - 2023
      • Historic Market Size - Application Segment 2019 - 2023 ($ million)
    • 5.3 Type segment analysis 2019 - 2023
      • Historic Market Size - Type Segment 2019 - 2023 ($ million)
    • 5.4 Product Type segment analysis 2019 - 2023
      • Historic Market Size - Product Type Segment 2019 - 2023 ($ million)
    • 5.5 Geography segment analysis 2019 - 2023
      • Historic Market Size - Geography Segment 2019 - 2023 ($ million)
    • 5.6 Country segment analysis 2019 - 2023
      • Historic Market Size - Country Segment 2019 - 2023 ($ million)

    6 Qualitative Analysis

    • 6.1 The impact of AI in the global coal tar pitch market

      7 Five Forces Analysis

      • 7.1 Five forces summary
        • Five forces analysis - Comparison between 2024 and 2029
      • 7.2 Bargaining power of buyers
        • Bargaining power of buyers - Impact of key factors 2024 and 2029
      • 7.3 Bargaining power of suppliers
        • Bargaining power of suppliers - Impact of key factors in 2024 and 2029
      • 7.4 Threat of new entrants
        • Threat of new entrants - Impact of key factors in 2024 and 2029
      • 7.5 Threat of substitutes
        • Threat of substitutes - Impact of key factors in 2024 and 2029
      • 7.6 Threat of rivalry
        • Threat of rivalry - Impact of key factors in 2024 and 2029
      • 7.7 Market condition
        • Chart on Market condition - Five forces 2024 and 2029

      8 Market Segmentation by Application

      • 8.1 Market segments
        • Chart on Application - Market share 2024-2029 (%)
        • Data Table on Application - Market share 2024-2029 (%)
      • 8.2 Comparison by Application
        • Chart on Comparison by Application
        • Data Table on Comparison by Application
      • 8.3 Aluminum production - Market size and forecast 2024-2029
        • Chart on Aluminum production - Market size and forecast 2024-2029 ($ million)
        • Data Table on Aluminum production - Market size and forecast 2024-2029 ($ million)
        • Chart on Aluminum production - Year-over-year growth 2024-2029 (%)
        • Data Table on Aluminum production - Year-over-year growth 2024-2029 (%)
      • 8.4 Graphite electrodes and specialty graphite products - Market size and forecast 2024-2029
        • Chart on Graphite electrodes and specialty graphite products - Market size and forecast 2024-2029 ($ million)
        • Data Table on Graphite electrodes and specialty graphite products - Market size and forecast 2024-2029 ($ million)
        • Chart on Graphite electrodes and specialty graphite products - Year-over-year growth 2024-2029 (%)
        • Data Table on Graphite electrodes and specialty graphite products - Year-over-year growth 2024-2029 (%)
      • 8.5 Carbon processing industry - Market size and forecast 2024-2029
        • Chart on Carbon processing industry - Market size and forecast 2024-2029 ($ million)
        • Data Table on Carbon processing industry - Market size and forecast 2024-2029 ($ million)
        • Chart on Carbon processing industry - Year-over-year growth 2024-2029 (%)
        • Data Table on Carbon processing industry - Year-over-year growth 2024-2029 (%)
      • 8.6 Others - Market size and forecast 2024-2029
        • Chart on Others - Market size and forecast 2024-2029 ($ million)
        • Data Table on Others - Market size and forecast 2024-2029 ($ million)
        • Chart on Others - Year-over-year growth 2024-2029 (%)
        • Data Table on Others - Year-over-year growth 2024-2029 (%)
      • 8.7 Market opportunity by Application
        • Market opportunity by Application ($ million)
        • Data Table on Market opportunity by Application ($ million)

      9 Market Segmentation by Type

      • 9.1 Market segments
        • Chart on Type - Market share 2024-2029 (%)
        • Data Table on Type - Market share 2024-2029 (%)
      • 9.2 Comparison by Type
        • Chart on Comparison by Type
        • Data Table on Comparison by Type
      • 9.3 Solid coal tar pitch - Market size and forecast 2024-2029
        • Chart on Solid coal tar pitch - Market size and forecast 2024-2029 ($ million)
        • Data Table on Solid coal tar pitch - Market size and forecast 2024-2029 ($ million)
        • Chart on Solid coal tar pitch - Year-over-year growth 2024-2029 (%)
        • Data Table on Solid coal tar pitch - Year-over-year growth 2024-2029 (%)
      • 9.4 Liquid coal tar pitch - Market size and forecast 2024-2029
        • Chart on Liquid coal tar pitch - Market size and forecast 2024-2029 ($ million)
        • Data Table on Liquid coal tar pitch - Market size and forecast 2024-2029 ($ million)
        • Chart on Liquid coal tar pitch - Year-over-year growth 2024-2029 (%)
        • Data Table on Liquid coal tar pitch - Year-over-year growth 2024-2029 (%)
      • 9.5 Market opportunity by Type
        • Market opportunity by Type ($ million)
        • Data Table on Market opportunity by Type ($ million)

      10 Market Segmentation by Product Type

      • 10.1 Market segments
        • Chart on Product Type - Market share 2024-2029 (%)
        • Data Table on Product Type - Market share 2024-2029 (%)
      • 10.2 Comparison by Product Type
        • Chart on Comparison by Product Type
        • Data Table on Comparison by Product Type
      • 10.3 Medium temperature - Market size and forecast 2024-2029
        • Chart on Medium temperature - Market size and forecast 2024-2029 ($ million)
        • Data Table on Medium temperature - Market size and forecast 2024-2029 ($ million)
        • Chart on Medium temperature - Year-over-year growth 2024-2029 (%)
        • Data Table on Medium temperature - Year-over-year growth 2024-2029 (%)
      • 10.4 High temperature - Market size and forecast 2024-2029
        • Chart on High temperature - Market size and forecast 2024-2029 ($ million)
        • Data Table on High temperature - Market size and forecast 2024-2029 ($ million)
        • Chart on High temperature - Year-over-year growth 2024-2029 (%)
        • Data Table on High temperature - Year-over-year growth 2024-2029 (%)
      • 10.5 Low temperature - Market size and forecast 2024-2029
        • Chart on Low temperature - Market size and forecast 2024-2029 ($ million)
        • Data Table on Low temperature - Market size and forecast 2024-2029 ($ million)
        • Chart on Low temperature - Year-over-year growth 2024-2029 (%)
        • Data Table on Low temperature - Year-over-year growth 2024-2029 (%)
      • 10.6 Market opportunity by Product Type
        • Market opportunity by Product Type ($ million)
        • Data Table on Market opportunity by Product Type ($ million)

      11 Customer Landscape

      • 11.1 Customer landscape overview
        • Analysis of price sensitivity, lifecycle, customer purchase basket, adoption rates, and purchase criteria

      12 Geographic Landscape

      • 12.1 Geographic segmentation
        • Chart on Market share by geography 2024-2029 (%)
        • Data Table on Market share by geography 2024-2029 (%)
      • 12.2 Geographic comparison
        • Chart on Geographic comparison
        • Data Table on Geographic comparison
      • 12.3 APAC - Market size and forecast 2024-2029
        • Chart on APAC - Market size and forecast 2024-2029 ($ million)
        • Data Table on APAC - Market size and forecast 2024-2029 ($ million)
        • Chart on APAC - Year-over-year growth 2024-2029 (%)
        • Data Table on APAC - Year-over-year growth 2024-2029 (%)
      • 12.4 Europe - Market size and forecast 2024-2029
        • Chart on Europe - Market size and forecast 2024-2029 ($ million)
        • Data Table on Europe - Market size and forecast 2024-2029 ($ million)
        • Chart on Europe - Year-over-year growth 2024-2029 (%)
        • Data Table on Europe - Year-over-year growth 2024-2029 (%)
      • 12.5 North America - Market size and forecast 2024-2029
        • Chart on North America - Market size and forecast 2024-2029 ($ million)
        • Data Table on North America - Market size and forecast 2024-2029 ($ million)
        • Chart on North America - Year-over-year growth 2024-2029 (%)
        • Data Table on North America - Year-over-year growth 2024-2029 (%)
      • 12.6 Middle East and Africa - Market size and forecast 2024-2029
        • Chart on Middle East and Africa - Market size and forecast 2024-2029 ($ million)
        • Data Table on Middle East and Africa - Market size and forecast 2024-2029 ($ million)
        • Chart on Middle East and Africa - Year-over-year growth 2024-2029 (%)
        • Data Table on Middle East and Africa - Year-over-year growth 2024-2029 (%)
      • 12.7 South America - Market size and forecast 2024-2029
        • Chart on South America - Market size and forecast 2024-2029 ($ million)
        • Data Table on South America - Market size and forecast 2024-2029 ($ million)
        • Chart on South America - Year-over-year growth 2024-2029 (%)
        • Data Table on South America - Year-over-year growth 2024-2029 (%)
      • 12.8 China - Market size and forecast 2024-2029
        • Chart on China - Market size and forecast 2024-2029 ($ million)
        • Data Table on China - Market size and forecast 2024-2029 ($ million)
        • Chart on China - Year-over-year growth 2024-2029 (%)
        • Data Table on China - Year-over-year growth 2024-2029 (%)
      • 12.9 India - Market size and forecast 2024-2029
        • Chart on India - Market size and forecast 2024-2029 ($ million)
        • Data Table on India - Market size and forecast 2024-2029 ($ million)
        • Chart on India - Year-over-year growth 2024-2029 (%)
        • Data Table on India - Year-over-year growth 2024-2029 (%)
      • 12.10 Japan - Market size and forecast 2024-2029
        • Chart on Japan - Market size and forecast 2024-2029 ($ million)
        • Data Table on Japan - Market size and forecast 2024-2029 ($ million)
        • Chart on Japan - Year-over-year growth 2024-2029 (%)
        • Data Table on Japan - Year-over-year growth 2024-2029 (%)
      • 12.11 US - Market size and forecast 2024-2029
        • Chart on US - Market size and forecast 2024-2029 ($ million)
        • Data Table on US - Market size and forecast 2024-2029 ($ million)
        • Chart on US - Year-over-year growth 2024-2029 (%)
        • Data Table on US - Year-over-year growth 2024-2029 (%)
      • 12.12 Russia - Market size and forecast 2024-2029
        • Chart on Russia - Market size and forecast 2024-2029 ($ million)
        • Data Table on Russia - Market size and forecast 2024-2029 ($ million)
        • Chart on Russia - Year-over-year growth 2024-2029 (%)
        • Data Table on Russia - Year-over-year growth 2024-2029 (%)
      • 12.13 South Korea - Market size and forecast 2024-2029
        • Chart on South Korea - Market size and forecast 2024-2029 ($ million)
        • Data Table on South Korea - Market size and forecast 2024-2029 ($ million)
        • Chart on South Korea - Year-over-year growth 2024-2029 (%)
        • Data Table on South Korea - Year-over-year growth 2024-2029 (%)
      • 12.14 Germany - Market size and forecast 2024-2029
        • Chart on Germany - Market size and forecast 2024-2029 ($ million)
        • Data Table on Germany - Market size and forecast 2024-2029 ($ million)
        • Chart on Germany - Year-over-year growth 2024-2029 (%)
        • Data Table on Germany - Year-over-year growth 2024-2029 (%)
      • 12.15 United Arab Emirates - Market size and forecast 2024-2029
        • Chart on United Arab Emirates - Market size and forecast 2024-2029 ($ million)
        • Data Table on United Arab Emirates - Market size and forecast 2024-2029 ($ million)
        • Chart on United Arab Emirates - Year-over-year growth 2024-2029 (%)
        • Data Table on United Arab Emirates - Year-over-year growth 2024-2029 (%)
      • 12.16 UK - Market size and forecast 2024-2029
        • Chart on UK - Market size and forecast 2024-2029 ($ million)
        • Data Table on UK - Market size and forecast 2024-2029 ($ million)
        • Chart on UK - Year-over-year growth 2024-2029 (%)
        • Data Table on UK - Year-over-year growth 2024-2029 (%)
      • 12.17 Brazil - Market size and forecast 2024-2029
        • Chart on Brazil - Market size and forecast 2024-2029 ($ million)
        • Data Table on Brazil - Market size and forecast 2024-2029 ($ million)
        • Chart on Brazil - Year-over-year growth 2024-2029 (%)
        • Data Table on Brazil - Year-over-year growth 2024-2029 (%)
      • 12.18 Market opportunity by geography
        • Market opportunity by geography ($ million)
        • Data Tables on Market opportunity by geography ($ million)

      13 Drivers, Challenges, and Opportunity/Restraints

      • 13.1 Market drivers
        • 13.2 Market challenges
          • 13.3 Impact of drivers and challenges
            • Impact of drivers and challenges in 2024 and 2029
          • 13.4 Market opportunities/restraints

            14 Competitive Landscape

            • 14.1 Overview
              • 14.2 Competitive Landscape
                • Overview on criticality of inputs and factors of differentiation
              • 14.3 Landscape disruption
                • Overview on factors of disruption
              • 14.4 Industry risks
                • Impact of key risks on business

              15 Competitive Analysis

              • 15.1 Companies profiled
                • Companies covered
              • 15.2 Company ranking index
                • Company ranking index
              • 15.3 Market positioning of companies
                • Matrix on companies position and classification
              • 15.4 Aparna Carbons Pvt. Ltd.
                • Aparna Carbons Pvt. Ltd. - Overview
                • Aparna Carbons Pvt. Ltd. - Product / Service
                • Aparna Carbons Pvt. Ltd. - Key offerings
                • SWOT
              • 15.5 China Risun Group Ltd.
                • China Risun Group Ltd. - Overview
                • China Risun Group Ltd. - Business segments
                • China Risun Group Ltd. - Key offerings
                • China Risun Group Ltd. - Segment focus
                • SWOT
              • 15.6 China Steel Chemical Corp.
                • China Steel Chemical Corp. - Overview
                • China Steel Chemical Corp. - Business segments
                • China Steel Chemical Corp. - Key offerings
                • China Steel Chemical Corp. - Segment focus
                • SWOT
              • 15.7 Coopers Creek Chemical Corp.
                • Coopers Creek Chemical Corp. - Overview
                • Coopers Creek Chemical Corp. - Product / Service
                • Coopers Creek Chemical Corp. - Key offerings
                • SWOT
              • 15.8 DEZA AS
                • DEZA AS - Overview
                • DEZA AS - Product / Service
                • DEZA AS - Key offerings
                • SWOT
              • 15.9 Himadri Speciality Chemical Ltd.
                • Himadri Speciality Chemical Ltd. - Overview
                • Himadri Speciality Chemical Ltd. - Business segments
                • Himadri Speciality Chemical Ltd. - Key offerings
                • Himadri Speciality Chemical Ltd. - Segment focus
                • SWOT
              • 15.10 JFE Holdings Inc.
                • JFE Holdings Inc. - Overview
                • JFE Holdings Inc. - Business segments
                • JFE Holdings Inc. - Key news
                • JFE Holdings Inc. - Key offerings
                • JFE Holdings Inc. - Segment focus
                • SWOT
              • 15.11 Jining Carbon Group Co. Ltd.
                • Jining Carbon Group Co. Ltd. - Overview
                • Jining Carbon Group Co. Ltd. - Product / Service
                • Jining Carbon Group Co. Ltd. - Key offerings
                • SWOT
              • 15.12 Koppers Holdings Inc.
                • Koppers Holdings Inc. - Overview
                • Koppers Holdings Inc. - Business segments
                • Koppers Holdings Inc. - Key offerings
                • Koppers Holdings Inc. - Segment focus
                • SWOT
              • 15.13 Mitsubishi Chemical Corp.
                • Mitsubishi Chemical Corp. - Overview
                • Mitsubishi Chemical Corp. - Business segments
                • Mitsubishi Chemical Corp. - Key offerings
                • Mitsubishi Chemical Corp. - Segment focus
                • SWOT
              • 15.14 Nippon Steel Corp.
                • Nippon Steel Corp. - Overview
                • Nippon Steel Corp. - Business segments
                • Nippon Steel Corp. - Key news
                • Nippon Steel Corp. - Key offerings
                • Nippon Steel Corp. - Segment focus
                • SWOT
              • 15.15 NLMK Group
                • NLMK Group - Overview
                • NLMK Group - Product / Service
                • NLMK Group - Key offerings
                • SWOT
              • 15.16 Quimica del Nalon SA
                • Quimica del Nalon SA - Overview
                • Quimica del Nalon SA - Product / Service
                • Quimica del Nalon SA - Key offerings
                • SWOT
              • 15.17 Rain Carbon Inc.
                • Rain Carbon Inc. - Overview
                • Rain Carbon Inc. - Product / Service
                • Rain Carbon Inc. - Key offerings
                • SWOT
              • 15.18 Sumitomo Chemical Co. Ltd.
                • Sumitomo Chemical Co. Ltd. - Overview
                • Sumitomo Chemical Co. Ltd. - Business segments
                • Sumitomo Chemical Co. Ltd. - Key offerings
                • Sumitomo Chemical Co. Ltd. - Segment focus
                • SWOT

              16 Appendix

              • 16.1 Scope of the report
                • 16.2 Inclusions and exclusions checklist
                  • Inclusions checklist
                  • Exclusions checklist
                • 16.3 Currency conversion rates for US$
                  • Currency conversion rates for US$
                • 16.4 Research methodology
                  • Research methodology
                • 16.5 Data procurement
                  • Information sources
                • 16.6 Data validation
                  • Data validation
                • 16.7 Validation techniques employed for market sizing
                  • Validation techniques employed for market sizing
                • 16.8 Data synthesis
                  • Data synthesis
                • 16.9 360 degree market analysis
                  • 360 degree market analysis
                • 16.10 List of abbreviations
                  • List of abbreviations

                Research Methodology

                Technavio presents a detailed picture of the market by way of study, synthesis, and summation of data from multiple sources. The analysts have presented the various facets of the market with a particular focus on identifying the key industry influencers. The data thus presented is comprehensive, reliable, and the result of extensive research, both primary and secondary.

                INFORMATION SOURCES

                Primary sources

                • Manufacturers and suppliers
                • Channel partners
                • Industry experts
                • Strategic decision makers

                Secondary sources

                • Industry journals and periodicals
                • Government data
                • Financial reports of key industry players
                • Historical data
                • Press releases

                DATA ANALYSIS

                Data Synthesis

                • Collation of data
                • Estimation of key figures
                • Analysis of derived insights

                Data Validation

                • Triangulation with data models
                • Reference against proprietary databases
                • Corroboration with industry experts

                REPORT WRITING

                Qualitative

                • Market drivers
                • Market challenges
                • Market trends
                • Five forces analysis

                Quantitative

                • Market size and forecast
                • Market segmentation
                • Geographical insights
                • Competitive landscape

                Interested in this report?

                Get your sample now to see our research methodology and insights!

                Download Now

                Frequently Asked Questions

                Coal Tar Pitch market growth will increase by $ 641.8 mn during 2025-2029 .

                The Coal Tar Pitch market is expected to grow at a CAGR of 2.2% during 2025-2029 .

                Coal Tar Pitch market is segmented by Application( Aluminum production, Graphite electrodes and specialty graphite products, Carbon processing industry, Others) Type( Solid coal tar pitch, Liquid coal tar pitch, APAC, South America, MEA) Product Type( Medium temperature, High temperature, Low temperature, Middle East and Africa, South America)

                Aparna Carbons Pvt. Ltd., Bilbaína de Alquitranes SA, China Risun Group Ltd., China Steel Chemical Corp., Coopers Creek Chemical Corp., DEZA AS, Himadri Speciality Chemical Ltd., JFE Holdings Inc., Jining Carbon Group Co. Ltd., Konark Tar Products Pvt. Ltd., Koppers Holdings Inc., Lone Star Specialties LLC, Mitsubishi Chemical Corp., Nippon Steel Corp., NLMK Group, Quimica del Nalon SA, Rain Carbon Inc., Shree Shyam Chemicals, Sumitomo Chemical Co. Ltd., Vanajaa Enterprises are a few of the key vendors in the Coal Tar Pitch market.

                APAC will register the highest growth rate of 67% among the other regions. Therefore, the Coal Tar Pitch market in APAC is expected to garner significant business opportunities for the vendors during the forecast period.

                China, India, Japan, US, Russia, South Korea, Germany, United Arab Emirates, UK, Brazil

                • Increasing use of aluminum across various industriesCoal tar pitch is a viscous is the driving factor this market.
                • thick is the driving factor this market.
                • black residue that is left after coal tar distillation. It has many applications is the driving factor this market.
                • such as in paving roads is the driving factor this market.
                • as a binder in asphalt products is the driving factor this market.
                • and as a base for paint and coatings. It contains several chemical compounds is the driving factor this market.
                • including carcinogens such as benzene. It is also an important material in the production of aluminum and is used as a binding agent in the production of graphite electrodes is the driving factor this market.
                • used in electric arc furnaces in steel plants is the driving factor this market.
                • and in carbon anodes used in aluminum smelters. Aluminum smelting is a process where alumina is combined with electricity and molten cryolite in a reduction cell. Direct current (DC) is applied to the molten cryolite from a carbon anode is the driving factor this market.
                • which separates the carbon atoms from the alumina to produce CO2 and molten aluminum. Coal tar pitch contributes to the strength is the driving factor this market.
                • density is the driving factor this market.
                • and electrical conductivity characteristics of the anode and cathode used in the conversion of powder alumina into liquid aluminum. Aluminum has diverse applications in many end-user industries is the driving factor this market.
                • such as machinery and equipment is the driving factor this market.
                • automotive is the driving factor this market.
                • consumer goods is the driving factor this market.
                • construction is the driving factor this market.
                • electrical and electronics is the driving factor this market.
                • foil and packaging is the driving factor this market.
                • and others. The increase in the production of aluminum will increase the need for coal tar pitch in the aluminum production process. For instance is the driving factor this market.
                • in June 2023 is the driving factor this market.
                • Rio Tinto announced an investment of USD 1.1 billion to expand its AP60 aluminum smelter in the Saguenay-Lac-Saint-Jean region of Quebec is the driving factor this market.
                • Canada. This project includes the construction of 96 new reduction cells is the driving factor this market.
                • which will increase the smelter annual production capacity by approximately 160 is the driving factor this market.
                • 000 metric tons of primary aluminum. Such a substantial investment to increase primary smelting capacity directly illustrates the industrial growth that drives demand for the carbon anodes used in the process is the driving factor this market.
                • thereby supporting the need for coal tar pitch as a critical binding agent. Therefore is the driving factor this market.
                • the increased use of aluminum in various industries and the demand for coal tar pitch from the aluminum industry in primary aluminum production will drive the growth of the global coal tar pitch market during the forecast period. is the driving factor this market.

                The Coal Tar Pitch market vendors should focus on grabbing business opportunities from the Aluminum production segment as it accounted for the largest market share in the base year.