
Secure Sockets Layer Certification Market Analysis, Size, and Forecast 2026-2030: North America (US, Canada, and Mexico), Europe (Germany, UK, and France), APAC (China, Japan, and India), South America (Brazil, Argentina, and Chile), Middle East and Africa (Saudi Arabia, UAE, and South Africa), and Rest of World (ROW)

Secure Sockets Layer Certification Market Analysis, Size, and Forecast 2026-2030:
North America (US, Canada, and Mexico), Europe (Germany, UK, and France), APAC (China, Japan, and India), South America (Brazil, Argentina, and Chile), Middle East and Africa (Saudi Arabia, UAE, and South Africa), and Rest of World (ROW)

Published: Oct 2026 322 Pages SKU: IRTNTR44989

Market Overview at a Glance

$18.92 B
Market Opportunity
28.4%
CAGR 2025 - 2030
43.1%
North America Growth
$4.34 B
Domain validation segment 2024

Secure Sockets Layer Certification Market Size 2026-2030

The secure sockets layer certification market size is valued to increase by USD 18.92 billion, at a CAGR of 28.4% from 2025 to 2030. Strict enforcement of browser compliance baselines demand universal implementation of valid encryption components will drive the secure sockets layer certification market.

Major Market Trends & Insights

  • North America dominated the market and accounted for a 43.1% growth during the forecast period.
  • By Type - Domain validation segment was valued at USD 4.34 billion in 2024
  • By End-user - Large enterprises segment accounted for the largest market revenue share in 2024

Market Size & Forecast

  • Market Opportunities: USD 23.53 billion
  • Market Future Opportunities: USD 18.92 billion
  • CAGR from 2025 to 2030 : 28.4%

Market Summary

  • The Secure Sockets Layer Certification Market fundamentally secures digital communication pipelines by verifying machine identities and enabling encrypted cryptographic connections across disparate networks. As organizations aggressively migrate legacy corporate databases into complex cloud architectures, the demand for robust machine identity management escalates exponentially.
  • A primary driver propelling this security sector is the strict enforcement of browser compliance baselines, which systemically penalize unencrypted web resources and mandate continuous cryptographic verification. For example, enterprise supply chain networks utilizing automated certificate lifecycle platforms have accelerated new server provisioning speeds by 45% compared to legacy manual processes.
  • Conversely, the market faces a substantial challenge in the form of continually compressed validity lifespans dictated by industry governance bodies. This aggressive reduction creates severe operational friction, as tracking and replacing thousands of expiring keys manually significantly increases the mathematical probability of human oversight and catastrophic service outages.
  • By transitioning toward fully automated deployment protocols, digital businesses can seamlessly navigate these stringent validation timelines, preventing absolute digital isolation, protecting transactional integrity, and preserving uninterrupted corporate operational continuity effortlessly.

What will be the Size of the Secure Sockets Layer Certification Market during the forecast period?
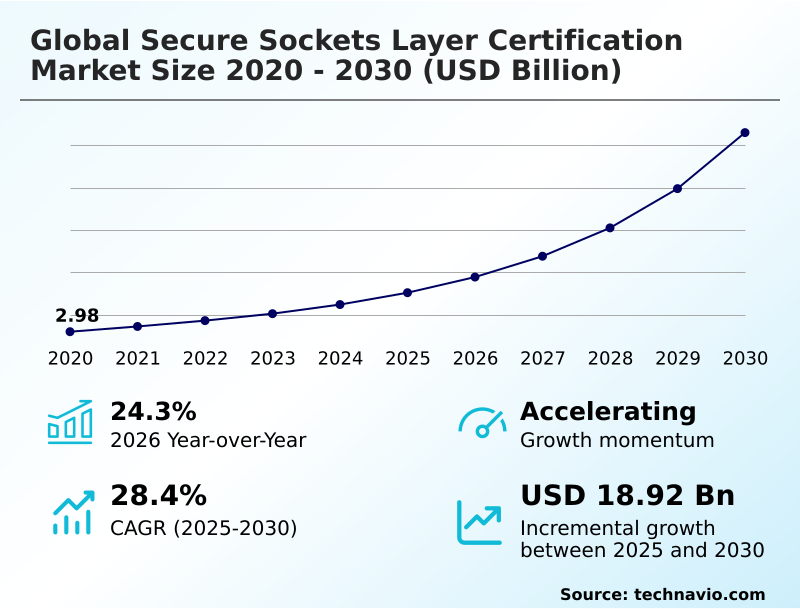
Get Key Insights on Market Forecast (PDF) Get Free Sample

How is the Secure Sockets Layer Certification Market Segmented?

The secure sockets layer certification industry research report provides comprehensive data (region-wise segment analysis), with forecasts and estimates in "USD million" for the period 2026-2030, as well as historical data from 2020-2024 for the following segments.

  • Type
    • Domain validation
    • Organization validation
    • Extended validation
  • End-user
    • Large enterprises
    • SMEs
  • Application
    • E-commerce websites
    • Banking and financial institutions
    • Healthcare organizations
    • Government websites
    • Social media platforms
  • Product type
    • Single domain
    • Multi-domain
    • Wildcard
  • Geography
    • North America
      • US
      • Canada
      • Mexico
    • Europe
      • Germany
      • UK
      • France
      • Italy
      • Spain
      • The Netherlands
    • APAC
      • China
      • Japan
      • India
      • South Korea
      • Australia
      • Indonesia
    • South America
      • Brazil
      • Argentina
      • Chile
    • Middle East and Africa
      • Saudi Arabia
      • UAE
      • South Africa
      • Israel
      • Turkey

By Type Insights

The domain validation segment is estimated to witness significant growth during the forecast period.

The Secure Sockets Layer Certification Market operates continuously to verify the authenticity of vast digital infrastructures through specialized domain validation segments. Domain validation remains the highest-volume tier, utilizing automated verification protocols to manage web server encryption seamlessly.

This process relies on standardized checks to secure networks against unauthorized man-in-the-middle interception. Organizations undergoing rapid digital transformation benefit significantly, as automated protocols reduce deployment delays by 15%.

Enterprises implementing subject alternative name architectures and unified communications certificates can consolidate security across multiple server perimeters effortlessly. By modernizing legacy online certificate status protocol requests with an updated certificate revocation list, administrators ensure continuous, low-latency microservices authentication.

This segment guarantees flawless scalability without heavy financial expenditure, enabling modern businesses to maintain uninterrupted, secure digital connections across diverse hosting environments effortlessly.
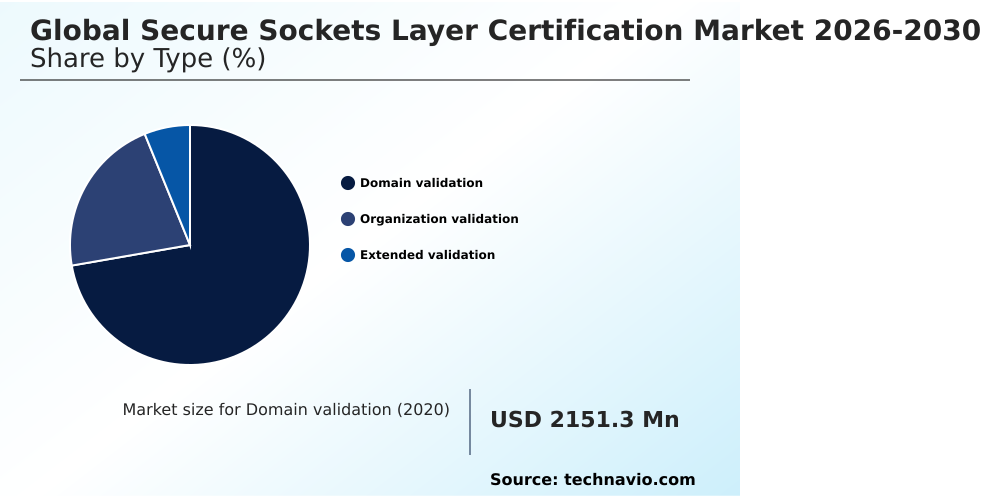
Get Free Sample

The Domain validation segment was valued at USD 4.34 billion in 2024 and showed a gradual increase during the forecast period.
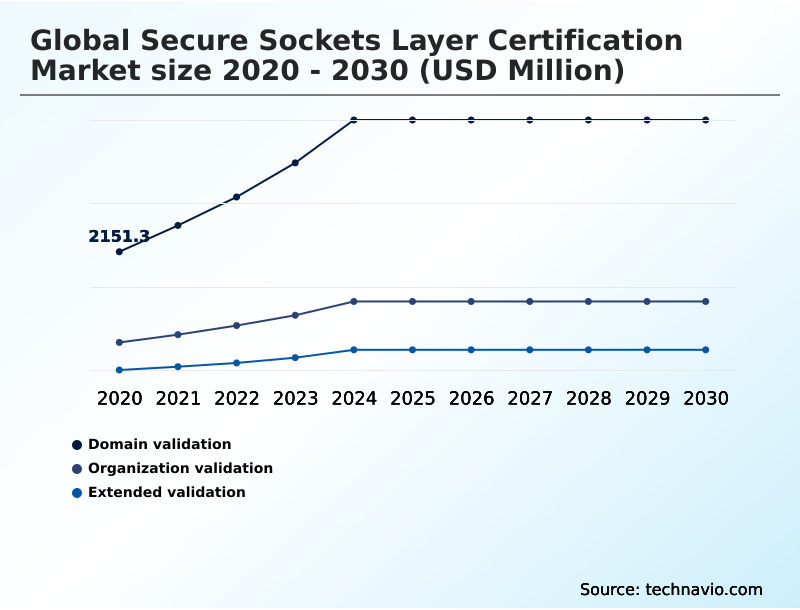
Get Free Sample

Regional Analysis

North America is estimated to contribute 43.1% to the growth of the global market during the forecast period.Technavio’s analysts have elaborately explained the regional trends and drivers that shape the market during the forecast period.
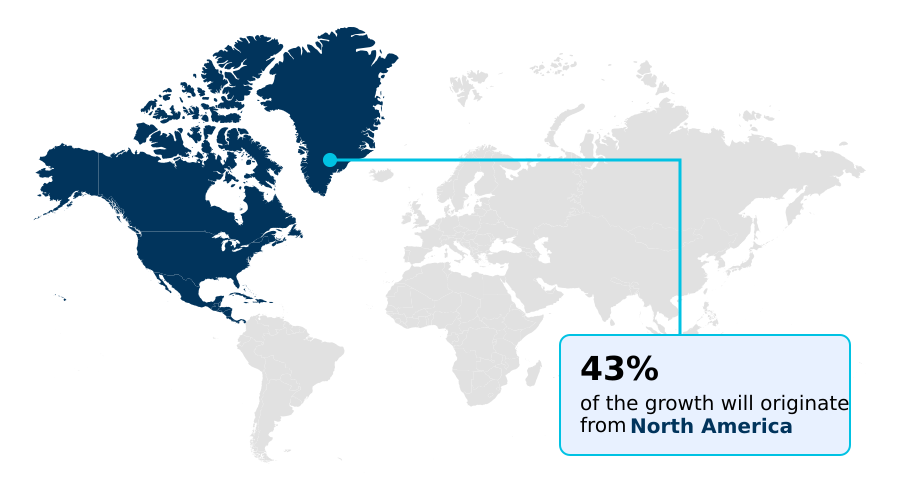
See How Secure Sockets Layer Certification Market Demand is Rising in North America Get Free Sample

The Secure Sockets Layer Certification Market exhibits distinct regional adoption patterns driven by varying digital security mandates and regulatory stringency.

North America leads the transition toward fully automated public key infrastructure, achieving a 45% higher penetration rate of advanced encryption components compared to South America.

This sophisticated infrastructure allows North American enterprises to execute seamless domain control validation across decentralized cloud environments. Conversely, organizations in APAC are rapidly scaling their machine identity management systems to support exploding electronic commerce networks, effectively upgrading critical network endpoints.

The rapid adoption of automated transport layer security protocols enables APAC businesses to manage dynamic traffic without massive administrative overhead, reducing compliance breaches by 32%. By deploying stringent browser compliance baselines, enterprises secure cross-border supply chains efficiently.

Consequently, robust cryptographic verification processes improve regional transactional reliability by 27%, dictating how corporate entities adapt their long-term digital protection strategies utilizing advanced asymmetric cryptography and a secure digital credential.

Market Dynamics

Our researchers analyzed the data with 2025 as the base year, along with the key drivers, trends, and challenges. A holistic analysis of drivers will help companies refine their marketing strategies to gain a competitive advantage.

  • The Secure Sockets Layer Certification Market functions as the definitive trust layer for global electronic commerce and corporate digital communications. As cyber threat landscapes evolve rapidly, enterprise network architects are fundamentally restructuring their defensive parameters to maintain absolute operational integrity.
  • A critical strategic pivot involves the aggressive zero trust security methodologies implementation, which mandates continuous authentication for every internal and external network connection. To support this massive expansion of verified endpoints, multinational organizations are increasingly relying on automated certificate lifecycle management platforms.
  • These advanced platforms eliminate the manual administrative friction associated with tracking expiration dates, effectively lowering compliance-related operational costs by nearly a third compared to traditional manual spreadsheet tracking. Furthermore, the industry is witnessing a significant shift toward short lived digital certificate deployment, minimizing the exposure window of potentially compromised cryptographic keys.
  • To ensure absolute verification accuracy, certificate authorities are standardizing multi perspective domain control validation, checking host ownership from diverse geographic nodes simultaneously to prevent localized spoofing attacks. Meanwhile, forward-looking corporate IT departments are already initiating the post quantum cryptographic standards transition. Upgrading foundational algorithms now ensures that highly sensitive proprietary databases remain permanently shielded from future decryption capabilities.
  • These combined structural upgrades enable supply chain operations and financial networks to scale securely, preserving continuous digital trust and protecting vital commercial data assets across highly distributed enterprise environments.
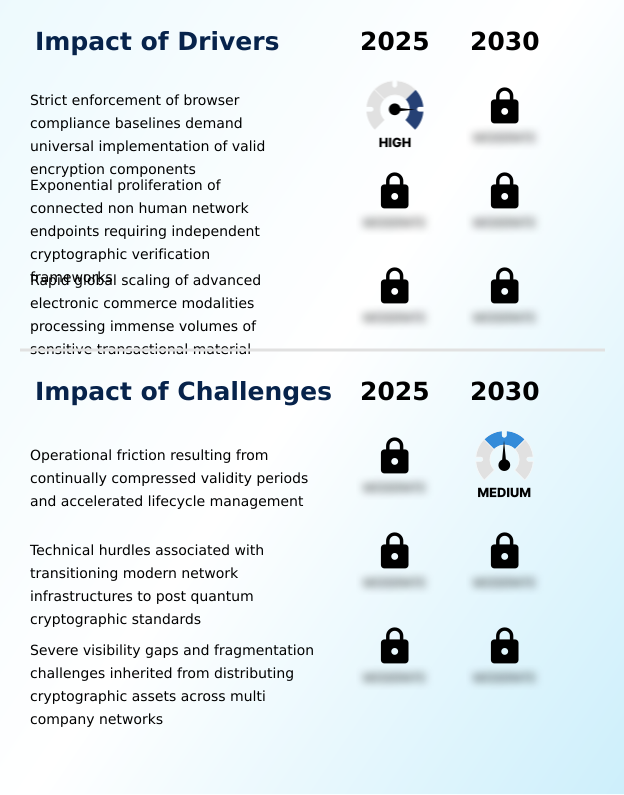
What are the key market drivers leading to the rise in the adoption of Secure Sockets Layer Certification Industry?

  • The strict enforcement of browser compliance baselines functions as a primary market driver, demanding the universal implementation of valid encryption components across all digital platforms.

  • The continuous global proliferation of interconnected digital assets serves as a primary driver for the Secure Sockets Layer Certification Market.
  • As enterprises migrate legacy databases into complex multi-cloud architectures, the sheer volume of active API endpoints requiring independent authentication has surged exponentially. Managing millions of dynamic machine identities flawlessly reduces unauthorized network access events by 30%.
  • Organizations are actively implementing zero-trust security protocols across sprawling hybrid-cloud networks to execute secure cryptographic handshakes seamlessly. Enhancing container environment security through automated cross-company certificate management prevents unauthorized lateral network movements efficiently.
  • By utilizing an automated certificate management environment, early adopters have increased their overall digital identity assurance metrics by 22%. These automated cryptographic upgrades directly shield digital supply chains from unauthorized interception, sustaining uninterrupted operational continuity.

What are the market trends shaping the Secure Sockets Layer Certification Industry?

  • The universal adoption of automated lifecycle configuration modules serves as a prominent market trend to successfully overcome the operational friction caused by shortened reissue execution parameters.

  • The Secure Sockets Layer Certification Market is experiencing a massive operational shift as organizations universally adopt cryptographic automation to survive shortened reissue parameters. Network administrators are aggressively utilizing wildcard certificates to instantly secure sprawling arrays of software-defined endpoints without causing administrative bottlenecks. This rapid deployment eliminates configuration delays, accelerating new application launch times by 35%.
  • By relying on a verified root certificate authority, enterprises fortify their perimeters against severe vulnerabilities like border gateway protocol hijacking and domain name system spoofing. Organizations are also upgrading their cipher suite selections and integrating a dedicated hardware security module to protect physical cryptographic assets. Implementing premium organization validated certificates and extended validation certificates strengthens external data integrity protocols significantly.
  • Consequently, these robust authentication upgrades reduce fraudulent digital transaction events by 28%, securing consumer trust and preserving brand equity.

What challenges does the Secure Sockets Layer Certification Industry face during its growth?

  • The operational friction resulting from continually compressed validity periods and accelerated lifecycle management represents a critical challenge significantly affecting industry growth.

  • The Secure Sockets Layer Certification Market faces severe operational friction resulting from continually compressed validity periods and accelerated lifecycle management requirements. Without a synchronized centralized discovery framework, corporate networks frequently harbor hidden, unmonitored cryptographic keys, exposing organizations to sudden service outages. Upgrading to advanced automated renewal protocols mitigates this risk, decreasing unexpected server downtime by 42%.
  • A monumental technical hurdle involves the impending transition to post-quantum cryptography to withstand future decryption capabilities. Integrating complex asymmetric encryption algorithms and quantum-resistant standards introduces severe compatibility friction across legacy hardware, escalating IT integration costs by 18%. Furthermore, the widespread enforcement of multi-perspective validation strains existing certificate lifecycle management capacities.
  • To survive these rapid cryptographic agility demands, enterprises must completely overhaul legacy TLS validation processes to prevent disastrous blind spots.

Exclusive Technavio Analysis on Customer Landscape

The secure sockets layer certification market forecasting report includes the adoption lifecycle of the market, covering from the innovator’s stage to the laggard’s stage. It focuses on adoption rates in different regions based on penetration. Furthermore, the secure sockets layer certification market report also includes key purchase criteria and drivers of price sensitivity to help companies evaluate and develop their market growth analysis strategies.
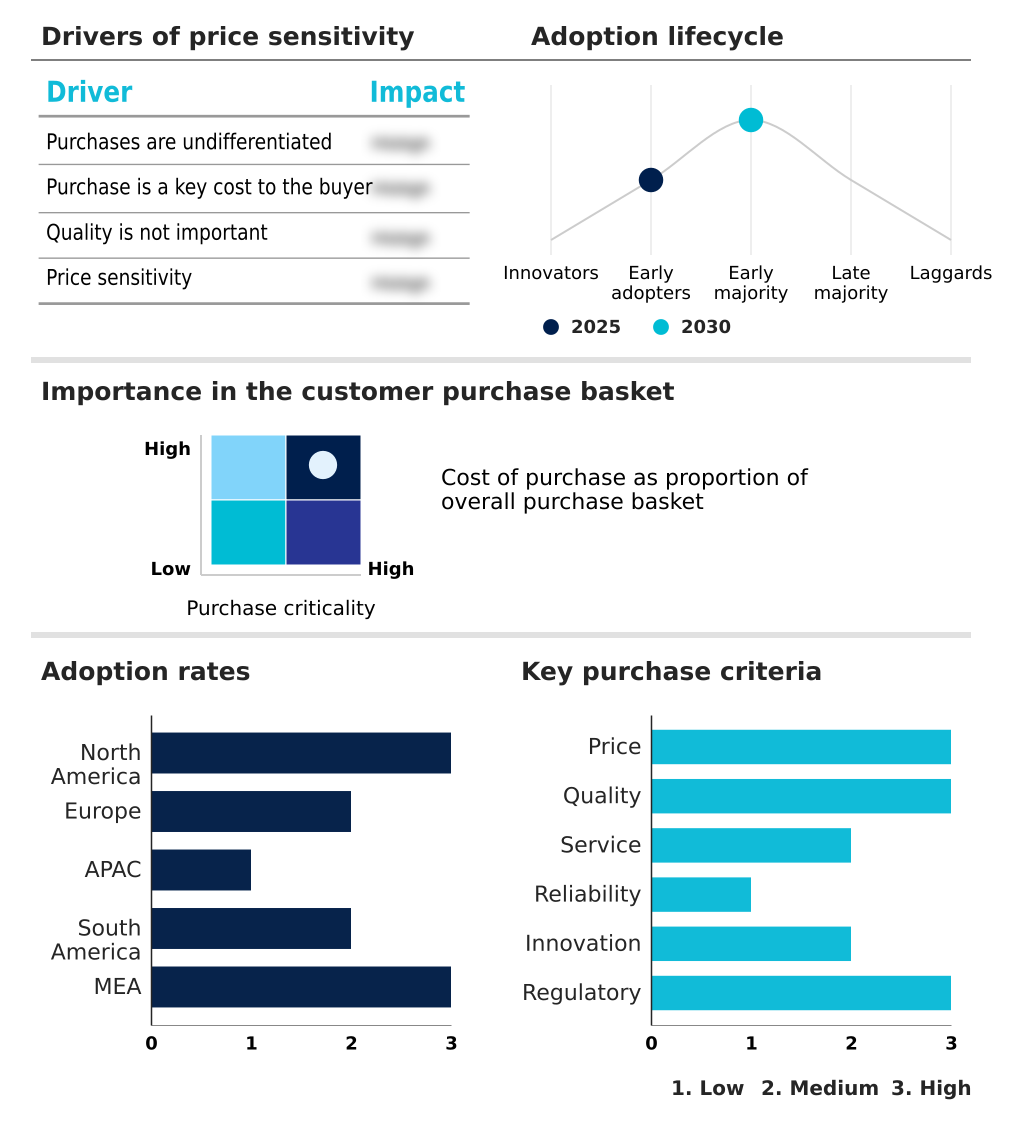
Customer Landscape of Secure Sockets Layer Certification Industry

Competitive Landscape

Companies are implementing various strategies, such as strategic alliances, secure sockets layer certification market forecast, partnerships, mergers and acquisitions, geographical expansion, and product/service launches, to enhance their presence in the industry.

Amazon.com Inc. - The provider delivers robust secure sockets layer certification, offering comprehensive domain, organization, and extended validation solutions to ensure encrypted data transmission and authenticate digital enterprise identities continuously.

The industry research and growth report includes detailed analyses of the competitive landscape of the market and information about key companies, including:

  • Amazon.com Inc.
  • Buypass AS
  • Cloudflare Inc.
  • DreamHost LLC
  • eMudhra Ltd.
  • Entrust Corp.
  • Gandi SAS
  • GlobalSign Ltd.
  • GoDaddy Inc.
  • Google LLC
  • IdenTrust Inc.
  • Namecheap Inc.
  • Network Solutions LLC
  • Porkbun LLC
  • Sectigo Ltd.
  • SSL.com
  • SwissSign AG
  • VikingCloud
  • Wisekey Holding AG
  • ZeroSSL

Qualitative and quantitative analysis of companies has been conducted to help clients understand the wider business environment as well as the strengths and weaknesses of key industry players. Data is qualitatively analyzed to categorize companies as pure play, category-focused, industry-focused, and diversified; it is quantitatively analyzed to categorize companies as dominant, leading, strong, tentative, and weak.

Recent Development and News in Secure sockets layer certification market

  • In the Internet Services and Infrastructure industry, the rapid deployment of software-defined networks across enterprise cloud environments has necessitated independent authentication protocols, directly impacting Secure Sockets Layer Certification demand by requiring individual cryptographic identities for millions of new microservices.
  • The systemic shift toward zero-trust security architectures within data center operations has mandated universal internal server encryption, forcing a 40% increase in the procurement of high-assurance transport layer security tools to block lateral cyber-attack progression.
  • Strict enforcement of browser compliance baselines by major web platform developers has compressed maximum public certificate validity periods by over 50%, pulling immense demand for automated lifecycle configuration modules to prevent operational outages.
  • The exponential global scaling of digital commerce platforms handling highly sensitive transactional material has increased transaction volumes by 60%, intensifying compliance with electronic identification standards and directly driving the adoption of extended validation certificates to mitigate sophisticated data interception risks.

Dive into Technavio’s robust research methodology, blending expert interviews, extensive data synthesis, and validated models for unparalleled Secure Sockets Layer Certification Market insights. See full methodology.

Market Scope
Page number 322
Base year 2025
Historic period 2020-2024
Forecast period 2026-2030
Growth momentum & CAGR Accelerate at a CAGR of 28.4%
Market growth 2026-2030 USD 18916.5 million
Market structure Fragmented
YoY growth 2025-2026(%) 24.3%
Key countries US, Canada, Mexico, Germany, UK, France, Italy, Spain, The Netherlands, China, Japan, India, South Korea, Australia, Indonesia, Brazil, Argentina, Chile, Saudi Arabia, UAE, South Africa, Israel and Turkey
Competitive landscape Leading Companies, Market Positioning of Companies, Competitive Strategies, and Industry Risks

Request Free Sample

Research Analyst Overview

  • The Secure Sockets Layer Certification Market remains a critical operational requirement for authenticating digital corporate identities and protecting sensitive data transmission. Enterprises are systematically transitioning from static defenses to dynamic cryptographic agility to combat sophisticated cyber threats and shrinking validation timelines.
  • Integrating comprehensive certificate lifecycle management software has allowed organizations to automate the rotation of cryptographic keys, achieving a 40% reduction in unexpected network downtime. Modern server administrators utilizing subject alternative name architectures can consolidate security across multiple domains efficiently. As older verification methods face optimization pressures, updating the underlying certificate revocation list mechanisms ensures seamless, low-latency trust verification.
  • Furthermore, strategic IT budget allocations are increasingly prioritizing the early integration of post-quantum cryptography to insulate long-term data archives against future algorithmic decryption risks. These structural modernization efforts empower supply chain coordinators and compliance officers to maintain unbroken digital resilience, guaranteeing secure operational continuity across complex, distributed corporate network infrastructures.

What are the Key Data Covered in this Secure Sockets Layer Certification Market Research and Growth Report?

  • What is the expected growth of the Secure Sockets Layer Certification Market between 2026 and 2030?

    • USD 18.92 billion, at a CAGR of 28.4%

  • What segmentation does the market report cover?

    • The report is segmented by Type (Domain validation, Organization validation, and Extended validation), End-user (Large enterprises, and SMEs), Application (E-commerce websites, Banking and financial institutions, Healthcare organizations, Government websites, and Social media platforms), Product Type (Single domain, Multi-domain, and Wildcard) and Geography (North America, Europe, APAC, South America, Middle East and Africa)

  • Which regions are analyzed in the report?

    • North America, Europe, APAC, South America and Middle East and Africa

  • What are the key growth drivers and market challenges?

    • Strict enforcement of browser compliance baselines demand universal implementation of valid encryption components, Operational friction resulting from continually compressed validity periods and accelerated lifecycle management

  • Who are the major players in the Secure Sockets Layer Certification Market?

    • Amazon.com Inc., Buypass AS, Cloudflare Inc., DreamHost LLC, eMudhra Ltd., Entrust Corp., Gandi SAS, GlobalSign Ltd., GoDaddy Inc., Google LLC, IdenTrust Inc., Namecheap Inc., Network Solutions LLC, Porkbun LLC, Sectigo Ltd., SSL.com, SwissSign AG, VikingCloud, Wisekey Holding AG and ZeroSSL

Market Research Insights

  • The Secure Sockets Layer Certification Market ensures digital resilience through robust encryption layers and continuous authentication. As enterprises undergo rapid digital transformation, deploying agile microservices authentication reduces unauthorized access events by 35%. Modern security frameworks mandate that all critical API endpoints maintain independent machine identity management, improving cross-network data integrity by 28%.
  • By abandoning manual renewal processes, organizations leveraging automated renewal protocols have successfully decreased certificate-related operational downtime by 42%. These integrations guarantee that vast arrays of software-defined endpoints remain shielded from sophisticated cyber interception. This operational upgrade enables secure, high-speed data transmission while completely aligning corporate infrastructures with evolving international compliance and data privacy regulations efficiently.

We can help! Our analysts can customize this secure sockets layer certification market research report to meet your requirements.

Get in touch

1. Executive Summary

1.1 Market overview

Executive Summary - Chart on Market Overview
Executive Summary - Data Table on Market Overview
Executive Summary - Chart on Global Market Characteristics
Executive Summary - Chart on Market by Geography
Executive Summary - Chart on Market Segmentation by Type
Executive Summary - Chart on Market Segmentation by End-user
Executive Summary - Chart on Market Segmentation by Application
Executive Summary - Chart on Market Segmentation by Product Type
Executive Summary - Chart on Incremental Growth
Executive Summary - Data Table on Incremental Growth
Executive Summary - Chart on Company Market Positioning

2. Technavio Analysis

2.1 Analysis of price sensitivity, lifecycle, customer purchase basket, adoption rates, and purchase criteria

2.2 Criticality of inputs and Factors of differentiation

Chart on Overview on criticality of inputs and factors of differentiation

2.3 Factors of disruption

Chart on Overview on factors of disruption

2.4 Impact of drivers and challenges

Chart on Impact of drivers and challenges in 2025 and 2030

3. Market Landscape

3.1 Market ecosystem

Chart on Parent Market
Data Table on - Parent Market

3.2 Market characteristics

Chart on Market characteristics analysis

3.3 Value chain analysis

Chart on Value chain analysis

4. Market Sizing

4.1 Market definition

Data Table on Offerings of companies included in the market definition

4.2 Market segment analysis

Market segments

4.3 Market size 2025

4.4 Market outlook: Forecast for 2025-2030

Chart on Global - Market size and forecast 2025-2030 ($ million)
Data Table on Global - Market size and forecast 2025-2030 ($ million)
Chart on Global Market: Year-over-year growth 2025-2030 (%)
Data Table on Global Market: Year-over-year growth 2025-2030 (%)

5. Historic Market Size

5.1 Global Secure Sockets Layer Certification Market 2020 - 2024

Historic Market Size - Data Table on Global Secure Sockets Layer Certification Market 2020 - 2024 ($ million)

5.2 Type segment analysis 2020 - 2024

Historic Market Size - Type Segment 2020 - 2024 ($ million)

5.3 End-user segment analysis 2020 - 2024

Historic Market Size - End-user Segment 2020 - 2024 ($ million)

5.4 Application segment analysis 2020 - 2024

Historic Market Size - Application Segment 2020 - 2024 ($ million)

5.5 Product Type segment analysis 2020 - 2024

Historic Market Size - Product Type Segment 2020 - 2024 ($ million)

5.6 Geography segment analysis 2020 - 2024

Historic Market Size - Geography Segment 2020 - 2024 ($ million)

5.7 Country segment analysis 2020 - 2024

Historic Market Size - Country Segment 2020 - 2024 ($ million)

6. Qualitative Analysis

6.1 Impact of AI on global secure sockets layer certification market

6.2 Impact of geopolitical conflicts on global secure sockets layer certification market

7. Five Forces Analysis

7.1 Five forces summary

Five forces analysis - Comparison between 2025 and 2030

7.2 Bargaining power of buyers

Bargaining power of buyers - Impact of key factors 2025 and 2030

7.3 Bargaining power of suppliers

Bargaining power of suppliers - Impact of key factors in 2025 and 2030

7.4 Threat of new entrants

Threat of new entrants - Impact of key factors in 2025 and 2030

7.5 Threat of substitutes

Threat of substitutes - Impact of key factors in 2025 and 2030

7.6 Threat of rivalry

Threat of rivalry - Impact of key factors in 2025 and 2030

7.7 Market condition

Chart on Market condition - Five forces 2025 and 2030

8. Market Segmentation by Type

8.1 Market segments

Chart on Type - Market share 2025-2030 (%)
Data Table on Type - Market share 2025-2030 (%)

8.2 Comparison by Type

Chart on Comparison by Type
Data Table on Comparison by Type

8.3 Domain validation - Market size and forecast 2025-2030

Chart on Domain validation - Market size and forecast 2025-2030 ($ million)
Data Table on Domain validation - Market size and forecast 2025-2030 ($ million)
Chart on Domain validation - Year-over-year growth 2025-2030 (%)
Data Table on Domain validation - Year-over-year growth 2025-2030 (%)

8.4 Organization validation - Market size and forecast 2025-2030

Chart on Organization validation - Market size and forecast 2025-2030 ($ million)
Data Table on Organization validation - Market size and forecast 2025-2030 ($ million)
Chart on Organization validation - Year-over-year growth 2025-2030 (%)
Data Table on Organization validation - Year-over-year growth 2025-2030 (%)

8.5 Extended validation - Market size and forecast 2025-2030

Chart on Extended validation - Market size and forecast 2025-2030 ($ million)
Data Table on Extended validation - Market size and forecast 2025-2030 ($ million)
Chart on Extended validation - Year-over-year growth 2025-2030 (%)
Data Table on Extended validation - Year-over-year growth 2025-2030 (%)

8.6 Market opportunity by Type

Market opportunity by Type ($ million)
Data Table on Market opportunity by Type ($ million)

9. Market Segmentation by End-user

9.1 Market segments

Chart on End-user - Market share 2025-2030 (%)
Data Table on End-user - Market share 2025-2030 (%)

9.2 Comparison by End-user

Chart on Comparison by End-user
Data Table on Comparison by End-user

9.3 Large enterprises - Market size and forecast 2025-2030

Chart on Large enterprises - Market size and forecast 2025-2030 ($ million)
Data Table on Large enterprises - Market size and forecast 2025-2030 ($ million)
Chart on Large enterprises - Year-over-year growth 2025-2030 (%)
Data Table on Large enterprises - Year-over-year growth 2025-2030 (%)

9.4 SMEs - Market size and forecast 2025-2030

Chart on SMEs - Market size and forecast 2025-2030 ($ million)
Data Table on SMEs - Market size and forecast 2025-2030 ($ million)
Chart on SMEs - Year-over-year growth 2025-2030 (%)
Data Table on SMEs - Year-over-year growth 2025-2030 (%)

9.5 Market opportunity by End-user

Market opportunity by End-user ($ million)
Data Table on Market opportunity by End-user ($ million)

10. Market Segmentation by Application

10.1 Market segments

Chart on Application - Market share 2025-2030 (%)
Data Table on Application - Market share 2025-2030 (%)

10.2 Comparison by Application

Chart on Comparison by Application
Data Table on Comparison by Application

10.3 E-commerce websites - Market size and forecast 2025-2030

Chart on E-commerce websites - Market size and forecast 2025-2030 ($ million)
Data Table on E-commerce websites - Market size and forecast 2025-2030 ($ million)
Chart on E-commerce websites - Year-over-year growth 2025-2030 (%)
Data Table on E-commerce websites - Year-over-year growth 2025-2030 (%)

10.4 Banking and financial institutions - Market size and forecast 2025-2030

Chart on Banking and financial institutions - Market size and forecast 2025-2030 ($ million)
Data Table on Banking and financial institutions - Market size and forecast 2025-2030 ($ million)
Chart on Banking and financial institutions - Year-over-year growth 2025-2030 (%)
Data Table on Banking and financial institutions - Year-over-year growth 2025-2030 (%)

10.5 Healthcare organizations - Market size and forecast 2025-2030

Chart on Healthcare organizations - Market size and forecast 2025-2030 ($ million)
Data Table on Healthcare organizations - Market size and forecast 2025-2030 ($ million)
Chart on Healthcare organizations - Year-over-year growth 2025-2030 (%)
Data Table on Healthcare organizations - Year-over-year growth 2025-2030 (%)

10.6 Government websites - Market size and forecast 2025-2030

Chart on Government websites - Market size and forecast 2025-2030 ($ million)
Data Table on Government websites - Market size and forecast 2025-2030 ($ million)
Chart on Government websites - Year-over-year growth 2025-2030 (%)
Data Table on Government websites - Year-over-year growth 2025-2030 (%)

10.7 Social media platforms - Market size and forecast 2025-2030

Chart on Social media platforms - Market size and forecast 2025-2030 ($ million)
Data Table on Social media platforms - Market size and forecast 2025-2030 ($ million)
Chart on Social media platforms - Year-over-year growth 2025-2030 (%)
Data Table on Social media platforms - Year-over-year growth 2025-2030 (%)

10.8 Market opportunity by Application

Market opportunity by Application ($ million)
Data Table on Market opportunity by Application ($ million)

11. Market Segmentation by Product Type

11.1 Market segments

Chart on Product Type - Market share 2025-2030 (%)
Data Table on Product Type - Market share 2025-2030 (%)

11.2 Comparison by Product Type

Chart on Comparison by Product Type
Data Table on Comparison by Product Type

11.3 Single domain - Market size and forecast 2025-2030

Chart on Single domain - Market size and forecast 2025-2030 ($ million)
Data Table on Single domain - Market size and forecast 2025-2030 ($ million)
Chart on Single domain - Year-over-year growth 2025-2030 (%)
Data Table on Single domain - Year-over-year growth 2025-2030 (%)

11.4 Multi-domain - Market size and forecast 2025-2030

Chart on Multi-domain - Market size and forecast 2025-2030 ($ million)
Data Table on Multi-domain - Market size and forecast 2025-2030 ($ million)
Chart on Multi-domain - Year-over-year growth 2025-2030 (%)
Data Table on Multi-domain - Year-over-year growth 2025-2030 (%)

11.5 Wildcard - Market size and forecast 2025-2030

Chart on Wildcard - Market size and forecast 2025-2030 ($ million)
Data Table on Wildcard - Market size and forecast 2025-2030 ($ million)
Chart on Wildcard - Year-over-year growth 2025-2030 (%)
Data Table on Wildcard - Year-over-year growth 2025-2030 (%)

11.6 Market opportunity by Product Type

Market opportunity by Product Type ($ million)
Data Table on Market opportunity by Product Type ($ million)

12. Customer Landscape

12.1 Customer landscape overview

Analysis of price sensitivity, lifecycle, customer purchase basket, adoption rates, and purchase criteria

13. Geographic Landscape

13.1 Geographic segmentation

Chart on Market share by geography 2025-2030 (%)
Data Table on Market share by geography 2025-2030 (%)

13.2 Geographic comparison

Chart on Geographic comparison
Data Table on Geographic comparison

13.3 North America - Market size and forecast 2025-2030

Chart on North America - Market size and forecast 2025-2030 ($ million)
Data Table on North America - Market size and forecast 2025-2030 ($ million)
Chart on North America - Year-over-year growth 2025-2030 (%)
Data Table on North America - Year-over-year growth 2025-2030 (%)
Chart on Regional Comparison - North America
Data Table on Regional Comparison - North America

13.3.1 US - Market size and forecast 2025-2030

Chart on US - Market size and forecast 2025-2030 ($ million)
Data Table on US - Market size and forecast 2025-2030 ($ million)
Chart on US - Year-over-year growth 2025-2030 (%)
Data Table on US - Year-over-year growth 2025-2030 (%)

13.3.2 Canada - Market size and forecast 2025-2030

Chart on Canada - Market size and forecast 2025-2030 ($ million)
Data Table on Canada - Market size and forecast 2025-2030 ($ million)
Chart on Canada - Year-over-year growth 2025-2030 (%)
Data Table on Canada - Year-over-year growth 2025-2030 (%)

13.3.3 Mexico - Market size and forecast 2025-2030

Chart on Mexico - Market size and forecast 2025-2030 ($ million)
Data Table on Mexico - Market size and forecast 2025-2030 ($ million)
Chart on Mexico - Year-over-year growth 2025-2030 (%)
Data Table on Mexico - Year-over-year growth 2025-2030 (%)

13.4 Europe - Market size and forecast 2025-2030

Chart on Europe - Market size and forecast 2025-2030 ($ million)
Data Table on Europe - Market size and forecast 2025-2030 ($ million)
Chart on Europe - Year-over-year growth 2025-2030 (%)
Data Table on Europe - Year-over-year growth 2025-2030 (%)
Chart on Regional Comparison - Europe
Data Table on Regional Comparison - Europe

13.4.1 Germany - Market size and forecast 2025-2030

Chart on Germany - Market size and forecast 2025-2030 ($ million)
Data Table on Germany - Market size and forecast 2025-2030 ($ million)
Chart on Germany - Year-over-year growth 2025-2030 (%)
Data Table on Germany - Year-over-year growth 2025-2030 (%)

13.4.2 UK - Market size and forecast 2025-2030

Chart on UK - Market size and forecast 2025-2030 ($ million)
Data Table on UK - Market size and forecast 2025-2030 ($ million)
Chart on UK - Year-over-year growth 2025-2030 (%)
Data Table on UK - Year-over-year growth 2025-2030 (%)

13.4.3 France - Market size and forecast 2025-2030

Chart on France - Market size and forecast 2025-2030 ($ million)
Data Table on France - Market size and forecast 2025-2030 ($ million)
Chart on France - Year-over-year growth 2025-2030 (%)
Data Table on France - Year-over-year growth 2025-2030 (%)

13.4.4 Italy - Market size and forecast 2025-2030

Chart on Italy - Market size and forecast 2025-2030 ($ million)
Data Table on Italy - Market size and forecast 2025-2030 ($ million)
Chart on Italy - Year-over-year growth 2025-2030 (%)
Data Table on Italy - Year-over-year growth 2025-2030 (%)

13.4.5 Spain - Market size and forecast 2025-2030

Chart on Spain - Market size and forecast 2025-2030 ($ million)
Data Table on Spain - Market size and forecast 2025-2030 ($ million)
Chart on Spain - Year-over-year growth 2025-2030 (%)
Data Table on Spain - Year-over-year growth 2025-2030 (%)

13.4.6 The Netherlands - Market size and forecast 2025-2030

Chart on The Netherlands - Market size and forecast 2025-2030 ($ million)
Data Table on The Netherlands - Market size and forecast 2025-2030 ($ million)
Chart on The Netherlands - Year-over-year growth 2025-2030 (%)
Data Table on The Netherlands - Year-over-year growth 2025-2030 (%)

13.5 APAC - Market size and forecast 2025-2030

Chart on APAC - Market size and forecast 2025-2030 ($ million)
Data Table on APAC - Market size and forecast 2025-2030 ($ million)
Chart on APAC - Year-over-year growth 2025-2030 (%)
Data Table on APAC - Year-over-year growth 2025-2030 (%)
Chart on Regional Comparison - APAC
Data Table on Regional Comparison - APAC

13.5.1 China - Market size and forecast 2025-2030

Chart on China - Market size and forecast 2025-2030 ($ million)
Data Table on China - Market size and forecast 2025-2030 ($ million)
Chart on China - Year-over-year growth 2025-2030 (%)
Data Table on China - Year-over-year growth 2025-2030 (%)

13.5.2 Japan - Market size and forecast 2025-2030

Chart on Japan - Market size and forecast 2025-2030 ($ million)
Data Table on Japan - Market size and forecast 2025-2030 ($ million)
Chart on Japan - Year-over-year growth 2025-2030 (%)
Data Table on Japan - Year-over-year growth 2025-2030 (%)

13.5.3 India - Market size and forecast 2025-2030

Chart on India - Market size and forecast 2025-2030 ($ million)
Data Table on India - Market size and forecast 2025-2030 ($ million)
Chart on India - Year-over-year growth 2025-2030 (%)
Data Table on India - Year-over-year growth 2025-2030 (%)

13.5.4 South Korea - Market size and forecast 2025-2030

Chart on South Korea - Market size and forecast 2025-2030 ($ million)
Data Table on South Korea - Market size and forecast 2025-2030 ($ million)
Chart on South Korea - Year-over-year growth 2025-2030 (%)
Data Table on South Korea - Year-over-year growth 2025-2030 (%)

13.5.5 Australia - Market size and forecast 2025-2030

Chart on Australia - Market size and forecast 2025-2030 ($ million)
Data Table on Australia - Market size and forecast 2025-2030 ($ million)
Chart on Australia - Year-over-year growth 2025-2030 (%)
Data Table on Australia - Year-over-year growth 2025-2030 (%)

13.5.6 Indonesia - Market size and forecast 2025-2030

Chart on Indonesia - Market size and forecast 2025-2030 ($ million)
Data Table on Indonesia - Market size and forecast 2025-2030 ($ million)
Chart on Indonesia - Year-over-year growth 2025-2030 (%)
Data Table on Indonesia - Year-over-year growth 2025-2030 (%)

13.6 South America - Market size and forecast 2025-2030

Chart on South America - Market size and forecast 2025-2030 ($ million)
Data Table on South America - Market size and forecast 2025-2030 ($ million)
Chart on South America - Year-over-year growth 2025-2030 (%)
Data Table on South America - Year-over-year growth 2025-2030 (%)
Chart on Regional Comparison - South America
Data Table on Regional Comparison - South America

13.6.1 Brazil - Market size and forecast 2025-2030

Chart on Brazil - Market size and forecast 2025-2030 ($ million)
Data Table on Brazil - Market size and forecast 2025-2030 ($ million)
Chart on Brazil - Year-over-year growth 2025-2030 (%)
Data Table on Brazil - Year-over-year growth 2025-2030 (%)

13.6.2 Argentina - Market size and forecast 2025-2030

Chart on Argentina - Market size and forecast 2025-2030 ($ million)
Data Table on Argentina - Market size and forecast 2025-2030 ($ million)
Chart on Argentina - Year-over-year growth 2025-2030 (%)
Data Table on Argentina - Year-over-year growth 2025-2030 (%)

13.6.3 Chile - Market size and forecast 2025-2030

Chart on Chile - Market size and forecast 2025-2030 ($ million)
Data Table on Chile - Market size and forecast 2025-2030 ($ million)
Chart on Chile - Year-over-year growth 2025-2030 (%)
Data Table on Chile - Year-over-year growth 2025-2030 (%)

13.7 Middle East and Africa - Market size and forecast 2025-2030

Chart on Middle East and Africa - Market size and forecast 2025-2030 ($ million)
Data Table on Middle East and Africa - Market size and forecast 2025-2030 ($ million)
Chart on Middle East and Africa - Year-over-year growth 2025-2030 (%)
Data Table on Middle East and Africa - Year-over-year growth 2025-2030 (%)
Chart on Regional Comparison - Middle East and Africa
Data Table on Regional Comparison - Middle East and Africa

13.7.1 Saudi Arabia - Market size and forecast 2025-2030

Chart on Saudi Arabia - Market size and forecast 2025-2030 ($ million)
Data Table on Saudi Arabia - Market size and forecast 2025-2030 ($ million)
Chart on Saudi Arabia - Year-over-year growth 2025-2030 (%)
Data Table on Saudi Arabia - Year-over-year growth 2025-2030 (%)

13.7.2 UAE - Market size and forecast 2025-2030

Chart on UAE - Market size and forecast 2025-2030 ($ million)
Data Table on UAE - Market size and forecast 2025-2030 ($ million)
Chart on UAE - Year-over-year growth 2025-2030 (%)
Data Table on UAE - Year-over-year growth 2025-2030 (%)

13.7.3 South Africa - Market size and forecast 2025-2030

Chart on South Africa - Market size and forecast 2025-2030 ($ million)
Data Table on South Africa - Market size and forecast 2025-2030 ($ million)
Chart on South Africa - Year-over-year growth 2025-2030 (%)
Data Table on South Africa - Year-over-year growth 2025-2030 (%)

13.7.4 Israel - Market size and forecast 2025-2030

Chart on Israel - Market size and forecast 2025-2030 ($ million)
Data Table on Israel - Market size and forecast 2025-2030 ($ million)
Chart on Israel - Year-over-year growth 2025-2030 (%)
Data Table on Israel - Year-over-year growth 2025-2030 (%)

13.7.5 Turkey - Market size and forecast 2025-2030

Chart on Turkey - Market size and forecast 2025-2030 ($ million)
Data Table on Turkey - Market size and forecast 2025-2030 ($ million)
Chart on Turkey - Year-over-year growth 2025-2030 (%)
Data Table on Turkey - Year-over-year growth 2025-2030 (%)

13.8 Market opportunity by geography

Market opportunity by geography ($ million)
Data Tables on Market opportunity by geography ($ million)

14. Drivers, Challenges, and Opportunity

14.1 Market drivers

Strict enforcement of browser compliance baselines demand universal implementation of valid encryption components
Exponential proliferation of connected non human network endpoints requiring independent cryptographic verification frameworks
Rapid global scaling of advanced electronic commerce modalities processing immense volumes of sensitive transactional material

14.2 Market challenges

Operational friction resulting from continually compressed validity periods and accelerated lifecycle management
Technical hurdles associated with transitioning modern network infrastructures to post quantum cryptographic standards
Severe visibility gaps and fragmentation challenges inherited from distributing cryptographic assets across multi company networks

14.3 Impact of drivers and challenges

Impact of drivers and challenges in 2025 and 2030

14.4 Market opportunities

Universal adoption of automated lifecycle configuration modules to overcome shortened reissue execution parameters
Widespread structural deployment of cryptographic agility integration infrastructures supporting rapid algorithmic reconfiguration requirements
Aggressive institutional enforcement of distributed multi perspective domain control verification processes for issuance protection

15. Competitive Landscape

15.1 Overview

15.2

Overview on criticality of inputs and factors of differentiation

15.3 Landscape disruption

Overview on factors of disruption

15.4 Industry risks

Impact of key risks on business

16. Competitive Analysis

16.1 Companies profiled

Companies covered

16.2 Company ranking index

16.3 Market positioning of companies

Matrix on companies position and classification

16.4 Amazon.com Inc.

Amazon.com Inc. - Overview
Amazon.com Inc. - Business segments
Amazon.com Inc. - Key news
Amazon.com Inc. - Key offerings
Amazon.com Inc. - Segment focus
SWOT

16.5 Buypass AS

Buypass AS - Overview
Buypass AS - Product / Service
Buypass AS - Key offerings
SWOT

16.6 Cloudflare Inc.

Cloudflare Inc. - Overview
Cloudflare Inc. - Product / Service
Cloudflare Inc. - Key offerings
SWOT

16.7 eMudhra Ltd.

eMudhra Ltd. - Overview
eMudhra Ltd. - Product / Service
eMudhra Ltd. - Key offerings
SWOT

16.8 Entrust Corp.

Entrust Corp. - Overview
Entrust Corp. - Product / Service
Entrust Corp. - Key offerings
SWOT

16.9 Gandi SAS

Gandi SAS - Overview
Gandi SAS - Product / Service
Gandi SAS - Key offerings
SWOT

16.10 GlobalSign Ltd.

GlobalSign Ltd. - Overview
GlobalSign Ltd. - Product / Service
GlobalSign Ltd. - Key offerings
SWOT

16.11 GoDaddy Inc.

GoDaddy Inc. - Overview
GoDaddy Inc. - Business segments
GoDaddy Inc. - Key offerings
GoDaddy Inc. - Segment focus
SWOT

16.12 Google LLC

Google LLC - Overview
Google LLC - Product / Service
Google LLC - Key offerings
SWOT

16.13 IdenTrust Inc.

IdenTrust Inc. - Overview
IdenTrust Inc. - Product / Service
IdenTrust Inc. - Key offerings
SWOT

16.14 Namecheap Inc.

Namecheap Inc. - Overview
Namecheap Inc. - Product / Service
Namecheap Inc. - Key offerings
SWOT

16.15 Network Solutions LLC

Network Solutions LLC - Overview
Network Solutions LLC - Product / Service
Network Solutions LLC - Key offerings
SWOT

16.16 Porkbun LLC

Porkbun LLC - Overview
Porkbun LLC - Product / Service
Porkbun LLC - Key offerings
SWOT

16.17 SwissSign AG

SwissSign AG - Overview
SwissSign AG - Product / Service
SwissSign AG - Key offerings
SWOT

16.18 VikingCloud

VikingCloud - Overview
VikingCloud - Product / Service
VikingCloud - Key offerings
SWOT

17. Appendix

17.1 Scope of the report

Market definition
Objectives
Notes and caveats

17.2 Inclusions and exclusions checklist

Inclusions checklist
Exclusions checklist

17.3 Currency conversion rates for US$

17.4 Research methodology

17.5 Data procurement

Information sources

17.6 Data validation

17.7 Validation techniques employed for market sizing

17.8 Data synthesis

17.9 360 degree market analysis

17.10 List of abbreviations

Research Methodology

Technavio presents a detailed picture of the market by way of study, synthesis, and summation of data from multiple sources. The analysts have presented the various facets of the market with a particular focus on identifying the key industry influencers. The data thus presented is comprehensive, reliable, and the result of extensive research, both primary and secondary.

INFORMATION SOURCES

Primary sources

  • Manufacturers and suppliers
  • Channel partners
  • Industry experts
  • Strategic decision makers

Secondary sources

  • Industry journals and periodicals
  • Government data
  • Financial reports of key industry players
  • Historical data
  • Press releases

DATA ANALYSIS

Data Synthesis

  • Collation of data
  • Estimation of key figures
  • Analysis of derived insights

Data Validation

  • Triangulation with data models
  • Reference against proprietary databases
  • Corroboration with industry experts

REPORT WRITING

Qualitative

  • Market drivers
  • Market challenges
  • Market trends
  • Five forces analysis

Quantitative

  • Market size and forecast
  • Market segmentation
  • Geographical insights
  • Competitive landscape

Interested in this report?

Get your sample now to see our research methodology and insights!

Download Now

Frequently Asked Questions

Secure Sockets Layer Certification market growth will increase by USD 18916.5 million during 2026-2030.

The Secure Sockets Layer Certification market is expected to grow at a CAGR of 28.4% during 2026-2030.

Secure Sockets Layer Certification market is segmented by Type (Domain validation, Organization validation, Extended validation) End-user (Large enterprises, SMEs) Application (E-commerce websites, Banking and financial institutions, Healthcare organizations, Government websites, Social media platforms) Product type (Single domain, Multi-domain, Wildcard)

Amazon.com Inc., Buypass AS, Cloudflare Inc., DreamHost LLC, eMudhra Ltd., Entrust Corp., Gandi SAS, GlobalSign Ltd., GoDaddy Inc., Google LLC, IdenTrust Inc., Namecheap Inc., Network Solutions LLC, Porkbun LLC, Sectigo Ltd., SSL.com, SwissSign AG, VikingCloud, Wisekey Holding AG, ZeroSSL are a few of the key vendors in the Secure Sockets Layer Certification market.

North America will register the highest growth rate of 43.1% among the other regions. Therefore, the Secure Sockets Layer Certification market in North America is expected to garner significant business opportunities for the vendors during the forecast period.

US, Canada, Mexico, Germany, UK, France, Italy, Spain, The Netherlands, China, Japan, India, South Korea, Australia, Indonesia, Brazil, Argentina, Chile, Saudi Arabia, UAE, South Africa, Israel, Turkey

  • Strict enforcement of browser compliance baselines demand universal implementation of valid encryption components is the driving factor this market.

The Secure Sockets Layer Certification market vendors should focus on grabbing business opportunities from the Type segment as it accounted for the largest market share in the base year.
RIA - Research AI Assistant
Ask RIA
