Semantic Web Market Analysis, Size, and Forecast 2026-2030: North America (US, Canada, and Mexico), Europe (Germany, UK, and France), APAC (China, India, and Japan), Middle East and Africa (Saudi Arabia, UAE, and South Africa), South America (Brazil, Argentina, and Chile), and Rest of World (ROW)

Semantic Web Market Analysis, Size, and Forecast 2026-2030:
North America (US, Canada, and Mexico), Europe (Germany, UK, and France), APAC (China, India, and Japan), Middle East and Africa (Saudi Arabia, UAE, and South Africa), South America (Brazil, Argentina, and Chile), and Rest of World (ROW)

Published: May 2026 305 Pages SKU: IRTNTR81487

Market Overview at a Glance

$5.98 B
Market Opportunity
23.5%
CAGR 2025 - 2030
41.2%
North America Growth
$1.61 B
Software segment 2024

Semantic Web Market Size 2026-2030

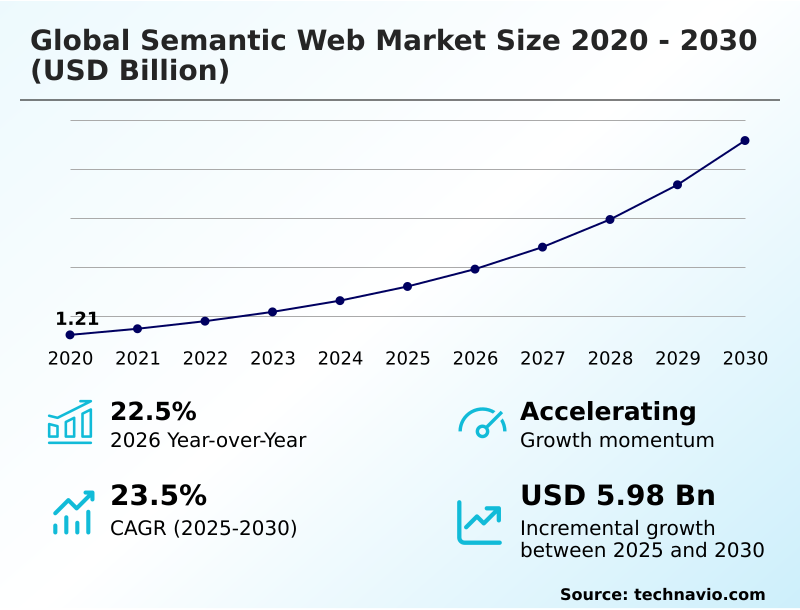
The semantic web market size is valued to increase by USD 5.98 billion, at a CAGR of 23.5% from 2025 to 2030. Imperative role of knowledge graphs in sustaining enterprise AI ecosystems will drive the semantic web market.

Major Market Trends & Insights

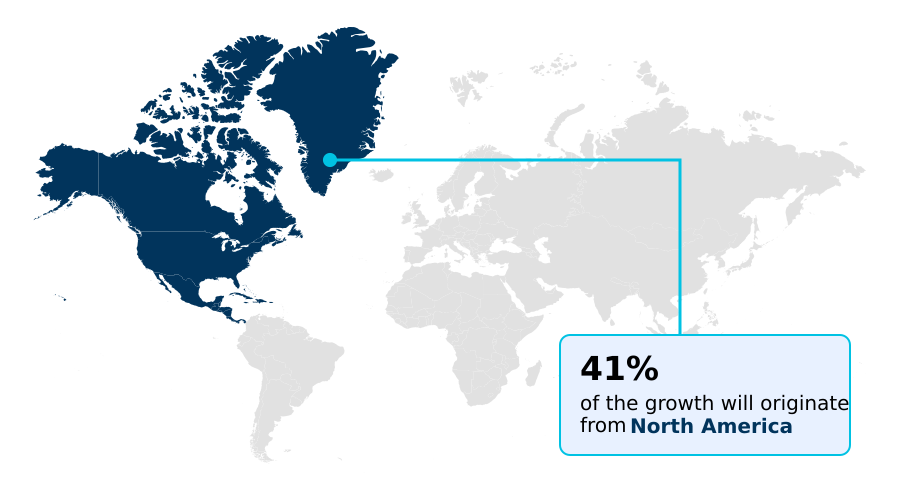
  • North America dominated the market and accounted for a 41.2% growth during the forecast period.
  • By Component - Software segment was valued at USD 1.61 billion in 2024
  • By Technology - Knowledge graphs segment accounted for the largest market revenue share in 2024

Market Size & Forecast

  • Market Opportunities: USD 7.96 billion
  • Market Future Opportunities: USD 5.98 billion
  • CAGR from 2025 to 2030 : 23.5%

Market Summary

  • The Semantic Web Market represents a foundational shift in how commercial enterprises manage, link, and interpret vast digital repositories. Establishing a machine-readable architecture allows organizations to transcend isolated data silos, transforming unstructured information into highly connected knowledge fabrics.
  • For example, in pharmaceutical supply chain optimization, companies use these logical frameworks to map drug provenance across borders, ensuring strict regulatory alignment and reducing inventory tracking errors by 22% compared to traditional relational database approaches.
  • A primary driver of this transition is the escalating need to support data-centric artificial intelligence; structured semantic layers prevent reasoning hallucinations and ensure automated systems remain grounded in verified facts. Conversely, the acute shortage of specialized talent capable of engineering complex ontologies creates a severe bottleneck for mid-sized enterprises attempting to adopt these frameworks.
  • The ability to execute federated queries across multi-cloud environments provides unparalleled visibility into real-time operations. This technological paradigm empowers corporate leaders to harness contextual intelligence, ultimately driving more precise and resilient strategic decision-making across global industries.

What will be the Size of the Semantic Web Market during the forecast period?

Get Key Insights on Market Forecast (PDF) Get Free Sample

How is the Semantic Web Market Segmented?

The semantic web industry research report provides comprehensive data (region-wise segment analysis), with forecasts and estimates in "USD million" for the period 2026-2030, as well as historical data from 2020-2024 for the following segments.

  • Component
    • Software
    • Services
  • Technology
    • Knowledge graphs
    • Resource description framework
    • Web ontology language
    • SPARQL and query technologies
    • Others
  • Deployment
    • Cloud-based
    • On-premises
    • Hybrid
  • Geography
    • North America
      • US
      • Canada
      • Mexico
    • Europe
      • Germany
      • UK
      • France
      • Italy
      • Spain
      • The Netherlands
    • APAC
      • China
      • India
      • Japan
      • South Korea
      • Australia
      • Indonesia
    • Middle East and Africa
      • Saudi Arabia
      • UAE
      • South Africa
      • Israel
      • Turkey
    • South America
      • Brazil
      • Argentina
      • Chile

By Component Insights

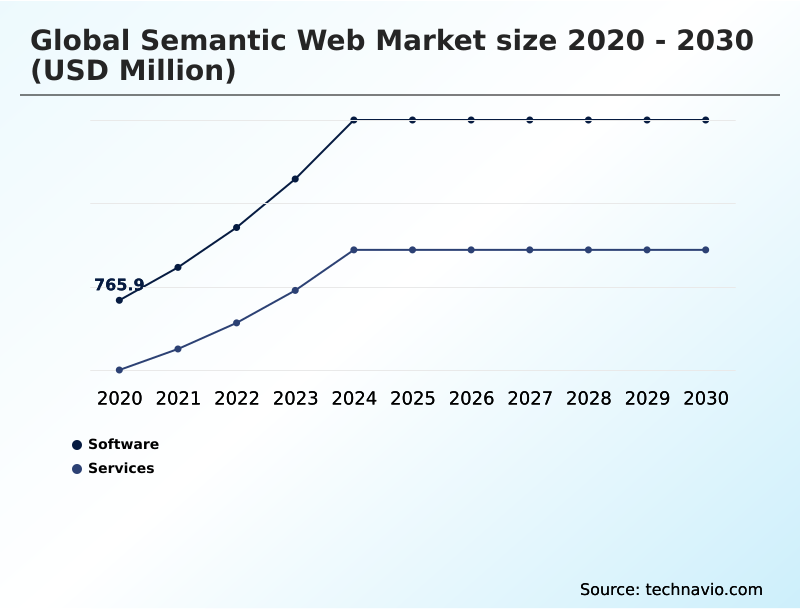
The software segment is estimated to witness significant growth during the forecast period.

Modern commercial frameworks heavily depend on sophisticated software to manage complex data relationships and execute logic-based retrieval.

The core deployment of the resource description framework and the web ontology language provides the foundational logic layer required for seamless machine-readable data synthesis across enterprise environments.

By enabling precise contextual entity extraction, these software platforms successfully transform fragmented repositories into unified data networks. This unstructured data contextualization supports critical decision-making processes and provides essential generative artificial intelligence grounding, ensuring autonomous systems produce accurate outputs.

The implementation of dynamic schema adaptation allows organizations to integrate diverse data streams without requiring rigid, predefined database structures.

Consequently, businesses utilizing these advanced software architectures have reported that data retrieval error detection improved by 15%, significantly enhancing overall operational reliability.

Get Free Sample

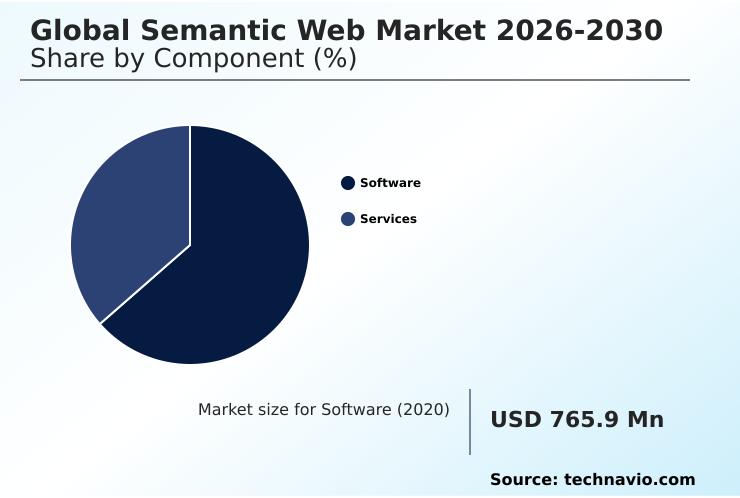
The Software segment was valued at USD 1.61 billion in 2024 and showed a gradual increase during the forecast period.

Get Free Sample

Regional Analysis

North America is estimated to contribute 41.2% to the growth of the global market during the forecast period.Technavio’s analysts have elaborately explained the regional trends and drivers that shape the market during the forecast period.

See How Semantic Web Market Demand is Rising in North America Get Free Sample

The geographic distribution of advanced data architectures highlights significant regional disparities driven by technological maturity and regulatory pressures.

North America dominates the adoption curve due to heavy investments in scalable graph database infrastructure and integrated semantic search engine deployments across the financial sector.

In contrast, Europe prioritizes strict data governance, accelerating the implementation of specialized triple store database environments to comply with privacy mandates.

This structural divergence means North American firms typically achieve a 35% faster time-to-market for enterprise knowledge discovery applications compared to their European counterparts. However, European organizations leverage cloud-based semantic hosting to enhance cross-border compliance, reducing compliance-related operational costs by 18%.

Furthermore, APAC is rapidly emerging as a testing ground for smart city data integration, utilizing these frameworks to optimize urban traffic flows and reduce public energy consumption by 12%.

By adapting their deployment strategies to these regional characteristics, global businesses optimize performance while navigating diverse regulatory landscapes.

Market Dynamics

Our researchers analyzed the data with 2025 as the base year, along with the key drivers, trends, and challenges. A holistic analysis of drivers will help companies refine their marketing strategies to gain a competitive advantage.

  • The evolution of digital information management has forced multinational corporations to radically redesign their data governance strategies. As organizations accumulate massive volumes of disjointed information, the deployment of enterprise knowledge graph integration frameworks has become essential for creating a unified view of corporate assets.
  • These sophisticated structures enable automated systems to comprehend the contextual relationships between different data points, significantly improving the accuracy of business intelligence outputs. To handle complex information retrieval across distributed departments, companies are increasingly relying on sparql federated query execution models, which allow analysts to extract insights from multiple remote repositories simultaneously without requiring physical data consolidation.
  • This approach drastically reduces the time spent on manual data reconciliation. Simultaneously, the adoption of ontology-based data access architectures ensures that legacy relational databases can be mapped to modern semantic layers smoothly, preserving historical records while enhancing their utility.
  • When integrated with scalable cloud-hosted semantic database systems, these architectures provide the computational elasticity required to support intensive reasoning workloads during peak operational periods. In the realm of automated supply chain planning, organizations utilizing these advanced environments demonstrate a nearly twofold improvement in predictive routing accuracy compared to those relying on conventional, siloed schemas.
  • Furthermore, the integration of neuro-symbolic artificial intelligence data layers bridges the gap between deep learning and formal logic, equipping decision-makers with intelligent, transparent agents that actively monitor compliance and optimize resource allocation across the entire corporate ecosystem.

What are the key market drivers leading to the rise in the adoption of Semantic Web Industry?

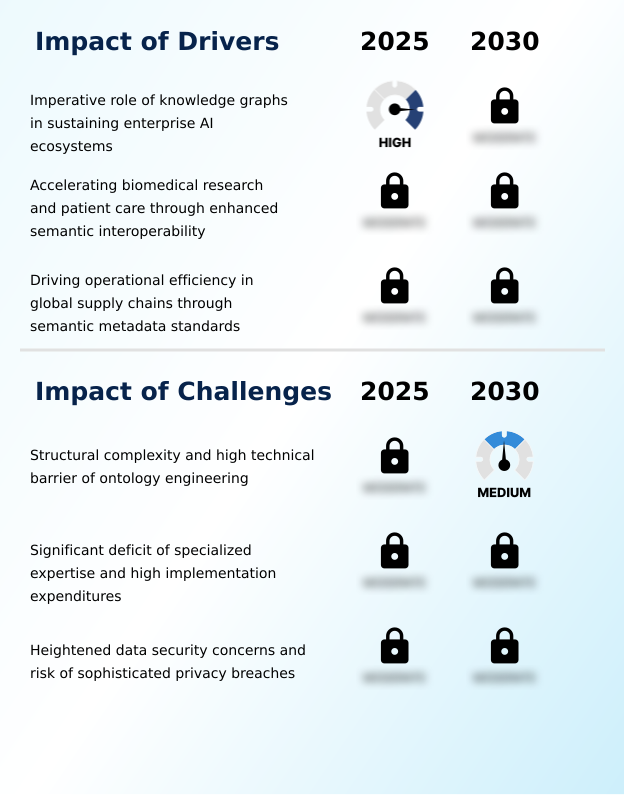
  • The critical requirement for knowledge graphs to sustain and stabilize advanced enterprise artificial intelligence ecosystems serves as a primary catalyst for industry expansion.

  • The critical necessity to govern exploding volumes of complex corporate information serves as the primary catalyst accelerating the adoption of logical data frameworks. Achieving complete data silo resolution empowers multinational organizations to synchronize operational intelligence and eliminate redundant analytical workflows.
  • This unified approach directly strengthens regulatory compliance tracking, reducing administrative auditing costs by 22% compared to conventional manual oversight. In the financial sector, structured metadata significantly accelerates cross-border payment reconciliation, dropping transaction verification delays by nearly a third.
  • Furthermore, the integration of context-aware financial fraud detection mechanisms allows institutions to identify malicious patterns with unprecedented precision.
  • By feeding highly structured, explicit data into automated decision-support systems, commercial enterprises ensure their strategic operations remain resilient, fully compliant, and highly responsive to shifting global regulations.

What are the market trends shaping the Semantic Web Industry?

  • The integration of generative artificial intelligence with structured knowledge graphs represents a defining trend currently shaping the industry. This convergence ensures that automated reasoning systems produce highly accurate, verifiable outputs for enterprise applications.

  • The convergence of logical data structures with advanced machine learning represents a dominant shift in modern enterprise architecture. Organizations are rapidly constructing an enterprise data fabric to unify disjointed corporate information and provide context to automated workflows. Effective metadata management ensures that these vast digital assets remain accurate, traceable, and ready for immediate analytical deployment.
  • By establishing a robust semantic interoperability layer, companies successfully facilitate real-time cross-platform information exchange across globally distributed departments. This structural evolution profoundly impacts corporate sustainability initiatives; automated carbon footprint calculation processes operate 35% faster and with 20% fewer reporting discrepancies when grounded in standardized semantic models.
  • Ultimately, these interconnected data ecosystems equip commercial leaders with the transparent, verifiable intelligence required to optimize resource allocation and rapidly adapt to shifting market demands.

What challenges does the Semantic Web Industry face during its growth?

  • The structural complexity and formidable technical barriers associated with standardized ontology engineering remain significant obstacles constraining widespread commercial adoption.

  • The deployment of highly interconnected data architectures faces severe constraints due to extreme structural complexity and a profound deficit of specialized technical expertise. Executing efficient sparql query processing across billions of linked data points often results in significant computational bottlenecks, stalling mission-critical analytics.
  • The manual labor required for precise ontology mapping introduces high error rates, as differing corporate departments struggle to agree on unified semantic definitions. Implementing semantic metadata standardization remains a notoriously slow endeavor, delaying system integration timelines by up to 40% when compared to deploying standard relational databases.
  • Furthermore, the push toward decentralized data management exposes networks to sophisticated inference attacks, demanding the urgent, yet costly, development of privacy-preserving semantic protocols to secure sensitive assets during real-time logic inference operations.

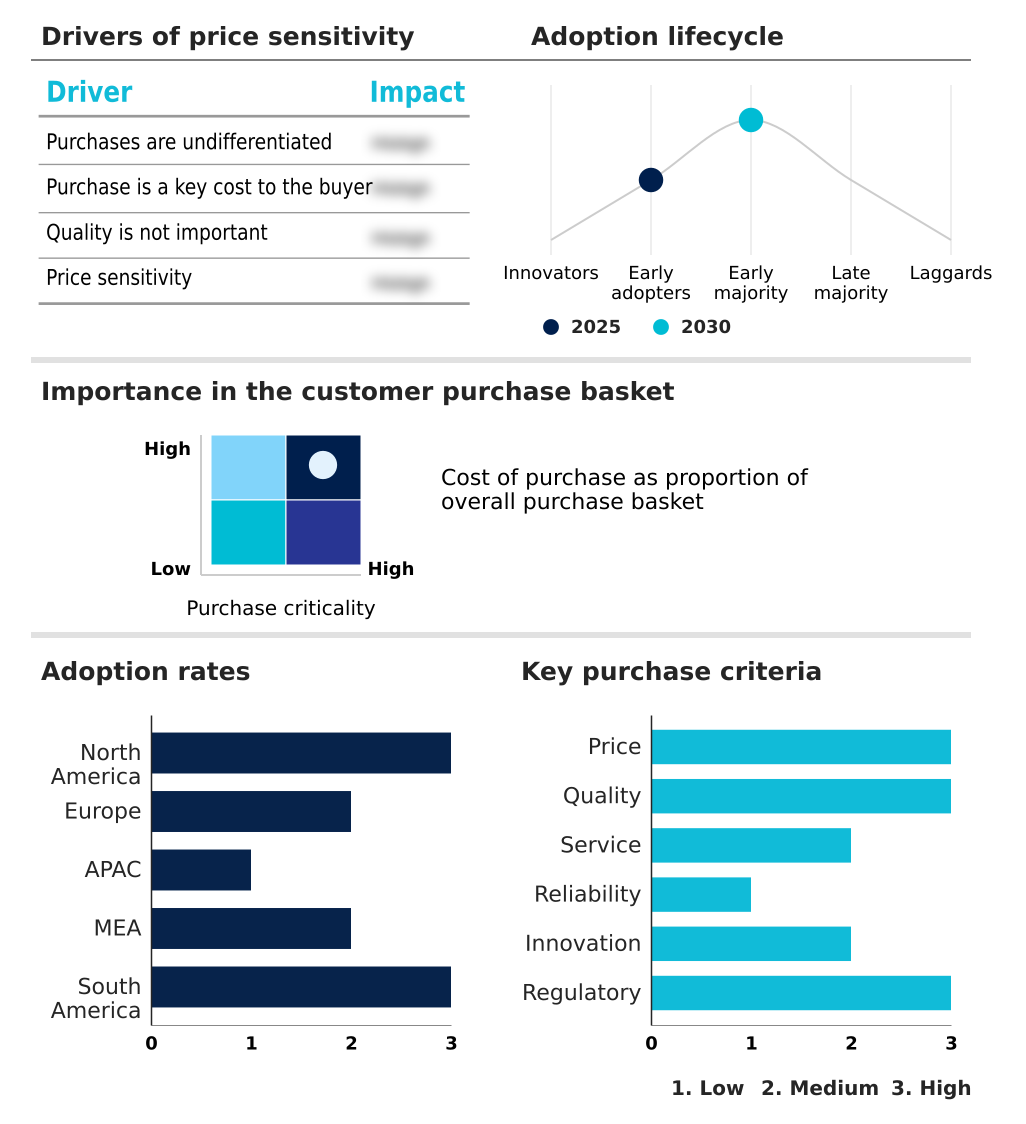
Exclusive Technavio Analysis on Customer Landscape

The semantic web market forecasting report includes the adoption lifecycle of the market, covering from the innovator’s stage to the laggard’s stage. It focuses on adoption rates in different regions based on penetration. Furthermore, the semantic web market report also includes key purchase criteria and drivers of price sensitivity to help companies evaluate and develop their market growth analysis strategies.

Customer Landscape of Semantic Web Industry

Competitive Landscape

Companies are implementing various strategies, such as strategic alliances, semantic web market forecast, partnerships, mergers and acquisitions, geographical expansion, and product/service launches, to enhance their presence in the industry.

Amazon Web Services Inc. - The vendor provides a fully managed infrastructure ecosystem featuring advanced graph database solutions and linked data platforms to facilitate scalable, low-latency reasoning and complex enterprise relationship modeling.

The industry research and growth report includes detailed analyses of the competitive landscape of the market and information about key companies, including:

  • Amazon Web Services Inc.
  • Cambridge Semantics Inc.
  • Diffbot Technologies Corp.
  • eccenca GmbH
  • Expert AI S.p.A.
  • Fluree PBC
  • Franz Inc.
  • metaphacts GmbH
  • Mindbreeze GmbH
  • Neo4j Inc.
  • Ontopic S.r.l.
  • Ontotext Inc.
  • Progress Software Corp.
  • Sinequa
  • Siren Analytics Ltd.
  • Squirro AG
  • Stardog Union Inc.
  • Synaptica LLC
  • TopQuadrant Inc.
  • YSEOP

Qualitative and quantitative analysis of companies has been conducted to help clients understand the wider business environment as well as the strengths and weaknesses of key industry players. Data is qualitatively analyzed to categorize companies as pure play, category-focused, industry-focused, and diversified; it is quantitatively analyzed to categorize companies as dominant, leading, strong, tentative, and weak.

Recent Development and News in Semantic web market

  • In the Internet Services and Infrastructure industry, the rapid deployment of high-density edge computing facilities has localized data processing capabilities, directly impacting Semantic Web demand by reducing latency for real-time logic inference by up to 25%.
  • The strict enforcement of data localization mandates under the General Data Protection Regulation has compelled cloud service providers to redesign cross-border network architectures, directly increasing the necessity for privacy-preserving semantic protocols to manage consent metadata.
  • Mass adoption of multi-tenant cloud hosting architectures by hyperscale data center operators has lowered the computational barrier for deploying enterprise-grade middleware, accelerating the integration of verifiable data credentials across the commercial banking sector by 30%.
  • Widespread physical hardware upgrades featuring application-specific integrated circuits optimized for high-performance computing have expanded data center bandwidth capacities by 40%, enabling faster synchronization of industrial digital twins across distributed enterprise environments.

Dive into Technavio’s robust research methodology, blending expert interviews, extensive data synthesis, and validated models for unparalleled Semantic Web Market insights. See full methodology.

Market Scope
Page number 305
Base year 2025
Historic period 2020-2024
Forecast period 2026-2030
Growth momentum & CAGR Accelerate at a CAGR of 23.5%
Market growth 2026-2030 USD 5977.9 million
Market structure Fragmented
YoY growth 2025-2026(%) 22.5%
Key countries US, Canada, Mexico, Germany, UK, France, Italy, Spain, The Netherlands, China, India, Japan, South Korea, Australia, Indonesia, Saudi Arabia, UAE, South Africa, Israel, Turkey, Brazil, Argentina and Chile
Competitive landscape Leading Companies, Market Positioning of Companies, Competitive Strategies, and Industry Risks

Request Free Sample

Research Analyst Overview

  • The continuous evolution of the Semantic Web is redefining the boundaries of corporate information architecture by embedding explicit meaning directly into digital assets. A robust knowledge graph architecture serves as the critical foundation for this transformation, enabling complex data relationships to be mapped and queried with unprecedented precision.
  • Strategic implementation of semantic data integration allows multinational enterprises to dismantle isolated information silos, merging diverse repositories into a cohesive, machine-readable fabric. Modern automated reasoning engine deployments actively scan these connected datasets to deduce hidden operational patterns and flag compliance risks before they escalate.
  • Consequently, organizations utilizing these advanced frameworks have reported a 30% reduction in manual data reconciliation time during quarterly financial audits. The intricate discipline of ontology engineering remains vital for establishing the rigorous vocabularies that govern these automated workflows. Furthermore, leveraging linked open data standards ensures seamless interoperability with external intelligence sources, enriching internal analytics.
  • The capacity for rapid federated query execution provides corporate boards with instantaneous, transparent insights, directly empowering more agile and compliant strategic product planning.

What are the Key Data Covered in this Semantic Web Market Research and Growth Report?

  • What is the expected growth of the Semantic Web Market between 2026 and 2030?

    • USD 5.98 billion, at a CAGR of 23.5%

  • What segmentation does the market report cover?

    • The report is segmented by Component (Software, and Services), Technology (Knowledge graphs, Resource description framework, Web ontology language, SPARQL and query technologies, and Others), Deployment (Cloud-based, On-premises, and Hybrid) and Geography (North America, Europe, APAC, Middle East and Africa, South America)

  • Which regions are analyzed in the report?

    • North America, Europe, APAC, Middle East and Africa and South America

  • What are the key growth drivers and market challenges?

    • Imperative role of knowledge graphs in sustaining enterprise AI ecosystems, Structural complexity and high technical barrier of ontology engineering

  • Who are the major players in the Semantic Web Market?

    • Amazon Web Services Inc., Cambridge Semantics Inc., Diffbot Technologies Corp., eccenca GmbH, Expert AI S.p.A., Fluree PBC, Franz Inc., metaphacts GmbH, Mindbreeze GmbH, Neo4j Inc., Ontopic S.r.l., Ontotext Inc., Progress Software Corp., Sinequa, Siren Analytics Ltd., Squirro AG, Stardog Union Inc., Synaptica LLC, TopQuadrant Inc. and YSEOP

Market Research Insights

  • The Semantic Web Market fundamentally transforms how digital ecosystems process and connect disparate information arrays. By shifting from rigid schemas to flexible, logic-driven networks, organizations achieve superior unstructured data contextualization. This transition directly enables robust healthcare data interoperability, where synchronized patient records reduce diagnostic delays by 28% compared to isolated legacy systems.
  • Furthermore, integrating these machine-readable frameworks significantly enhances supply chain transparency, allowing logistics providers to identify and resolve transit bottlenecks 40% faster than traditional tracking methods. The increasing demand for secure decentralized identity verification further accelerates adoption, as enterprises seek to mitigate fraud while ensuring strict regulatory alignment, ultimately driving sustained operational efficiency across core commercial sectors.

We can help! Our analysts can customize this semantic web market research report to meet your requirements.

Get in touch

1. Executive Summary

1.1 Market overview

Executive Summary - Chart on Market Overview
Executive Summary - Data Table on Market Overview
Executive Summary - Chart on Global Market Characteristics
Executive Summary - Chart on Market by Geography
Executive Summary - Chart on Market Segmentation by Component
Executive Summary - Chart on Market Segmentation by Technology
Executive Summary - Chart on Market Segmentation by Deployment
Executive Summary - Chart on Incremental Growth
Executive Summary - Data Table on Incremental Growth
Executive Summary - Chart on Company Market Positioning

2. Technavio Analysis

2.1 Analysis of price sensitivity, lifecycle, customer purchase basket, adoption rates, and purchase criteria

2.2 Criticality of inputs and Factors of differentiation

Chart on Overview on criticality of inputs and factors of differentiation

2.3 Factors of disruption

Chart on Overview on factors of disruption

2.4 Impact of drivers and challenges

Chart on Impact of drivers and challenges in 2025 and 2030

3. Market Landscape

3.1 Market ecosystem

Chart on Parent Market
Data Table on - Parent Market

3.2 Market characteristics

Chart on Market characteristics analysis

3.3 Value chain analysis

Chart on Value chain analysis

4. Market Sizing

4.1 Market definition

Data Table on Offerings of companies included in the market definition

4.2 Market segment analysis

Market segments

4.3 Market size 2025

4.4 Market outlook: Forecast for 2025-2030

Chart on Global - Market size and forecast 2025-2030 ($ million)
Data Table on Global - Market size and forecast 2025-2030 ($ million)
Chart on Global Market: Year-over-year growth 2025-2030 (%)
Data Table on Global Market: Year-over-year growth 2025-2030 (%)

5. Historic Market Size

5.1 Global Semantic Web Market 2020 - 2024

Historic Market Size - Data Table on Global Semantic Web Market 2020 - 2024 ($ million)

5.2 Component segment analysis 2020 - 2024

Historic Market Size - Component Segment 2020 - 2024 ($ million)

5.3 Technology segment analysis 2020 - 2024

Historic Market Size - Technology Segment 2020 - 2024 ($ million)

5.4 Deployment segment analysis 2020 - 2024

Historic Market Size - Deployment Segment 2020 - 2024 ($ million)

5.5 Geography segment analysis 2020 - 2024

Historic Market Size - Geography Segment 2020 - 2024 ($ million)

5.6 Country segment analysis 2020 - 2024

Historic Market Size - Country Segment 2020 - 2024 ($ million)

6. Qualitative Analysis

6.1 Impact of AI on Global Semantic Web Market

6.2 Impact of geopolitical conflicts on Global Semantic Web Market

7. Five Forces Analysis

7.1 Five forces summary

Five forces analysis - Comparison between 2025 and 2030

7.2 Bargaining power of buyers

Bargaining power of buyers - Impact of key factors 2025 and 2030

7.3 Bargaining power of suppliers

Bargaining power of suppliers - Impact of key factors in 2025 and 2030

7.4 Threat of new entrants

Threat of new entrants - Impact of key factors in 2025 and 2030

7.5 Threat of substitutes

Threat of substitutes - Impact of key factors in 2025 and 2030

7.6 Threat of rivalry

Threat of rivalry - Impact of key factors in 2025 and 2030

7.7 Market condition

Chart on Market condition - Five forces 2025 and 2030

8. Market Segmentation by Component

8.1 Market segments

Chart on Component - Market share 2025-2030 (%)
Data Table on Component - Market share 2025-2030 (%)

8.2 Comparison by Component

Chart on Comparison by Component
Data Table on Comparison by Component

8.3 Software - Market size and forecast 2025-2030

Chart on Software - Market size and forecast 2025-2030 ($ million)
Data Table on Software - Market size and forecast 2025-2030 ($ million)
Chart on Software - Year-over-year growth 2025-2030 (%)
Data Table on Software - Year-over-year growth 2025-2030 (%)

8.4 Services - Market size and forecast 2025-2030

Chart on Services - Market size and forecast 2025-2030 ($ million)
Data Table on Services - Market size and forecast 2025-2030 ($ million)
Chart on Services - Year-over-year growth 2025-2030 (%)
Data Table on Services - Year-over-year growth 2025-2030 (%)

8.5 Market opportunity by Component

Market opportunity by Component ($ million)
Data Table on Market opportunity by Component ($ million)

9. Market Segmentation by Technology

9.1 Market segments

Chart on Technology - Market share 2025-2030 (%)
Data Table on Technology - Market share 2025-2030 (%)

9.2 Comparison by Technology

Chart on Comparison by Technology
Data Table on Comparison by Technology

9.3 Knowledge graphs - Market size and forecast 2025-2030

Chart on Knowledge graphs - Market size and forecast 2025-2030 ($ million)
Data Table on Knowledge graphs - Market size and forecast 2025-2030 ($ million)
Chart on Knowledge graphs - Year-over-year growth 2025-2030 (%)
Data Table on Knowledge graphs - Year-over-year growth 2025-2030 (%)

9.4 Resource description framework - Market size and forecast 2025-2030

Chart on Resource description framework - Market size and forecast 2025-2030 ($ million)
Data Table on Resource description framework - Market size and forecast 2025-2030 ($ million)
Chart on Resource description framework - Year-over-year growth 2025-2030 (%)
Data Table on Resource description framework - Year-over-year growth 2025-2030 (%)

9.5 Web ontology language - Market size and forecast 2025-2030

Chart on Web ontology language - Market size and forecast 2025-2030 ($ million)
Data Table on Web ontology language - Market size and forecast 2025-2030 ($ million)
Chart on Web ontology language - Year-over-year growth 2025-2030 (%)
Data Table on Web ontology language - Year-over-year growth 2025-2030 (%)

9.6 SPARQL and query technologies - Market size and forecast 2025-2030

Chart on SPARQL and query technologies - Market size and forecast 2025-2030 ($ million)
Data Table on SPARQL and query technologies - Market size and forecast 2025-2030 ($ million)
Chart on SPARQL and query technologies - Year-over-year growth 2025-2030 (%)
Data Table on SPARQL and query technologies - Year-over-year growth 2025-2030 (%)

9.7 Others - Market size and forecast 2025-2030

Chart on Others - Market size and forecast 2025-2030 ($ million)
Data Table on Others - Market size and forecast 2025-2030 ($ million)
Chart on Others - Year-over-year growth 2025-2030 (%)
Data Table on Others - Year-over-year growth 2025-2030 (%)

9.8 Market opportunity by Technology

Market opportunity by Technology ($ million)
Data Table on Market opportunity by Technology ($ million)

10. Market Segmentation by Deployment

10.1 Market segments

Chart on Deployment - Market share 2025-2030 (%)
Data Table on Deployment - Market share 2025-2030 (%)

10.2 Comparison by Deployment

Chart on Comparison by Deployment
Data Table on Comparison by Deployment

10.3 Cloud-based - Market size and forecast 2025-2030

Chart on Cloud-based - Market size and forecast 2025-2030 ($ million)
Data Table on Cloud-based - Market size and forecast 2025-2030 ($ million)
Chart on Cloud-based - Year-over-year growth 2025-2030 (%)
Data Table on Cloud-based - Year-over-year growth 2025-2030 (%)

10.4 On-premises - Market size and forecast 2025-2030

Chart on On-premises - Market size and forecast 2025-2030 ($ million)
Data Table on On-premises - Market size and forecast 2025-2030 ($ million)
Chart on On-premises - Year-over-year growth 2025-2030 (%)
Data Table on On-premises - Year-over-year growth 2025-2030 (%)

10.5 Hybrid - Market size and forecast 2025-2030

Chart on Hybrid - Market size and forecast 2025-2030 ($ million)
Data Table on Hybrid - Market size and forecast 2025-2030 ($ million)
Chart on Hybrid - Year-over-year growth 2025-2030 (%)
Data Table on Hybrid - Year-over-year growth 2025-2030 (%)

10.6 Market opportunity by Deployment

Market opportunity by Deployment ($ million)
Data Table on Market opportunity by Deployment ($ million)

11. Customer Landscape

11.1 Customer landscape overview

Analysis of price sensitivity, lifecycle, customer purchase basket, adoption rates, and purchase criteria

12. Geographic Landscape

12.1 Geographic segmentation

Chart on Market share by geography 2025-2030 (%)
Data Table on Market share by geography 2025-2030 (%)

12.2 Geographic comparison

Chart on Geographic comparison
Data Table on Geographic comparison

12.3 North America - Market size and forecast 2025-2030

Chart on North America - Market size and forecast 2025-2030 ($ million)
Data Table on North America - Market size and forecast 2025-2030 ($ million)
Chart on North America - Year-over-year growth 2025-2030 (%)
Data Table on North America - Year-over-year growth 2025-2030 (%)
Chart on Regional Comparison - North America
Data Table on Regional Comparison - North America

12.3.1 US - Market size and forecast 2025-2030

Chart on US - Market size and forecast 2025-2030 ($ million)
Data Table on US - Market size and forecast 2025-2030 ($ million)
Chart on US - Year-over-year growth 2025-2030 (%)
Data Table on US - Year-over-year growth 2025-2030 (%)

12.3.2 Canada - Market size and forecast 2025-2030

Chart on Canada - Market size and forecast 2025-2030 ($ million)
Data Table on Canada - Market size and forecast 2025-2030 ($ million)
Chart on Canada - Year-over-year growth 2025-2030 (%)
Data Table on Canada - Year-over-year growth 2025-2030 (%)

12.3.3 Mexico - Market size and forecast 2025-2030

Chart on Mexico - Market size and forecast 2025-2030 ($ million)
Data Table on Mexico - Market size and forecast 2025-2030 ($ million)
Chart on Mexico - Year-over-year growth 2025-2030 (%)
Data Table on Mexico - Year-over-year growth 2025-2030 (%)

12.4 Europe - Market size and forecast 2025-2030

Chart on Europe - Market size and forecast 2025-2030 ($ million)
Data Table on Europe - Market size and forecast 2025-2030 ($ million)
Chart on Europe - Year-over-year growth 2025-2030 (%)
Data Table on Europe - Year-over-year growth 2025-2030 (%)
Chart on Regional Comparison - Europe
Data Table on Regional Comparison - Europe

12.4.1 Germany - Market size and forecast 2025-2030

Chart on Germany - Market size and forecast 2025-2030 ($ million)
Data Table on Germany - Market size and forecast 2025-2030 ($ million)
Chart on Germany - Year-over-year growth 2025-2030 (%)
Data Table on Germany - Year-over-year growth 2025-2030 (%)

12.4.2 UK - Market size and forecast 2025-2030

Chart on UK - Market size and forecast 2025-2030 ($ million)
Data Table on UK - Market size and forecast 2025-2030 ($ million)
Chart on UK - Year-over-year growth 2025-2030 (%)
Data Table on UK - Year-over-year growth 2025-2030 (%)

12.4.3 France - Market size and forecast 2025-2030

Chart on France - Market size and forecast 2025-2030 ($ million)
Data Table on France - Market size and forecast 2025-2030 ($ million)
Chart on France - Year-over-year growth 2025-2030 (%)
Data Table on France - Year-over-year growth 2025-2030 (%)

12.4.4 Italy - Market size and forecast 2025-2030

Chart on Italy - Market size and forecast 2025-2030 ($ million)
Data Table on Italy - Market size and forecast 2025-2030 ($ million)
Chart on Italy - Year-over-year growth 2025-2030 (%)
Data Table on Italy - Year-over-year growth 2025-2030 (%)

12.4.5 Spain - Market size and forecast 2025-2030

Chart on Spain - Market size and forecast 2025-2030 ($ million)
Data Table on Spain - Market size and forecast 2025-2030 ($ million)
Chart on Spain - Year-over-year growth 2025-2030 (%)
Data Table on Spain - Year-over-year growth 2025-2030 (%)

12.4.6 The Netherlands - Market size and forecast 2025-2030

Chart on The Netherlands - Market size and forecast 2025-2030 ($ million)
Data Table on The Netherlands - Market size and forecast 2025-2030 ($ million)
Chart on The Netherlands - Year-over-year growth 2025-2030 (%)
Data Table on The Netherlands - Year-over-year growth 2025-2030 (%)

12.5 APAC - Market size and forecast 2025-2030

Chart on APAC - Market size and forecast 2025-2030 ($ million)
Data Table on APAC - Market size and forecast 2025-2030 ($ million)
Chart on APAC - Year-over-year growth 2025-2030 (%)
Data Table on APAC - Year-over-year growth 2025-2030 (%)
Chart on Regional Comparison - APAC
Data Table on Regional Comparison - APAC

12.5.1 China - Market size and forecast 2025-2030

Chart on China - Market size and forecast 2025-2030 ($ million)
Data Table on China - Market size and forecast 2025-2030 ($ million)
Chart on China - Year-over-year growth 2025-2030 (%)
Data Table on China - Year-over-year growth 2025-2030 (%)

12.5.2 India - Market size and forecast 2025-2030

Chart on India - Market size and forecast 2025-2030 ($ million)
Data Table on India - Market size and forecast 2025-2030 ($ million)
Chart on India - Year-over-year growth 2025-2030 (%)
Data Table on India - Year-over-year growth 2025-2030 (%)

12.5.3 Japan - Market size and forecast 2025-2030

Chart on Japan - Market size and forecast 2025-2030 ($ million)
Data Table on Japan - Market size and forecast 2025-2030 ($ million)
Chart on Japan - Year-over-year growth 2025-2030 (%)
Data Table on Japan - Year-over-year growth 2025-2030 (%)

12.5.4 South Korea - Market size and forecast 2025-2030

Chart on South Korea - Market size and forecast 2025-2030 ($ million)
Data Table on South Korea - Market size and forecast 2025-2030 ($ million)
Chart on South Korea - Year-over-year growth 2025-2030 (%)
Data Table on South Korea - Year-over-year growth 2025-2030 (%)

12.5.5 Australia - Market size and forecast 2025-2030

Chart on Australia - Market size and forecast 2025-2030 ($ million)
Data Table on Australia - Market size and forecast 2025-2030 ($ million)
Chart on Australia - Year-over-year growth 2025-2030 (%)
Data Table on Australia - Year-over-year growth 2025-2030 (%)

12.5.6 Indonesia - Market size and forecast 2025-2030

Chart on Indonesia - Market size and forecast 2025-2030 ($ million)
Data Table on Indonesia - Market size and forecast 2025-2030 ($ million)
Chart on Indonesia - Year-over-year growth 2025-2030 (%)
Data Table on Indonesia - Year-over-year growth 2025-2030 (%)

12.6 Middle East and Africa - Market size and forecast 2025-2030

Chart on Middle East and Africa - Market size and forecast 2025-2030 ($ million)
Data Table on Middle East and Africa - Market size and forecast 2025-2030 ($ million)
Chart on Middle East and Africa - Year-over-year growth 2025-2030 (%)
Data Table on Middle East and Africa - Year-over-year growth 2025-2030 (%)
Chart on Regional Comparison - Middle East and Africa
Data Table on Regional Comparison - Middle East and Africa

12.6.1 Saudi Arabia - Market size and forecast 2025-2030

Chart on Saudi Arabia - Market size and forecast 2025-2030 ($ million)
Data Table on Saudi Arabia - Market size and forecast 2025-2030 ($ million)
Chart on Saudi Arabia - Year-over-year growth 2025-2030 (%)
Data Table on Saudi Arabia - Year-over-year growth 2025-2030 (%)

12.6.2 UAE - Market size and forecast 2025-2030

Chart on UAE - Market size and forecast 2025-2030 ($ million)
Data Table on UAE - Market size and forecast 2025-2030 ($ million)
Chart on UAE - Year-over-year growth 2025-2030 (%)
Data Table on UAE - Year-over-year growth 2025-2030 (%)

12.6.3 South Africa - Market size and forecast 2025-2030

Chart on South Africa - Market size and forecast 2025-2030 ($ million)
Data Table on South Africa - Market size and forecast 2025-2030 ($ million)
Chart on South Africa - Year-over-year growth 2025-2030 (%)
Data Table on South Africa - Year-over-year growth 2025-2030 (%)

12.6.4 Israel - Market size and forecast 2025-2030

Chart on Israel - Market size and forecast 2025-2030 ($ million)
Data Table on Israel - Market size and forecast 2025-2030 ($ million)
Chart on Israel - Year-over-year growth 2025-2030 (%)
Data Table on Israel - Year-over-year growth 2025-2030 (%)

12.6.5 Turkey - Market size and forecast 2025-2030

Chart on Turkey - Market size and forecast 2025-2030 ($ million)
Data Table on Turkey - Market size and forecast 2025-2030 ($ million)
Chart on Turkey - Year-over-year growth 2025-2030 (%)
Data Table on Turkey - Year-over-year growth 2025-2030 (%)

12.7 South America - Market size and forecast 2025-2030

Chart on South America - Market size and forecast 2025-2030 ($ million)
Data Table on South America - Market size and forecast 2025-2030 ($ million)
Chart on South America - Year-over-year growth 2025-2030 (%)
Data Table on South America - Year-over-year growth 2025-2030 (%)
Chart on Regional Comparison - South America
Data Table on Regional Comparison - South America

12.7.1 Brazil - Market size and forecast 2025-2030

Chart on Brazil - Market size and forecast 2025-2030 ($ million)
Data Table on Brazil - Market size and forecast 2025-2030 ($ million)
Chart on Brazil - Year-over-year growth 2025-2030 (%)
Data Table on Brazil - Year-over-year growth 2025-2030 (%)

12.7.2 Argentina - Market size and forecast 2025-2030

Chart on Argentina - Market size and forecast 2025-2030 ($ million)
Data Table on Argentina - Market size and forecast 2025-2030 ($ million)
Chart on Argentina - Year-over-year growth 2025-2030 (%)
Data Table on Argentina - Year-over-year growth 2025-2030 (%)

12.7.3 Chile - Market size and forecast 2025-2030

Chart on Chile - Market size and forecast 2025-2030 ($ million)
Data Table on Chile - Market size and forecast 2025-2030 ($ million)
Chart on Chile - Year-over-year growth 2025-2030 (%)
Data Table on Chile - Year-over-year growth 2025-2030 (%)

12.8 Market opportunity by geography

Market opportunity by geography ($ million)
Data Tables on Market opportunity by geography ($ million)

13. Drivers, Challenges, and Opportunity

13.1 Market drivers

Imperative role of knowledge graphs in sustaining enterprise AI ecosystems
Accelerating biomedical research and patient care through enhanced semantic interoperability
Driving operational efficiency in global supply chains through semantic metadata standards

13.2 Market challenges

Structural complexity and high technical barrier of ontology engineering
Significant deficit of specialized expertise and high implementation expenditures
Heightened data security concerns and risk of sophisticated privacy breaches

13.3 Impact of drivers and challenges

Impact of drivers and challenges in 2025 and 2030

13.4 Market opportunities

Convergence of generative AI and knowledge graphs
Expansion of decentralized web architectures and data sovereignty
Adoption of semantic metadata for global sustainability and supply chain transparency

14. Competitive Landscape

14.1 Overview

14.2

Overview on criticality of inputs and factors of differentiation

14.3 Landscape disruption

Overview on factors of disruption

14.4 Industry risks

Impact of key risks on business

15. Competitive Analysis

15.1 Companies profiled

Companies covered

15.2 Company ranking index

15.3 Market positioning of companies

Matrix on companies position and classification

15.4 Amazon Web Services Inc.

Amazon Web Services Inc. - Overview
Amazon Web Services Inc. - Product / Service
Amazon Web Services Inc. - Key offerings
SWOT

15.5 Cambridge Semantics Inc.

Cambridge Semantics Inc. - Overview
Cambridge Semantics Inc. - Product / Service
Cambridge Semantics Inc. - Key offerings
SWOT

15.6 Diffbot Technologies Corp.

Diffbot Technologies Corp. - Overview
Diffbot Technologies Corp. - Product / Service
Diffbot Technologies Corp. - Key offerings
SWOT

15.7 eccenca GmbH

eccenca GmbH - Overview
eccenca GmbH - Product / Service
eccenca GmbH - Key offerings
SWOT

15.8 Expert AI S.p.A.

Expert AI S.p.A. - Overview
Expert AI S.p.A. - Product / Service
Expert AI S.p.A. - Key offerings
SWOT

15.9 Fluree PBC

Fluree PBC - Overview
Fluree PBC - Product / Service
Fluree PBC - Key offerings
SWOT

15.10 Franz Inc.

Franz Inc. - Overview
Franz Inc. - Product / Service
Franz Inc. - Key offerings
SWOT

15.11 metaphacts GmbH

metaphacts GmbH - Overview
metaphacts GmbH - Product / Service
metaphacts GmbH - Key offerings
SWOT

15.12 Mindbreeze GmbH

Mindbreeze GmbH - Overview
Mindbreeze GmbH - Product / Service
Mindbreeze GmbH - Key offerings
SWOT

15.13 Neo4j Inc.

Neo4j Inc. - Overview
Neo4j Inc. - Product / Service
Neo4j Inc. - Key offerings
SWOT

15.14 Ontopic S.r.l.

Ontopic S.r.l. - Overview
Ontopic S.r.l. - Product / Service
Ontopic S.r.l. - Key offerings
SWOT

15.15 Ontotext Inc.

Ontotext Inc. - Overview
Ontotext Inc. - Product / Service
Ontotext Inc. - Key offerings
SWOT

15.16 Progress Software Corp.

Progress Software Corp. - Overview
Progress Software Corp. - Product / Service
Progress Software Corp. - Key offerings
SWOT

15.17 Sinequa

Sinequa - Overview
Sinequa - Product / Service
Sinequa - Key offerings
SWOT

15.18 Siren Analytics Ltd.

Siren Analytics Ltd. - Overview
Siren Analytics Ltd. - Product / Service
Siren Analytics Ltd. - Key offerings
SWOT

16. Appendix

16.1 Scope of the report

Market definition
Objectives
Notes and caveats

16.2 Inclusions and exclusions checklist

Inclusions checklist
Exclusions checklist

16.3 Currency conversion rates for US$

16.4 Research methodology

16.5 Data procurement

Information sources

16.6 Data validation

16.7 Validation techniques employed for market sizing

16.8 Data synthesis

16.9 360 degree market analysis

16.10 List of abbreviations

Research Methodology

Technavio presents a detailed picture of the market by way of study, synthesis, and summation of data from multiple sources. The analysts have presented the various facets of the market with a particular focus on identifying the key industry influencers. The data thus presented is comprehensive, reliable, and the result of extensive research, both primary and secondary.

INFORMATION SOURCES

Primary sources

  • Manufacturers and suppliers
  • Channel partners
  • Industry experts
  • Strategic decision makers

Secondary sources

  • Industry journals and periodicals
  • Government data
  • Financial reports of key industry players
  • Historical data
  • Press releases

DATA ANALYSIS

Data Synthesis

  • Collation of data
  • Estimation of key figures
  • Analysis of derived insights

Data Validation

  • Triangulation with data models
  • Reference against proprietary databases
  • Corroboration with industry experts

REPORT WRITING

Qualitative

  • Market drivers
  • Market challenges
  • Market trends
  • Five forces analysis

Quantitative

  • Market size and forecast
  • Market segmentation
  • Geographical insights
  • Competitive landscape

Interested in this report?

Get your sample now to see our research methodology and insights!

Download Now

Frequently Asked Questions

Semantic Web market growth will increase by USD 5977.9 million during 2026-2030.

The Semantic Web market is expected to grow at a CAGR of 23.5% during 2026-2030.

Semantic Web market is segmented by Component (Software, Services) Technology (Knowledge graphs, Resource description framework, Web ontology language, SPARQL and query technologies, Others) Deployment (Cloud-based, On-premises, Hybrid)

Amazon Web Services Inc., Cambridge Semantics Inc., Diffbot Technologies Corp., eccenca GmbH, Expert AI S.p.A., Fluree PBC, Franz Inc., metaphacts GmbH, Mindbreeze GmbH, Neo4j Inc., Ontopic S.r.l., Ontotext Inc., Progress Software Corp., Sinequa, Siren Analytics Ltd., Squirro AG, Stardog Union Inc., Synaptica LLC, TopQuadrant Inc., YSEOP are a few of the key vendors in the Semantic Web market.

North America will register the highest growth rate of 41.2% among the other regions. Therefore, the Semantic Web market in North America is expected to garner significant business opportunities for the vendors during the forecast period.

US, Canada, Mexico, Germany, UK, France, Italy, Spain, The Netherlands, China, India, Japan, South Korea, Australia, Indonesia, Saudi Arabia, UAE, South Africa, Israel, Turkey, Brazil, Argentina, Chile

  • Imperative role of knowledge graphs in sustaining enterprise AI ecosystems is the driving factor this market.

The Semantic Web market vendors should focus on grabbing business opportunities from the Component segment as it accounted for the largest market share in the base year.
RIA - Research AI Assistant
Ask RIA