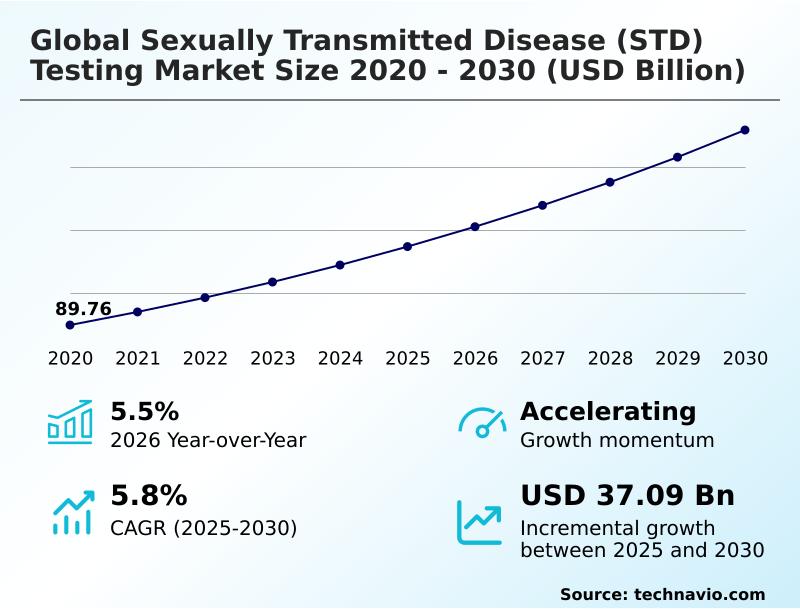
Sexually Transmitted Disease (STD) Testing Market Size 2026-2030
The sexually transmitted disease (std) testing market size is valued to increase by USD 37.09 billion, at a CAGR of 5.8% from 2025 to 2030. Rising global incidence of sexually transmitted infections will drive the sexually transmitted disease (std) testing market.
Major Market Trends & Insights
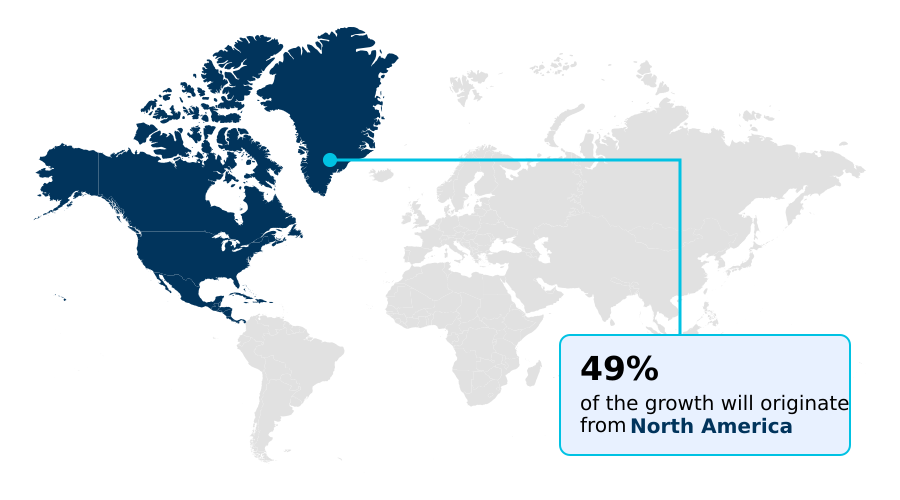
- North America dominated the market and accounted for a 49.4% growth during the forecast period.
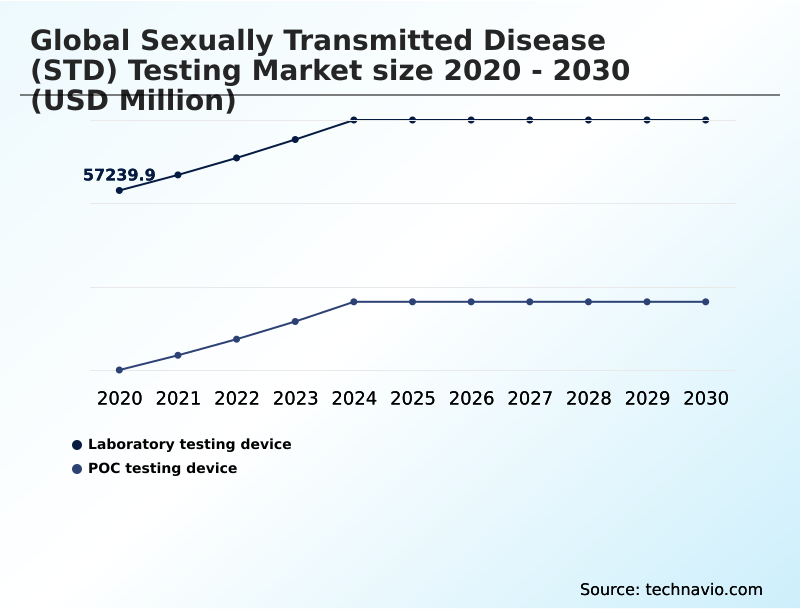
- By Product - Laboratory testing device segment was valued at USD 66.94 billion in 2024
- By Disease Type - Chlamydia segment accounted for the largest market revenue share in 2024
Market Size & Forecast
- Market Opportunities: USD 62.05 billion
- Market Future Opportunities: USD 37.09 billion
- CAGR from 2025 to 2030 : 5.8%
Market Summary
- The sexually transmitted disease (STD) testing market is undergoing a significant transformation, moving beyond traditional clinical settings to embrace decentralized, patient-centric models. This evolution is driven by technological advancements in point-of-care molecular diagnostics and the growing acceptance of at-home sample collection, which together address issues of privacy and access.
- A key trend is the development of syndromic panel testing, allowing for the simultaneous detection of multiple pathogens from a single sample. For instance, a women's sexual health test can now differentiate between infections with similar symptoms in one visit, enabling a precise test-and-treat strategy that was previously unachievable. This improves clinical outcomes and operational efficiency within healthcare systems.
- However, the industry faces challenges from complex laboratory-developed tests regulation and the persistent threat of antimicrobial resistance profiling, which demands more sophisticated diagnostic tools.
- The integration of these advanced diagnostics into digital health platforms is critical for managing public health, ensuring that test results are linked to timely care and follow-up, thereby breaking chains of transmission and supporting broad infectious disease detection efforts.
What will be the Size of the Sexually Transmitted Disease (STD) Testing Market during the forecast period?
Get Key Insights on Market Forecast (PDF) Get Free Sample
How is the Sexually Transmitted Disease (STD) Testing Market Segmented?
The sexually transmitted disease (std) testing industry research report provides comprehensive data (region-wise segment analysis), with forecasts and estimates in "USD million" for the period 2026-2030, as well as historical data from 2020-2024 for the following segments.
- Product
- Laboratory testing device
- POC testing device
- Disease type
- Chlamydia
- Gonorrhea
- Syphilis
- Trichomoniasis
- Others
- Technology
- Molecular diagnostics
- Immunoassay
- Others
- Geography
- North America
- US
- Canada
- Mexico
- Europe
- Germany
- UK
- France
- Asia
- Rest of World (ROW)
- North America
By Product Insights
The laboratory testing device segment is estimated to witness significant growth during the forecast period.
The laboratory testing device segment remains the cornerstone of the market, defined by high-throughput screening systems engineered for mass sample processing. These platforms are essential for public health screening programs, offering unparalleled economies of scale.
Advancements focus on automation, with integrated delivery networks reporting a 25% reduction in manual errors through the adoption of automated test systems. This evolution supports both centralized labs and the processing of self-collection specimen kits from decentralized diagnostic models.
The precision of a chemiluminescent immunoassay and an enzyme-linked immunosorbent assay on these devices provides critical clinical validity evidence.
Furthermore, the use of unique device identification systems ensures traceability, while next-generation phenotyping capabilities enhance diagnostic depth for various urogenital pathogen identification tasks, including targeted molecular assays and pcr-based solutions.
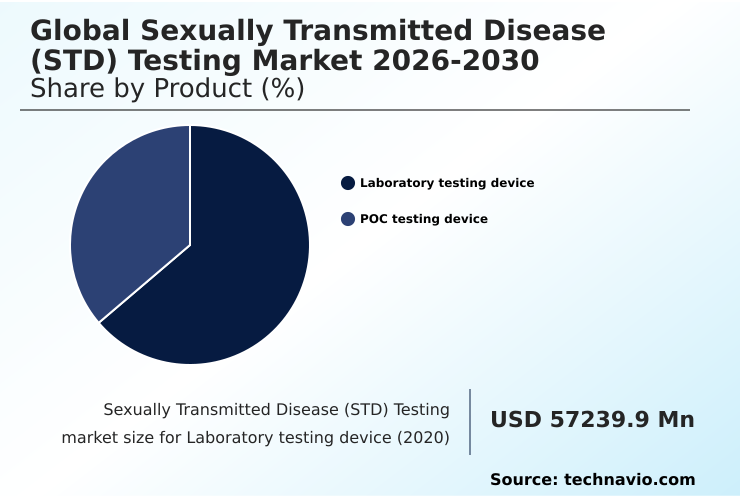
The Laboratory testing device segment was valued at USD 66.94 billion in 2024 and showed a gradual increase during the forecast period.
Regional Analysis
North America is estimated to contribute 49.4% to the growth of the global market during the forecast period.Technavio’s analysts have elaborately explained the regional trends and drivers that shape the market during the forecast period.
See How Sexually Transmitted Disease (STD) Testing Market Demand is Rising in North America Get Free Sample
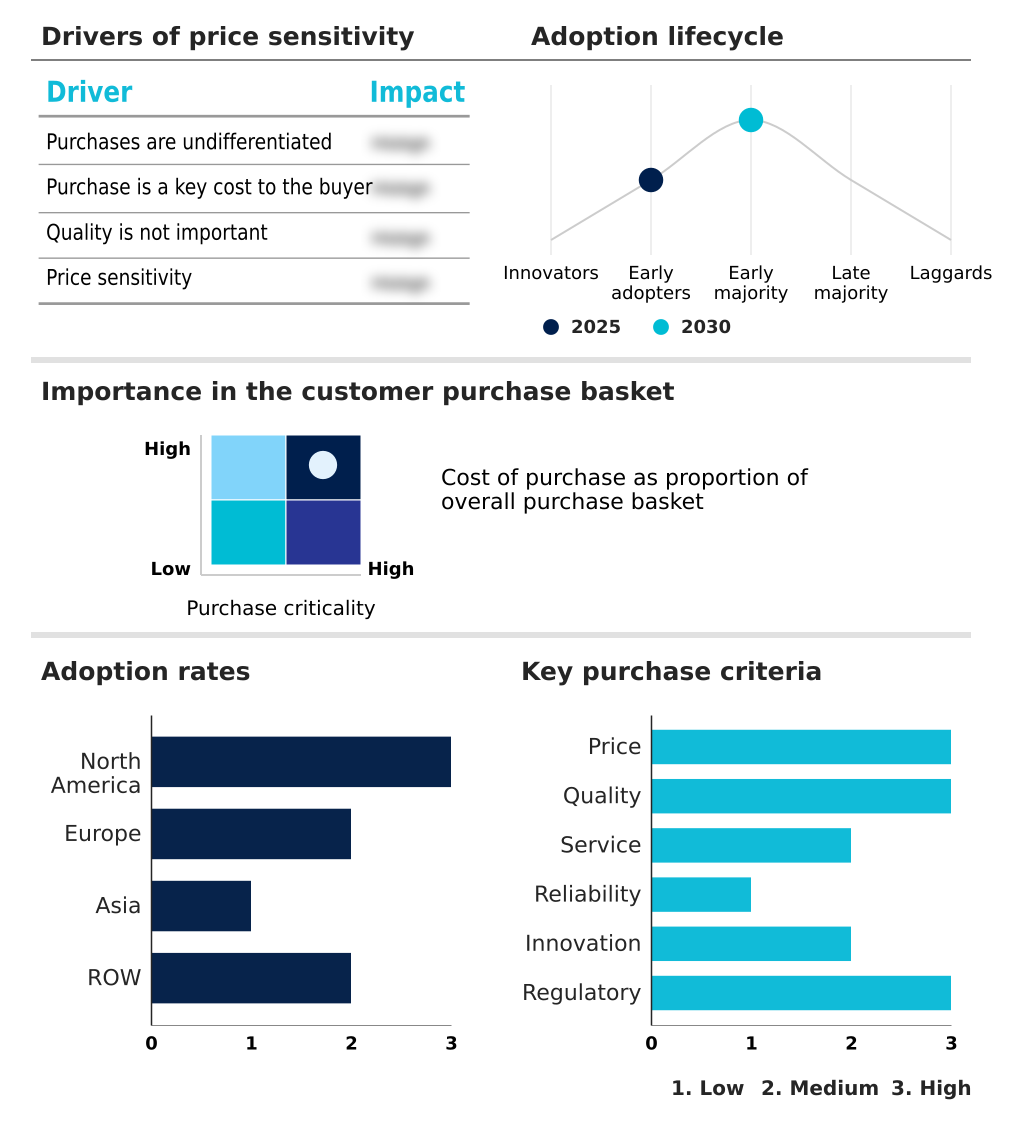
The geographic landscape is characterized by diverse adoption rates. North America leads in deploying high-complexity molecular testing and at-home sample collection, where automated serology assays have increased testing throughput by 60%.
Europe is driven by government-funded public health screening programs that mandate robust serological testing algorithms and syndromic panel testing. In Asia, a burgeoning middle class fuels private healthcare growth, showing a 50% increase in uptake for services utilizing self-sampling solutions.
Across all regions, the market is shifting toward decentralization, leveraging rapid antigen and molecular assays on POC testing devices to move diagnostics closer to the patient.
This strategy supports the identification of viral and bacterial STI markers and other pathogen genetic material, addressing both clinical needs and consumer preferences.
Market Dynamics
Our researchers analyzed the data with 2025 as the base year, along with the key drivers, trends, and challenges. A holistic analysis of drivers will help companies refine their marketing strategies to gain a competitive advantage.
- The trajectory of the Global Sexually Transmitted Disease (STD) Testing Market 2026-2030 depends on navigating a complex interplay of technology and public health needs. A primary concern is the impact of antimicrobial resistance on STD testing, pushing for diagnostic solutions for multidrug-resistant gonorrhea.
- The expanding role of direct-to-consumer STD testing, facilitated by improving STD screening with self-collection kits, addresses privacy concerns. The future of over-the-counter STD diagnostics hinges on miniaturized molecular platforms. However, this progress is moderated by regulatory challenges for laboratory developed tests. The debate over molecular vs.
- immunoassay for STD detection continues, though advancements in point-of-care STD diagnostics are closing the gap. These are vital for effective testing protocols for doxycycline post-exposure prophylaxis. The efficiency of high-throughput systems for STD screening is often limited by fragmented public health infrastructure for STD testing.
- For instance, automation trends in STD testing laboratories can accelerate reporting by over 50%, yet system-level gaps still lead to challenges in preventing congenital syphilis. The integration of STD testing in digital health is key to linking diagnosis to care.
- This ecosystem must support syndromic panels for vaginal health diagnosis, assays for differentiating HSV-1 and HSV-2, and strategies for combating diagnostic escape in gonorrhea testing. Technological advancements in molecular diagnostics for STDs, the growth of decentralized diagnostics in STD testing, and the impact of prophylactic protocols on STD surveillance will define the market's future.
What are the key market drivers leading to the rise in the adoption of Sexually Transmitted Disease (STD) Testing Industry?
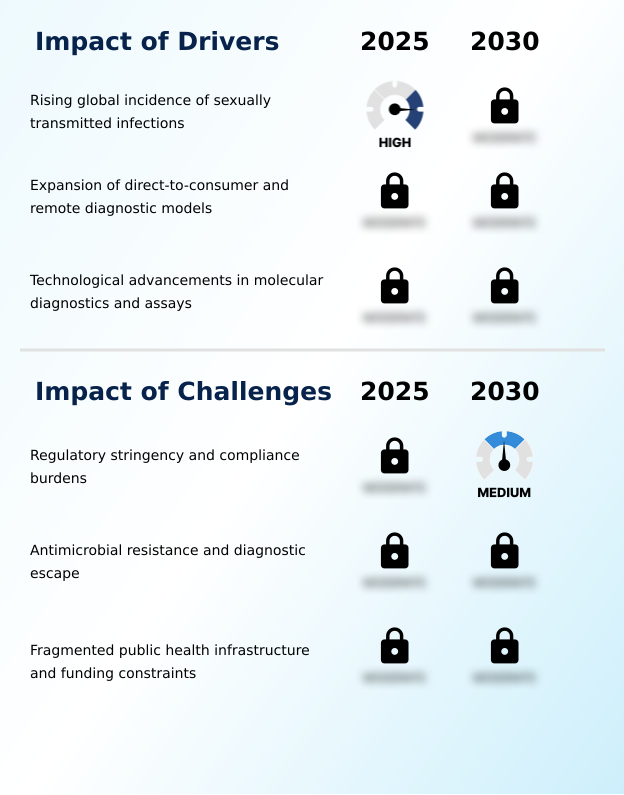
- The primary driver for the sexually transmitted disease testing market is the rising global incidence of infections, which necessitates expanded screening and aggressive public health interventions.
- Market expansion is fueled by direct-to-consumer testing platforms, which democratize access. These digital health platforms improve screening compliance by 35%.
- This trend is complemented by the evolution of molecular point-of-care solutions and rapid point-of-care pcr tests, which enhance sensitivity for chlamydia trachomatis detection. The move away from subjective culture-based methods toward definitive nucleic acid amplification tests provides superior insights.
- These advancements allow for the consolidation of tests, such as a multiplex vaginal panel for bacterial vaginosis detection on a single poc testing device, improving lab efficiency by over 40%.
- The development of mRNA-based viral detection and comprehensive sti screening tools further drives market growth by offering higher-value diagnostics and supporting a broader test-and-treat strategy.
What are the market trends shaping the Sexually Transmitted Disease (STD) Testing Industry?
- The market is witnessing a transformative trend with the emergence of true over-the-counter molecular diagnostics. This represents a significant leap from mail-in kits to integrated, handheld devices delivering PCR-quality results at home.
- The emergence of over-the-counter molecular diagnostics is reshaping patient-centric care, with miniaturized pcr technology enabling fast detection of chlamydia in under 30 minutes, a 90% reduction in turnaround time. This shift empowers consumers with a women sexual health test and other end-to-end solutions, including self-sampling solutions. Simultaneously, prophylactic surveillance protocols, driven by doxycycline post-exposure prophylaxis, are creating sustained demand.
- This includes blood screening assays and viral sti screening to monitor for breakthrough infections and antimicrobial resistance profiling. These trends are supported by advanced naat platforms and remote diagnostic logistics, which improve access. In some programs, this approach has led to a 40% increase in screening uptake, validating the integration of these models.
What challenges does the Sexually Transmitted Disease (STD) Testing Industry face during its growth?
- Increasingly stringent regulations and the high costs associated with compliance present a significant challenge, potentially slowing innovation and market access for new diagnostic tests.
- Navigating new laboratory-developed tests regulation is a primary challenge, increasing compliance burdens and potentially delaying broad infectious disease detection capabilities by up to 18 months. Another hurdle is diagnostic escape mutations, causing false negatives in tests like the neisseria gonorrhoeae assay. This reality forces updates to in-vitro diagnostic products and molecular and immunodiagnostic tools.
- The lack of platforms for antimicrobial resistance profiling complicates treatment. Fragmented infrastructure also limits the effectiveness of even the best quality controls and immunoassays and methods for hiv and syphilis detection. This is highlighted by failures in congenital syphilis prevention despite available technology, indicating a systemic breakdown where diagnostic information services are not effectively utilized.
Exclusive Technavio Analysis on Customer Landscape
The sexually transmitted disease (std) testing market forecasting report includes the adoption lifecycle of the market, covering from the innovator’s stage to the laggard’s stage. It focuses on adoption rates in different regions based on penetration. Furthermore, the sexually transmitted disease (std) testing market report also includes key purchase criteria and drivers of price sensitivity to help companies evaluate and develop their market growth analysis strategies.
Customer Landscape of Sexually Transmitted Disease (STD) Testing Industry
Competitive Landscape
Companies are implementing various strategies, such as strategic alliances, sexually transmitted disease (std) testing market forecast, partnerships, mergers and acquisitions, geographical expansion, and product/service launches, to enhance their presence in the industry.
Abbott Laboratories - Delivers a portfolio of rapid antigen and molecular assays designed for the accurate and efficient detection of common sexually transmitted infections to support clinical diagnostic needs.
The industry research and growth report includes detailed analyses of the competitive landscape of the market and information about key companies, including:
- Abbott Laboratories
- Beckman Coulter Inc.
- Becton Dickinson and Co.
- Bio Rad Laboratories Inc.
- BioMerieux SA
- Cepheid Inc.
- F. Hoffmann La Roche Ltd.
- Grifols SA
- Hologic Inc.
- Luminex Corp.
- Meridian Bioscience Inc.
- OraSure Technologies Inc.
- PerkinElmer US LLC
- Quest Diagnostics Inc.
- QuidelOrtho Corp.
- Sekisui Diagnostics LLC
- Siemens Healthineers AG
- Thermo Fisher Scientific Inc.
Qualitative and quantitative analysis of companies has been conducted to help clients understand the wider business environment as well as the strengths and weaknesses of key industry players. Data is qualitatively analyzed to categorize companies as pure play, category-focused, industry-focused, and diversified; it is quantitatively analyzed to categorize companies as dominant, leading, strong, tentative, and weak.
Recent Development and News in Sexually transmitted disease (std) testing market
- In March, 2025, Visby Medical received marketing authorization from the US FDA for its OTC Women's Sexual Health Test, the first PCR-quality molecular diagnostic for chlamydia, gonorrhea, and trichomoniasis performable entirely at home.
- In January, 2025, a report on Ireland's Health Service Executive highlighted a significant surge in demand for its free home STI testing service, prompting increased government funding to expand the program's capacity.
- In November, 2024, Australia's Therapeutic Goods Administration approved Touch Biotechnology's rapid self-test for chlamydia and gonorrhea, marking the country's first approval for a lateral flow assay usable by consumers at home.
- In September, 2024, the French government expanded its 'Mon test IST' program, providing free, prescription-less screening for chlamydia, gonorrhea, syphilis, and hepatitis B to all individuals under 26 at medical laboratories.
Dive into Technavio’s robust research methodology, blending expert interviews, extensive data synthesis, and validated models for unparalleled Sexually Transmitted Disease (STD) Testing Market insights. See full methodology.
| Market Scope | |
|---|---|
| Page number | 300 |
| Base year | 2025 |
| Historic period | 2020-2024 |
| Forecast period | 2026-2030 |
| Growth momentum & CAGR | Accelerate at a CAGR of 5.8% |
| Market growth 2026-2030 | USD 37093.0 million |
| Market structure | Fragmented |
| YoY growth 2025-2026(%) | 5.5% |
| Key countries | US, Canada, Mexico, Germany, UK, France, Italy, Spain, The Netherlands, China, Japan, India, South Korea, Indonesia, Thailand, Brazil, South Africa, Australia, Argentina, Saudi Arabia, UAE, Colombia and Nigeria |
| Competitive landscape | Leading Companies, Market Positioning of Companies, Competitive Strategies, and Industry Risks |
Research Analyst Overview
- The sexually transmitted disease testing market's evolution is defined by a strategic shift towards decentralization and automation. Core to this is the advancement of point-of-care molecular diagnostics, which bring the accuracy of nucleic acid amplification tests directly to clinical settings.
- This trend directly impacts boardroom strategy, as investment in high-throughput screening systems and automated serology assays is now critical for maintaining competitive laboratory services. For example, labs adopting these systems have achieved a 35% improvement in sample processing capacity. The market is also shaped by the expansion of direct-to-consumer testing platforms, which leverage self-collection specimen kits to broaden patient access.
- Concurrently, the industry is innovating with technologies like mRNA-based viral detection and syndromic panel testing. However, progress is tempered by challenges such as diagnostic escape mutations and stringent laboratory-developed tests regulation, which require ongoing R&D investment and careful navigation of compliance pathways to ensure continued access to effective diagnostics.
What are the Key Data Covered in this Sexually Transmitted Disease (STD) Testing Market Research and Growth Report?
-
What is the expected growth of the Sexually Transmitted Disease (STD) Testing Market between 2026 and 2030?
-
USD 37.09 billion, at a CAGR of 5.8%
-
-
What segmentation does the market report cover?
-
The report is segmented by Product (Laboratory testing device, and POC testing device), Disease Type (Chlamydia, Gonorrhea, Syphilis, Trichomoniasis, and Others), Technology (Molecular diagnostics, Immunoassay, and Others) and Geography (North America, Europe, Asia, Rest of World (ROW))
-
-
Which regions are analyzed in the report?
-
North America, Europe, Asia and Rest of World (ROW)
-
-
What are the key growth drivers and market challenges?
-
Rising global incidence of sexually transmitted infections, Regulatory stringency and compliance burdens
-
-
Who are the major players in the Sexually Transmitted Disease (STD) Testing Market?
-
Abbott Laboratories, Beckman Coulter Inc., Becton Dickinson and Co., Bio Rad Laboratories Inc., BioMerieux SA, Cepheid Inc., F. Hoffmann La Roche Ltd., Grifols SA, Hologic Inc., Luminex Corp., Meridian Bioscience Inc., OraSure Technologies Inc., PerkinElmer US LLC, Quest Diagnostics Inc., QuidelOrtho Corp., Sekisui Diagnostics LLC, Siemens Healthineers AG and Thermo Fisher Scientific Inc.
-
Market Research Insights
- The dynamics of the sexually transmitted disease testing market are shaped by a push for greater accessibility and efficiency. The adoption of direct-to-consumer testing platforms has expanded market reach, with some services reporting a 40% increase in first-time testers.
- This is supported by innovations in POC testing devices, which reduce diagnostic turnaround times by over 80% compared to traditional lab methods, enabling an immediate test-and-treat strategy. The use of advanced NAAT platforms and multiplex molecular panels allows laboratories to consolidate workflows, improving operational efficiency.
- For example, integrated systems for viral STI screening can process samples with 30% less hands-on time. These technological shifts, coupled with supportive public health screening programs, are fundamentally changing how sexual health is managed, making diagnostics more immediate and patient-focused.
We can help! Our analysts can customize this sexually transmitted disease (std) testing market research report to meet your requirements.
 RIA -
RIA - 
