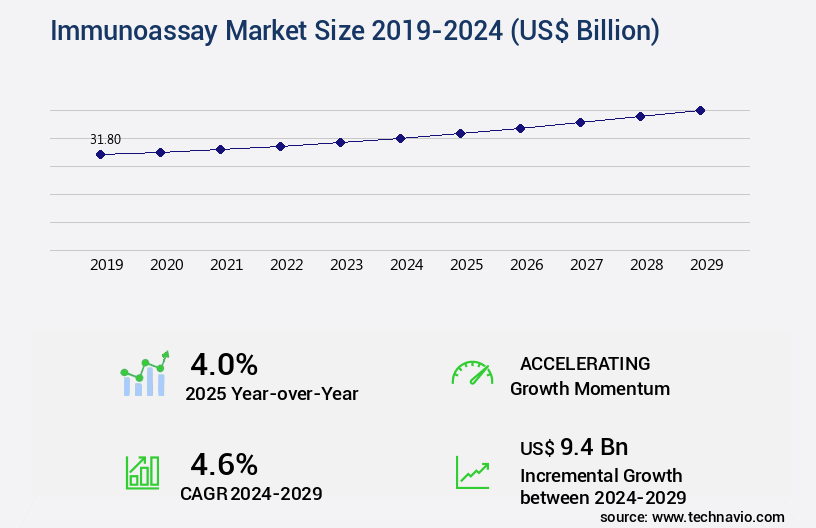
Immunoassay Market Size and Forecast 2025-2029
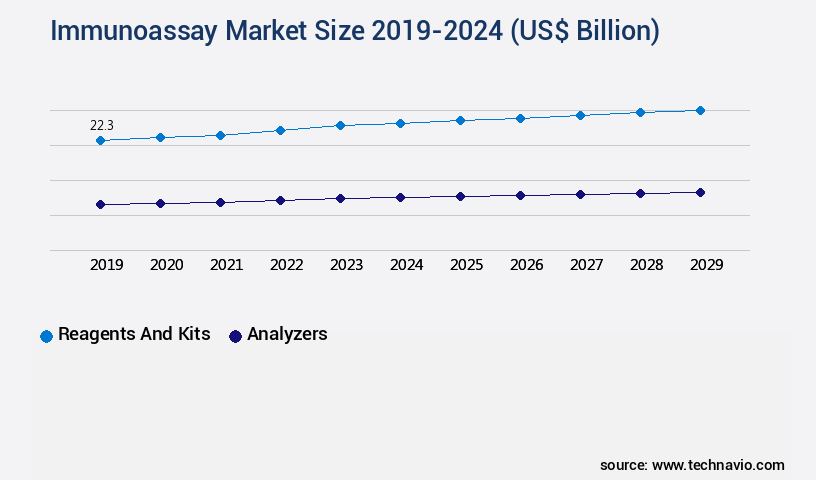
The immunoassay market size estimates the market to reach by USD 9.4 billion, at a CAGR of 4.6% between 2024 and 2029. North America is expected to account for 45% of the growth contribution to the global market during this period. In 2019 the reagents and kits segment was valued at USD 22.30 billion and has demonstrated steady growth since then.
- The immunoassay market is advancing steadily as demand for predictive and preventive medicine accelerates across sectors that rely on early detection and accurate diagnosis. Immunoassays play a central role in identifying critical biomarkers from biological samples such as blood and urine, establishing their importance in clinical diagnostics. Beyond healthcare, the technology's application in the food and beverage industry supports food safety testing and quality assurance protocols, reflecting the market's cross-sector versatility.
- Market participants are increasingly investing in automated and user-friendly testing platforms to streamline workflows and reduce reliance on specialized personnel. This push for innovation aligns with rising testing volumes and reinforces immunoassays as a foundational tool in diagnostics and quality control. A key challenge lies in the limited availability of skilled laboratory professionals, which continues to hinder operational efficiency amid growing demand. Addressing this shortage through automation and workforce development is essential. While the market's foundational capabilities remain strong, its future trajectory depends on overcoming these labor constraints while maintaining high diagnostic accuracy.
- The market is projected to expand steadily, driven by increasing test volumes and rising emphasis on rapid, reliable diagnostics. When comparing performance metrics, testing volumes and technological adoption rates reflect a consistent upward trend, whereas operational capacity faces constraints linked to workforce availability. This imbalance underscores the need for scalable, automated systems to meet expanding application needs without sacrificing reliability or throughput.
What will be the Size of the Immunoassay Market during the forecast period?

Acquire detailed market insights for investment and technology adoption on Immunoasssay Market Request Free Sample
- The global immunoassay market continues to expand as clinical diagnostics and research applications increasingly adopt advanced analytical protocols. Kinetic measurements and endpoint measurements are widely integrated into testing workflows to improve method performance, with diagnostic kits relying on enhanced calibration standards and strict incubation conditions to deliver consistent results. Receptor binding and antibody conjugation are crucial in driving assay sensitivity and specificity testing, especially for emerging molecular diagnostics and toxin detection use cases.
- The use of positive and negative controls, precise sample dilution, and optimized substrate selection have collectively contributed to reducing intra-assay variability and inter-assay variability, ensuring consistent outcomes across diverse sample types. Increased attention to food safety testing and environmental monitoring has led to improvements in wash buffer preparation, reference intervals, and hapten labeling.
- Quantification through optical density (OD) and relative light units (RLU) allows for higher signal-to-noise ratio, which is critical for pathogen identification and detecting trace-level contaminants. Current data shows that the adoption of molecular-based assays grew by 14% as testing protocols expanded across food safety and clinical trail sectors. Meanwhile, the market is expected to grow by more than 9% annually, driven by increasing demand for high-sensitivity diagnostics and evolving regulatory frameworks. This comparison illustrates a substantial upward trend, where the expanding use of advanced immunoassay techniques in multiple fields correlates directly with rising implementation rates and growing market value.
How is this Immunoassay Industry segmented?
The immunoassay industry research report provides comprehensive data (region-wise segment analysis), with forecasts and estimates in "USD billion" for the period 2025-2029, as well as historical data from 2019-2023 for the following segments.
- Product
- Reagents and kits
- Analyzers
- Technology
- ELISA
- Radioimmunoassay (RIA)
- Chemiluminescence Immunoassay (CLIA)
- Fluorescence Immunoassay (FIA)
- Rapid Tests
- Western Blotting
- Specimen
- End-User
- Hospitals
- Blood Banks
- Clinical Laboratories
- Pharmaceutical and Biotech Companies
- Academic Research Centers
- Others
- Application
- Infectious Diseases
- Endocrinology
- Oncology
- Cardiology
- Autoimmune Diseases
- Therapeutic Drug Monitoring
- Bone & Mineral Disorders
- Others
- Geography
- North America
- Europe
- Middle East and Africa
- APAC
- China
- India
- Japan
- South Korea
- South America
- Rest of World (ROW)
By Product Insights
The reagents and kits segment is estimated to witness significant growth during the forecast period.
The global immunoassay market continues to evolve as reagents and kits remain indispensable to improving assay accuracy, sensitivity, and operational efficiency. These components are essential in enabling a range of immunoassay platforms to detect specific antigens with high specificity, especially in drug screening, infectious disease testing, and biomarker quantification. Advanced reagent formulations support multiple functions such as minimizing cross-reactivity in competitive immunoassays, enhancing visualization through immunofluorescence, and amplifying signals in chemiluminescent immunoassays. As diagnostic precision becomes a priority across sectors, the quality and compatibility of reagents with systems like liquid handlers and microplate readers are becoming key factors influencing procurement and lab workflows.

Request Free Sample
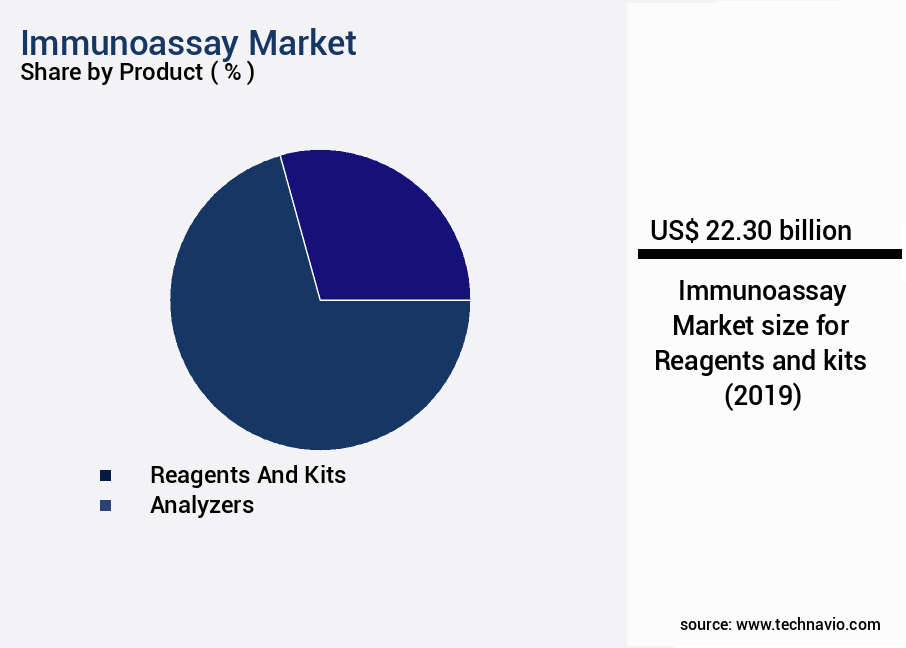
As of 2019 the Reagents and kits segment estimated at USD 22.30 billion, and it is forecast to see a moderate upward trend through the forecast period.
When comparing recent performance, reagents and kits currently contribute to an estimated 20% of total diagnostic market revenue, reflecting their central role in assay workflows and end-use reliability. This share is expected to increase further as demand for rapid and accurate diagnostic tests intensifies. The continuous need for high-quality assay validation and automation solutions ensures that the immunoassay market maintains forward momentum. Looking ahead, expanding use cases across clinical and industrial domains are expected to drive sustained demand. As diagnostic testing volumes increase, precision-oriented reagents are positioned as a growth catalyst, offering scalable support for both emerging and established immunoassay technologies.

Request Free Sample
Regional Analysis
During the forecast period, North America is projected to contribute 45% to the overall growth of the global market. Technavio's analysts have elaborately explained the regional trends and drivers that shape the market during the forecast period.

Request Free Sample
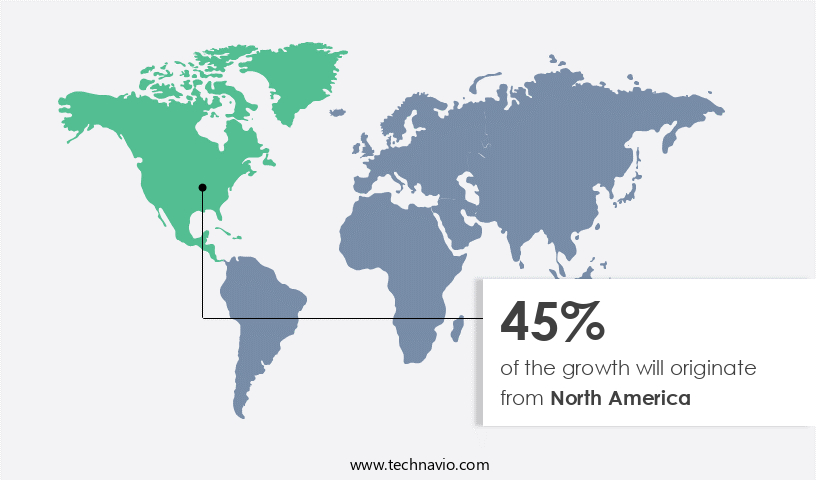
The North American the market is experiencing notable expansion due to the escalating elderly population and the high incidence of chronic and infectious diseases.The global immunoassay market continues to expand as healthcare systems prioritize early detection and disease management through advanced diagnostic testing. Driven by increased demand for point-of-care solutions and laboratory automation, immunoassay technologies are evolving to meet rising diagnostic volumes across clinical and research applications. The widespread adoption of immunoassays is directly linked to rising rates of chronic and infectious diseases, prompting healthcare providers to invest in more accurate and efficient testing frameworks. Notably, the shift toward patient-centric diagnostics is fueling ongoing innovation in assay development and system integration, ensuring broader accessibility and faster turnaround times.
A direct comparison of recent data reveals that the number of cancer cases rose by 24% in men and 21% in women between 2010 and 2020, leading to a parallel increase in demand for immunoassay-based diagnostics. As testing becomes more frequent across various care settings, this sustained growth trajectory signals continued reliance on immunoassays as a foundational tool for diagnostic decision-making.
Market Dynamics
Our researchers analyzed the data with 2024 as the base year, along with the key drivers, trends, and challenges. A holistic analysis of drivers will help companies refine their marketing strategies to gain a competitive advantage.
The global immunoassay market is continuously advancing, driven by the rising demand for precision diagnostics and enhanced disease detection capabilities. Applications such as immunoassay applications in disease diagnosis have expanded across clinical and research settings, increasing the need for high-accuracy testing methods. Recent improvements in immunoassay reproducibility and reliability have enabled consistent results across a range of complex biological matrices. The adoption of efficient immunoassay sample preparation methods for various matrices and the integration of immunoassay automation and robotics integration have significantly enhanced throughput and minimized human error, supporting high-efficiency laboratories.
Additionally, evolving data analysis methods for immunoassay results have strengthened the interpretation of findings in both qualitative and quantitative formats, especially when benchmarked against standardized immunoassay performance evaluation criteria. The market shows a clear trend toward innovation, particularly in enzyme-linked immunosorbent assay optimization, high-throughput immunoassay workflow design, and chemiluminescence immunoassay data interpretation, each contributing to faster and more sensitive diagnostics.
Techniques like fluorescence immunoassay signal enhancement strategies and electrochemiluminescence immunoassay calibration further improve analytical precision. Manufacturers are aligning with immunoassay validation parameters and regulatory guidelines to ensure product efficacy, particularly in multiplex immunoassay panel design and applications, where multiple targets are analyzed simultaneously. The industry also faces considerations such as immunoassay development cost and time considerations, while exploring scalable solutions in lateral flow immunoassay manufacturing and quality control.
Recent evaluations indicate that sandwich immunoassay sensitivity and specificity exceed that of competitive immunoassay limitations and advantages, especially within defined immunoassay detection limit and quantification range, solidifying its role in diagnostics. The rise of advanced immunoassay technologies and future trends continues to reshape expectations across the global diagnostic landscape.

What are the key market drivers leading to the rise in the adoption of Immunoassay Industry?
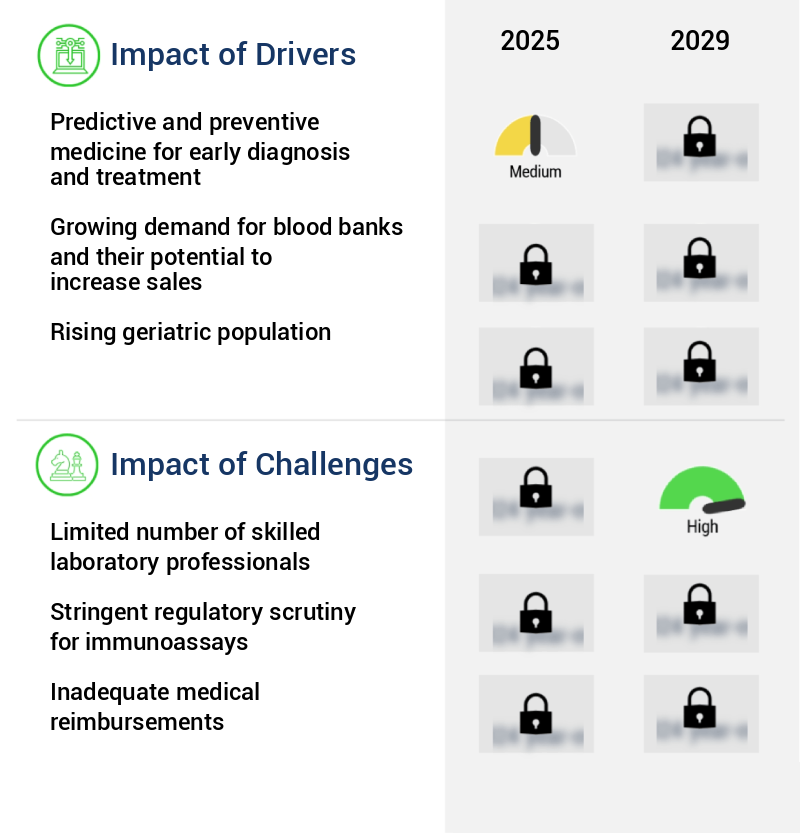
- The market is undergoing rapid transformation as healthcare systems increasingly prioritize early, personalized predictive and preventive medicine for early diagnosis and treatment interventions over reactive treatment. Predictive and preventive medicine now plays a critical role in reshaping care models by enabling more accurate diagnoses and tailored therapies that reduce the burden of chronic and acute conditions.
- This shift is supported by advancements in diagnostic tools that improve clinical decision-making and minimize the risks associated with misdiagnosis, aligning with broader efforts to enhance patient outcomes and operational efficiency in healthcare delivery.
- A comparison of recent performance data highlights the market's growing momentum. A study indicated that predictive diagnostics led to a 30% reduction in unnecessary hospitalizations and a 20% decrease in emergency room visits across a large healthcare network, demonstrating tangible cost savings and improved care quality. Concurrently, market forecasts show over 15% growth in the coming years, underscoring the sector's accelerating adoption and the growing reliance on data-driven, patient-specific diagnostic practices.
What are the market trends shaping the Immunoassay Industry?
- The global immunoassay market continues to evolve as an essential diagnostic platform across various sectors, particularly in food safety and quality assurance. Immunoassays are increasingly integrated into food testing workflows due to their ability to detect contaminants and residues with high precision. These assays utilize antigen-antibody interactions, enabling reliable identification of harmful substances such as antibiotic residues, which are a growing public health concern due to widespread use in animal husbandry.
- Their ease of use, minimal sample preparation, and rapid results have made them indispensable in ensuring regulatory compliance and consumer protection. Recent data highlights the performance trajectory of the market, with a documented increase of over 10% in demand for food testing applications.
- This trend demonstrates a shift toward proactive detection strategies that support public health initiatives. In comparison to traditional methods, immunoassays not only deliver faster turnaround times but also enhance detection sensitivity, making them increasingly valuable for stakeholders focused on accurate, cost-effective diagnostic solutions.
What challenges does the Immunoassay Industry face during its growth?
- The global immunoassay market continues to expand, driven by its critical role in enhancing diagnostic accuracy across healthcare and scientific applications. However, this growth is increasingly constrained by a shortage of skilled laboratory professionals. Immunoassays require precise execution to yield accurate, reproducible results, yet many facilities particularly smaller diagnostic centers face difficulties in recruiting and retaining trained personnel.
- This is especially evident in lower-resourced institutions, where the operational costs associated with specialized staff often exceed budgetary allowances, limiting adoption and accessibility in underserved regions. Despite these labor challenges, the market shows notable resilience and rising demand.
- Current projections indicate a growth of over 12% in the near term, suggesting that the need for advanced diagnostics continues to rise. When automated immunoassay systems were introduced in clinical practice, studies recorded a 30% improvement in diagnostic accuracy and efficiency for thyroid disorders. This data underscores how addressing workforce limitations could unlock significant performance gains in clinical diagnostics.
Exclusive Customer Landscape
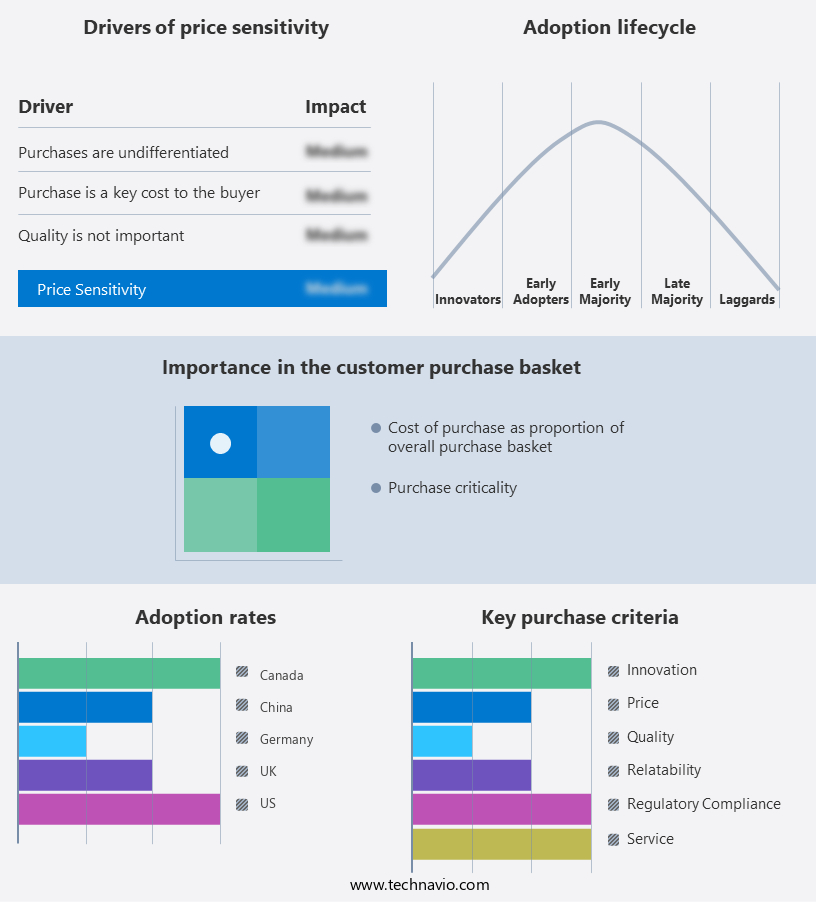
The immunoassay market forecasting report includes the adoption lifecycle of the market, covering from the innovator's stage to the laggard's stage. It focuses on adoption rates in different regions based on penetration. Furthermore, the immunoassay market report also includes key purchase criteria and drivers of price sensitivity to help companies evaluate and develop their market growth analysis strategies.

Customer Landscape
Key Companies & Market Insights
Companies are implementing various strategies, such as strategic alliances, immunoassay market forecast, partnerships, mergers and acquisitions, geographical expansion, and product/service launches, to enhance their presence in the industry.
Abbott Laboratories - The company specializes in providing advanced immunoassay solutions, including Alinity, to the global market. Their offerings deliver accurate and efficient diagnostic testing, contributing significantly to the healthcare industry's progress. These innovative technologies facilitate improved patient care and enable better disease management.
The industry research and growth report includes detailed analyses of the competitive landscape of the market and information about key companies, including:
- Abbott Laboratories
- Abnova Corp.
- Agilent Technologies Inc.
- Becton Dickinson and Co.
- Bio-Techne Corp.
- bioMerieux SA
- Danaher Corp.
- DiaSorin S.p.A.
- F. Hoffmann-La Roche Ltd.
- Omega Diagnostics Group Plc
- OraSure Technologies Inc.
- PerkinElmer Inc.
- QIAGEN N.V.
- QuidelOrtho Corp.
- Seramun Diagnostica GmbH
- Shenzhen Mindray BioMedical Electronics Co. Ltd
- Siemens AG
- Sysmex Corp.
- Tecan Trading AG
- Thermo Fisher Scientific Inc.
Qualitative and quantitative analysis of companies has been conducted to help clients understand the wider business environment as well as the strengths and weaknesses of key industry players. Data is qualitatively analyzed to categorize companies as pure play, category-focused, industry-focused, and diversified; it is quantitatively analyzed to categorize companies as dominant, leading, strong, tentative, and weak.
Recent Development and News in Immunoassay Market
- In January 2024, Roche Diagnostics announced the launch of its new Elecsys 2010 Immunoassay System, which offers enhanced sensitivity and specificity for the detection of various biomarkers, including cardiology and oncology markers (Roche Press Release, 2024).
- In March 2024, Abbott Laboratories and Thermo Fisher Scientific entered into a strategic collaboration to co-develop and commercialize a range of point-of-care (POC) immunoassay tests for infectious diseases and other clinical applications (Abbott Press Release, 2024).
- In May 2024, Siemens Healthineers completed the acquisition of DiaSorin S.P.A., a leading in vitro diagnostics company, significantly expanding its immunoassay portfolio and market presence in Europe and Latin America (Siemens Healthineers Press Release, 2024).
- In February 2025, the U.S. Food and Drug Administration (FDA) granted approval for Quidel Corporation's Sofia 2 SARS Antigen FIA assay, a rapid immunoassay test for the detection of SARS-CoV-2 antigens in nasal swab samples, further expanding the company's COVID-19 diagnostic offerings (Quidel Press Release, 2025).
Research Analyst Overview
- The market continues to evolve as demand grows across clinical diagnostics and research applications, with increasing reliance on elisa technology, chemiluminescent immunoassay, and fluorescence immunoassay to improve assay precision and accuracy. Advancements in antibody-antigen binding, electrochemiluminescence detection, and signal amplification methods are enabling lower limit of detection (lod) and better limit of quantification (loq), crucial for protein quantification and hormone detection. Integration of microplate reader systems and data analysis software has enhanced assay validation methods and quality control procedures, particularly in high-throughput screening and drug screening environments.
- Immunoassay automation and liquid handling systems further reduce intra-assay variability while supporting consistent endpoint and kinetic measurements. A reported 13% increase in adoption of multiplex immunoassay platforms highlights the growing shift toward streamlined sample preparation techniques and optimized standard curve generation. With industry expectations pointing to an annual growth rate exceeding 8%, the continuous refinement of method performance and cross-reactivity assessment underscores the market's expanding capabilities in applications such as lateral flow immunoassay, Western blotting, and immunofluorescence microscopy.
Dive into Technavio's robust research methodology, blending expert interviews, extensive data synthesis, and validated models for unparalleled Immunoassay Market insights. See full methodology.
Immunoassay Market Market Scope
|
Report Coverage
|
Details
|
Page number
|
204
|
Base year
|
2024
|
Historic period
|
2019-2023 |
Forecast period
|
2025-2029
|
Growth momentum & CAGR
|
Accelerate at a CAGR of 4.6%
|
Market growth 2025-2029
|
USD 9.4 billion
|
Market structure
|
Fragmented
|
YoY growth 2024-2025(%)
|
4.0
|
Key countries
|
US, UK, Germany, Canada, China, France, Italy, Japan, India, South Korea, UAE, and Brazil
|
Competitive landscape
|
Leading Companies, Market Positioning of Companies, Competitive Strategies, and Industry Risks
|
Request Free Sample
What are the Key Data Covered in this Immunoassay Market Research and Growth Report?
- CAGR of the Immunoassay industry during the forecast period
- Detailed information on factors that will drive the growth and forecasting between 2025 and 2029
- Precise estimation of the size of the market and its contribution of the industry in focus to the parent market
- Accurate predictions about upcoming growth and trends and changes in consumer behaviour
- Growth of the market across North America, Europe, Asia, and Rest of World (ROW)
- Thorough analysis of the market's competitive landscape and detailed information about companies
- Comprehensive analysis of factors that will challenge the immunoassay market growth of industry companies
We can help! Our analysts can customize this immunoassay market research report to meet your requirements.
Get in touch
1 Executive Summary
- 1.1 Market overview
- Executive Summary - Chart on Market Overview
- Executive Summary - Data Table on Market Overview
- Executive Summary - Chart on Global Market Characteristics
- Executive Summary - Chart on Market by Geography
- Executive Summary - Chart on Market Segmentation by Product
- Executive Summary - Chart on Market Segmentation by Technology
- Executive Summary - Chart on Incremental Growth
- Executive Summary - Data Table on Incremental Growth
- Executive Summary - Chart on Company Market Positioning
2 Technavio Analysis
- 2.1 Analysis of price sensitivity, lifecycle, customer purchase basket, adoption rates, and purchase criteria
- Analysis of price sensitivity, lifecycle, customer purchase basket, adoption rates, and purchase criteria
- 2.2 Criticality of inputs and Factors of differentiation
- Overview on criticality of inputs and factors of differentiation
- 2.3 Factors of disruption
- Overview on factors of disruption
- 2.4 Impact of drivers and challenges
- Impact of drivers and challenges in 2024 and 2029
3 Market Landscape
- 3.1 Market ecosystem
- Parent Market
- Data Table on - Parent Market
- 3.2 Market characteristics
- Market characteristics analysis
4 Market Sizing
- 4.1 Market definition
- Offerings of companies included in the market definition
- 4.2 Market segment analysis
- 4.4 Market outlook: Forecast for 2024-2029
- Chart on Global - Market size and forecast 2024-2029 ($ billion)
- Data Table on Global - Market size and forecast 2024-2029 ($ billion)
- Chart on Global Market: Year-over-year growth 2024-2029 (%)
- Data Table on Global Market: Year-over-year growth 2024-2029 (%)
5 Historic Market Size
- 5.1 Global Immunoassay Market 2019 - 2023
- Historic Market Size - Data Table on Global Immunoassay Market 2019 - 2023 ($ billion)
- 5.2 Product segment analysis 2019 - 2023
- Historic Market Size - Product Segment 2019 - 2023 ($ billion)
- 5.3 Technology segment analysis 2019 - 2023
- Historic Market Size - Technology Segment 2019 - 2023 ($ billion)
- 5.4 Geography segment analysis 2019 - 2023
- Historic Market Size - Geography Segment 2019 - 2023 ($ billion)
- 5.5 Country segment analysis 2019 - 2023
- Historic Market Size - Country Segment 2019 - 2023 ($ billion)
6 Qualitative Analysis
- 6.1 Impact of AI on Global Immunoassay Market
7 Five Forces Analysis
- 7.1 Five forces summary
- Five forces analysis - Comparison between 2024 and 2029
- 7.2 Bargaining power of buyers
- Bargaining power of buyers - Impact of key factors 2024 and 2029
- 7.3 Bargaining power of suppliers
- Bargaining power of suppliers - Impact of key factors in 2024 and 2029
- 7.4 Threat of new entrants
- Threat of new entrants - Impact of key factors in 2024 and 2029
- 7.5 Threat of substitutes
- Threat of substitutes - Impact of key factors in 2024 and 2029
- 7.6 Threat of rivalry
- Threat of rivalry - Impact of key factors in 2024 and 2029
- 7.7 Market condition
- Chart on Market condition - Five forces 2024 and 2029
8 Market Segmentation by Product
- 8.1 Market segments
- Chart on Product - Market share (2024-2029) (%)
- Data Table on Product - Market share (2024-2029) (%)
- 8.2 Comparison by Product
- Chart on Comparison by Product
- Data Table on Comparison by Product
- 8.3 Reagents and kits - Market size and forecast (2024-2029)
- Chart on Reagents and kits - Market size and forecast (2024-2029) ($ billion)
- Data Table on Reagents and kits - Market size and forecast (2024-2029) ($ billion)
- Chart on Reagents and kits - Year-over-year growth (2024-2029) (%)
- Data Table on Reagents and kits - Year-over-year growth (2024-2029) (%)
- 8.4 Analyzers - Market size and forecast (2024-2029)
- Chart on Analyzers - Market size and forecast (2024-2029) ($ billion)
- Data Table on Analyzers - Market size and forecast (2024-2029) ($ billion)
- Chart on Analyzers - Year-over-year growth (2024-2029) (%)
- Data Table on Analyzers - Year-over-year growth (2024-2029) (%)
- 8.5 Market opportunity by Product
- Market opportunity by Product ($ billion)
- Data Table on Market opportunity by Product ($ billion)
9 Market Segmentation by Technology
- 9.1 Market segments
- Chart on Technology - Market share (2024-2029) (%)
- Data Table on Technology - Market share (2024-2029) (%)
- 9.2 Comparison by Technology
- Chart on Comparison by Technology
- Data Table on Comparison by Technology
- 9.3 ELISA - Market size and forecast (2024-2029)
- Chart on ELISA - Market size and forecast (2024-2029) ($ billion)
- Data Table on ELISA - Market size and forecast (2024-2029) ($ billion)
- Chart on ELISA - Year-over-year growth (2024-2029) (%)
- Data Table on ELISA - Year-over-year growth (2024-2029) (%)
- 9.4 Radioimmunoassay (RIA) - Market size and forecast (2024-2029)
- Chart on Radioimmunoassay (RIA) - Market size and forecast (2024-2029) ($ billion)
- Data Table on Radioimmunoassay (RIA) - Market size and forecast (2024-2029) ($ billion)
- Chart on Radioimmunoassay (RIA) - Year-over-year growth (2024-2029) (%)
- Data Table on Radioimmunoassay (RIA) - Year-over-year growth (2024-2029) (%)
- 9.5 Chemiluminescence Immunoassay (CLIA) - Market size and forecast (2024-2029)
- Chart on Chemiluminescence Immunoassay (CLIA) - Market size and forecast (2024-2029) ($ billion)
- Data Table on Chemiluminescence Immunoassay (CLIA) - Market size and forecast (2024-2029) ($ billion)
- Chart on Chemiluminescence Immunoassay (CLIA) - Year-over-year growth (2024-2029) (%)
- Data Table on Chemiluminescence Immunoassay (CLIA) - Year-over-year growth (2024-2029) (%)
- 9.6 Fluorescence Immunoassay (FIA) - Market size and forecast (2024-2029)
- Chart on Fluorescence Immunoassay (FIA) - Market size and forecast (2024-2029) ($ billion)
- Data Table on Fluorescence Immunoassay (FIA) - Market size and forecast (2024-2029) ($ billion)
- Chart on Fluorescence Immunoassay (FIA) - Year-over-year growth (2024-2029) (%)
- Data Table on Fluorescence Immunoassay (FIA) - Year-over-year growth (2024-2029) (%)
- 9.7 Rapid Tests - Market size and forecast (2024-2029)
- Chart on Rapid Tests - Market size and forecast (2024-2029) ($ billion)
- Data Table on Rapid Tests - Market size and forecast (2024-2029) ($ billion)
- Chart on Rapid Tests - Year-over-year growth (2024-2029) (%)
- Data Table on Rapid Tests - Year-over-year growth (2024-2029) (%)
- 9.8 Western Blotting - Market size and forecast (2024-2029)
- Chart on Western Blotting - Market size and forecast (2024-2029) ($ billion)
- Data Table on Western Blotting - Market size and forecast (2024-2029) ($ billion)
- Chart on Western Blotting - Year-over-year growth (2024-2029) (%)
- Data Table on Western Blotting - Year-over-year growth (2024-2029) (%)
- 9.9 Market opportunity by Technology
- Market opportunity by Technology ($ billion)
- Data Table on Market opportunity by Technology ($ billion)
10 Market Segmentation by Specimen
- 10.1 Market segments
- Chart on Specimen - Market share (2024-2029) (%)
- Data Table on Specimen - Market share (2024-2029) (%)
- 10.2 Comparison by Specimen
- Chart on Comparison by Specimen
- Data Table on Comparison by Specimen
- 10.3 Blood - Market size and forecast (2024-2029)
- Chart on Blood - Market size and forecast (2024-2029) ($ billion)
- Data Table on Blood - Market size and forecast (2024-2029) ($ billion)
- Chart on Blood - Year-over-year growth (2024-2029) (%)
- Data Table on Blood - Year-over-year growth (2024-2029) (%)
- 10.4 Urine - Market size and forecast (2024-2029)
- Chart on Urine - Market size and forecast (2024-2029) ($ billion)
- Data Table on Urine - Market size and forecast (2024-2029) ($ billion)
- Chart on Urine - Year-over-year growth (2024-2029) (%)
- Data Table on Urine - Year-over-year growth (2024-2029) (%)
- 10.5 Saliva - Market size and forecast (2024-2029)
- Chart on Saliva - Market size and forecast (2024-2029) ($ billion)
- Data Table on Saliva - Market size and forecast (2024-2029) ($ billion)
- Chart on Saliva - Year-over-year growth (2024-2029) (%)
- Data Table on Saliva - Year-over-year growth (2024-2029) (%)
- 10.6 Market opportunity by Specimen
- Market opportunity by Specimen ($ billion)
- Data Table on Market opportunity by Specimen ($ billion)
11 Market Segmentation by End-User
- 11.1 Market segments
- Chart on End-User - Market share (2024-2029) (%)
- Data Table on End-User - Market share (2024-2029) (%)
- 11.2 Comparison by End-User
- Chart on Comparison by End-User
- Data Table on Comparison by End-User
- 11.3 Hospitals - Market size and forecast (2024-2029)
- Chart on Hospitals - Market size and forecast (2024-2029) ($ billion)
- Data Table on Hospitals - Market size and forecast (2024-2029) ($ billion)
- Chart on Hospitals - Year-over-year growth (2024-2029) (%)
- Data Table on Hospitals - Year-over-year growth (2024-2029) (%)
- 11.4 Blood Banks - Market size and forecast (2024-2029)
- Chart on Blood Banks - Market size and forecast (2024-2029) ($ billion)
- Data Table on Blood Banks - Market size and forecast (2024-2029) ($ billion)
- Chart on Blood Banks - Year-over-year growth (2024-2029) (%)
- Data Table on Blood Banks - Year-over-year growth (2024-2029) (%)
- 11.5 Clinical Laboratories - Market size and forecast (2024-2029)
- Chart on Clinical Laboratories - Market size and forecast (2024-2029) ($ billion)
- Data Table on Clinical Laboratories - Market size and forecast (2024-2029) ($ billion)
- Chart on Clinical Laboratories - Year-over-year growth (2024-2029) (%)
- Data Table on Clinical Laboratories - Year-over-year growth (2024-2029) (%)
- 11.6 Pharmaceutical and Biotech Companies - Market size and forecast (2024-2029)
- Chart on Pharmaceutical and Biotech Companies - Market size and forecast (2024-2029) ($ billion)
- Data Table on Pharmaceutical and Biotech Companies - Market size and forecast (2024-2029) ($ billion)
- Chart on Pharmaceutical and Biotech Companies - Year-over-year growth (2024-2029) (%)
- Data Table on Pharmaceutical and Biotech Companies - Year-over-year growth (2024-2029) (%)
- 11.7 Academic Research Centers - Market size and forecast (2024-2029)
- Chart on Academic Research Centers - Market size and forecast (2024-2029) ($ billion)
- Data Table on Academic Research Centers - Market size and forecast (2024-2029) ($ billion)
- Chart on Academic Research Centers - Year-over-year growth (2024-2029) (%)
- Data Table on Academic Research Centers - Year-over-year growth (2024-2029) (%)
- 11.8 Others - Market size and forecast (2024-2029)
- Chart on Others - Market size and forecast (2024-2029) ($ billion)
- Data Table on Others - Market size and forecast (2024-2029) ($ billion)
- Chart on Others - Year-over-year growth (2024-2029) (%)
- Data Table on Others - Year-over-year growth (2024-2029) (%)
- 11.9 Market opportunity by End-User
- Market opportunity by End-User ($ billion)
- Data Table on Market opportunity by End-User ($ billion)
12 Market Segmentation by Application
- 12.1 Market segments
- Chart on Application - Market share (2024-2029) (%)
- Data Table on Application - Market share (2024-2029) (%)
- Chart on Others - Market size and forecast (2024-2029) ($ billion)
- Data Table on Others - Market size and forecast (2024-2029) ($ billion)
- Chart on Others - Year-over-year growth (2024-2029) (%)
- Data Table on Others - Year-over-year growth (2024-2029) (%)
- 12.2 Comparison by Application
- Chart on Comparison by Application
- Data Table on Comparison by Application
- Market opportunity by Application ($ billion)
- Data Table on Market opportunity by Application ($ billion)
- 12.3 Infectious Diseases - Market size and forecast (2024-2029)
- Chart on Infectious Diseases - Market size and forecast (2024-2029) ($ billion)
- Data Table on Infectious Diseases - Market size and forecast (2024-2029) ($ billion)
- Chart on Infectious Diseases - Year-over-year growth (2024-2029) (%)
- Data Table on Infectious Diseases - Year-over-year growth (2024-2029) (%)
- 12.4 Endocrinology - Market size and forecast (2024-2029)
- Chart on Endocrinology - Market size and forecast (2024-2029) ($ billion)
- Data Table on Endocrinology - Market size and forecast (2024-2029) ($ billion)
- Chart on Endocrinology - Year-over-year growth (2024-2029) (%)
- Data Table on Endocrinology - Year-over-year growth (2024-2029) (%)
- 12.5 Oncology - Market size and forecast (2024-2029)
- Chart on Oncology - Market size and forecast (2024-2029) ($ billion)
- Data Table on Oncology - Market size and forecast (2024-2029) ($ billion)
- Chart on Oncology - Year-over-year growth (2024-2029) (%)
- Data Table on Oncology - Year-over-year growth (2024-2029) (%)
- 12.6 Cardiology - Market size and forecast (2024-2029)
- Chart on Cardiology - Market size and forecast (2024-2029) ($ billion)
- Data Table on Cardiology - Market size and forecast (2024-2029) ($ billion)
- Chart on Cardiology - Year-over-year growth (2024-2029) (%)
- Data Table on Cardiology - Year-over-year growth (2024-2029) (%)
- 12.7 Autoimmune Diseases - Market size and forecast (2024-2029)
- Chart on Autoimmune Diseases - Market size and forecast (2024-2029) ($ billion)
- Data Table on Autoimmune Diseases - Market size and forecast (2024-2029) ($ billion)
- Chart on Autoimmune Diseases - Year-over-year growth (2024-2029) (%)
- Data Table on Autoimmune Diseases - Year-over-year growth (2024-2029) (%)
- 12.8 Therapeutic Drug Monitoring - Market size and forecast (2024-2029)
- Chart on Therapeutic Drug Monitoring - Market size and forecast (2024-2029) ($ billion)
- Data Table on Therapeutic Drug Monitoring - Market size and forecast (2024-2029) ($ billion)
- Chart on Therapeutic Drug Monitoring - Year-over-year growth (2024-2029) (%)
- Data Table on Therapeutic Drug Monitoring - Year-over-year growth (2024-2029) (%)
- 12.9 Bone & Mineral Disorders - Market size and forecast (2024-2029)
- Chart on Bone & Mineral Disorders - Market size and forecast (2024-2029) ($ billion)
- Data Table on Bone & Mineral Disorders - Market size and forecast (2024-2029) ($ billion)
- Chart on Bone & Mineral Disorders - Year-over-year growth (2024-2029) (%)
- Data Table on Bone & Mineral Disorders - Year-over-year growth (2024-2029) (%)
13 Customer Landscape
- 13.1 Customer landscape overview
- Analysis of price sensitivity, lifecycle, customer purchase basket, adoption rates, and purchase criteria
14 Geographic Landscape
- 14.1 Geographic segmentation
- Chart on Market share by geography 2024-2029 (%)
- Data Table on Market share by geography 2024-2029 (%)
- 14.2 Geographic comparison
- Chart on Geographic comparison
- Data Table on Geographic comparison
- 14.3 North America - Market size and forecast 2024-2029
- Chart on North America - Market size and forecast 2024-2029 ($ billion)
- Data Table on North America - Market size and forecast 2024-2029 ($ billion)
- Chart on North America - Year-over-year growth 2024-2029 (%)
- Data Table on North America - Year-over-year growth 2024-2029 (%)
- 14.4 Europe - Market size and forecast 2024-2029
- Chart on Europe - Market size and forecast 2024-2029 ($ billion)
- Data Table on Europe - Market size and forecast 2024-2029 ($ billion)
- Chart on Europe - Year-over-year growth 2024-2029 (%)
- Data Table on Europe - Year-over-year growth 2024-2029 (%)
- 14.5 Asia - Market size and forecast 2024-2029
- Chart on Asia - Market size and forecast 2024-2029 ($ billion)
- Data Table on Asia - Market size and forecast 2024-2029 ($ billion)
- Chart on Asia - Year-over-year growth 2024-2029 (%)
- Data Table on Asia - Year-over-year growth 2024-2029 (%)
- 14.6 Rest of World (ROW) - Market size and forecast 2024-2029
- Chart on Rest of World (ROW) - Market size and forecast 2024-2029 ($ billion)
- Data Table on Rest of World (ROW) - Market size and forecast 2024-2029 ($ billion)
- Chart on Rest of World (ROW) - Year-over-year growth 2024-2029 (%)
- Data Table on Rest of World (ROW) - Year-over-year growth 2024-2029 (%)
- 14.7 US - Market size and forecast 2024-2029
- Chart on US - Market size and forecast 2024-2029 ($ billion)
- Data Table on US - Market size and forecast 2024-2029 ($ billion)
- Chart on US - Year-over-year growth 2024-2029 (%)
- Data Table on US - Year-over-year growth 2024-2029 (%)
- 14.8 UK - Market size and forecast 2024-2029
- Chart on UK - Market size and forecast 2024-2029 ($ billion)
- Data Table on UK - Market size and forecast 2024-2029 ($ billion)
- Chart on UK - Year-over-year growth 2024-2029 (%)
- Data Table on UK - Year-over-year growth 2024-2029 (%)
- 14.9 Germany - Market size and forecast 2024-2029
- Chart on Germany - Market size and forecast 2024-2029 ($ billion)
- Data Table on Germany - Market size and forecast 2024-2029 ($ billion)
- Chart on Germany - Year-over-year growth 2024-2029 (%)
- Data Table on Germany - Year-over-year growth 2024-2029 (%)
- 14.10 Canada - Market size and forecast 2024-2029
- Chart on Canada - Market size and forecast 2024-2029 ($ billion)
- Data Table on Canada - Market size and forecast 2024-2029 ($ billion)
- Chart on Canada - Year-over-year growth 2024-2029 (%)
- Data Table on Canada - Year-over-year growth 2024-2029 (%)
- 14.11 China - Market size and forecast 2024-2029
- Chart on China - Market size and forecast 2024-2029 ($ billion)
- Data Table on China - Market size and forecast 2024-2029 ($ billion)
- Chart on China - Year-over-year growth 2024-2029 (%)
- Data Table on China - Year-over-year growth 2024-2029 (%)
- 14.12 France - Market size and forecast 2024-2029
- Chart on France - Market size and forecast 2024-2029 ($ billion)
- Data Table on France - Market size and forecast 2024-2029 ($ billion)
- Chart on France - Year-over-year growth 2024-2029 (%)
- Data Table on France - Year-over-year growth 2024-2029 (%)
- 14.13 Japan - Market size and forecast 2024-2029
- Chart on Japan - Market size and forecast 2024-2029 ($ billion)
- Data Table on Japan - Market size and forecast 2024-2029 ($ billion)
- Chart on Japan - Year-over-year growth 2024-2029 (%)
- Data Table on Japan - Year-over-year growth 2024-2029 (%)
- 14.14 Italy - Market size and forecast 2024-2029
- Chart on Italy - Market size and forecast 2024-2029 ($ billion)
- Data Table on Italy - Market size and forecast 2024-2029 ($ billion)
- Chart on Italy - Year-over-year growth 2024-2029 (%)
- Data Table on Italy - Year-over-year growth 2024-2029 (%)
- 14.15 India - Market size and forecast 2024-2029
- Chart on India - Market size and forecast 2024-2029 ($ billion)
- Data Table on India - Market size and forecast 2024-2029 ($ billion)
- Chart on India - Year-over-year growth 2024-2029 (%)
- Data Table on India - Year-over-year growth 2024-2029 (%)
- 14.16 South Korea - Market size and forecast 2024-2029
- Chart on South Korea - Market size and forecast 2024-2029 ($ billion)
- Data Table on South Korea - Market size and forecast 2024-2029 ($ billion)
- Chart on South Korea - Year-over-year growth 2024-2029 (%)
- Data Table on South Korea - Year-over-year growth 2024-2029 (%)
- 14.17 Market opportunity by geography
- Market opportunity by geography ($ billion)
- Data Tables on Market opportunity by geography ($ billion)
- 14.18 UAE - Market size and forecast (2024-2029)
- Chart on UAE - Market size and forecast (2024-2029) ($ billion)
- Data Table on UAE - Market size and forecast (2024-2029) ($ billion)
- Chart on UAE - Year-over-year growth (2024-2029) (%)
- Data Table on UAE - Year-over-year growth (2024-2029) (%)
- 14.19 Brazil - Market size and forecast (2024-2029)
- Chart on Brazil - Market size and forecast (2024-2029) ($ billion)
- Data Table on Brazil - Market size and forecast (2024-2029) ($ billion)
- Chart on Brazil - Year-over-year growth (2024-2029) (%)
- Data Table on Brazil - Year-over-year growth (2024-2029) (%)
15 Drivers, Challenges, and Opportunity/Restraints
- 15.3 Impact of drivers and challenges
- Impact of drivers and challenges in 2024 and 2029
- 15.4 Market opportunities/restraints
16 Competitive Landscape
- 16.2 Competitive Landscape
- Overview on criticality of inputs and factors of differentiation
- 16.3 Landscape disruption
- Overview on factors of disruption
- 16.4 Industry risks
- Impact of key risks on business
17 Competitive Analysis
- 17.2 Market positioning of companies
- Matrix on companies position and classification
- 17.3 Abbott Laboratories (United States)
- Abbott Laboratories (United States) - Overview
- Abbott Laboratories (United States) - Product / Service
- Abbott Laboratories (United States) - Key offerings
- 17.4 Abnova Corp. (Taiwan)
- Abnova Corp. (Taiwan) - Overview
- Abnova Corp. (Taiwan) - Product / Service
- Abnova Corp. (Taiwan) - Key offerings
- 17.5 Agilent Technologies Inc. (United States)
- Agilent Technologies Inc. (United States) - Overview
- Agilent Technologies Inc. (United States) - Product / Service
- Agilent Technologies Inc. (United States) - Key offerings
- 17.6 Becton Dickinson and Co. (United States)
- Becton Dickinson and Co. (United States) - Overview
- Becton Dickinson and Co. (United States) - Product / Service
- Becton Dickinson and Co. (United States) - Key offerings
- 17.7 Bio-Techne Corp. (United States)
- Bio-Techne Corp. (United States) - Overview
- Bio-Techne Corp. (United States) - Product / Service
- Bio-Techne Corp. (United States) - Key offerings
- 17.8 bioMerieux SA (France)
- bioMerieux SA (France) - Overview
- bioMerieux SA (France) - Product / Service
- bioMerieux SA (France) - Key offerings
- 17.9 Danaher Corp. (United States)
- Danaher Corp. (United States) - Overview
- Danaher Corp. (United States) - Product / Service
- Danaher Corp. (United States) - Key offerings
- 17.10 DiaSorin S.p.A. (Italy)
- DiaSorin S.p.A. (Italy) - Overview
- DiaSorin S.p.A. (Italy) - Product / Service
- DiaSorin S.p.A. (Italy) - Key offerings
- 17.11 F. Hoffmann-La Roche Ltd. (Switzerland)
- F. Hoffmann-La Roche Ltd. (Switzerland) - Overview
- F. Hoffmann-La Roche Ltd. (Switzerland) - Product / Service
- F. Hoffmann-La Roche Ltd. (Switzerland) - Key offerings
- 17.12 Omega Diagnostics Group Plc (United Kingdom)
- Omega Diagnostics Group Plc (United Kingdom) - Overview
- Omega Diagnostics Group Plc (United Kingdom) - Product / Service
- Omega Diagnostics Group Plc (United Kingdom) - Key offerings
- 17.13 OraSure Technologies Inc. (United States)
- OraSure Technologies Inc. (United States) - Overview
- OraSure Technologies Inc. (United States) - Product / Service
- OraSure Technologies Inc. (United States) - Key offerings
- 17.14 PerkinElmer Inc. (United States)
- PerkinElmer Inc. (United States) - Overview
- PerkinElmer Inc. (United States) - Product / Service
- PerkinElmer Inc. (United States) - Key offerings
- 17.15 QIAGEN N.V. (Netherlands)
- QIAGEN N.V. (Netherlands) - Overview
- QIAGEN N.V. (Netherlands) - Product / Service
- QIAGEN N.V. (Netherlands) - Key offerings
- 17.16 QuidelOrtho Corp. (United States)
- QuidelOrtho Corp. (United States) - Overview
- QuidelOrtho Corp. (United States) - Product / Service
- QuidelOrtho Corp. (United States) - Key offerings
- 17.17 Seramun Diagnostica GmbH (Germany)
- Seramun Diagnostica GmbH (Germany) - Overview
- Seramun Diagnostica GmbH (Germany) - Product / Service
- Seramun Diagnostica GmbH (Germany) - Key offerings
- 17.18 Shenzhen Mindray BioMedical Electronics Co. Ltd (China)
- Shenzhen Mindray BioMedical Electronics Co. Ltd (China) - Overview
- Shenzhen Mindray BioMedical Electronics Co. Ltd (China) - Product / Service
- Shenzhen Mindray BioMedical Electronics Co. Ltd (China) - Key offerings
- 17.19 Siemens AG (Germany)
- Siemens AG (Germany) - Overview
- Siemens AG (Germany) - Product / Service
- Siemens AG (Germany) - Key offerings
- 17.20 Sysmex Corp. (Japan)
- Sysmex Corp. (Japan) - Overview
- Sysmex Corp. (Japan) - Product / Service
- Sysmex Corp. (Japan) - Key offerings
- 17.21 Tecan Trading AG (Switzerland)
- Tecan Trading AG (Switzerland) - Overview
- Tecan Trading AG (Switzerland) - Product / Service
- Tecan Trading AG (Switzerland) - Key offerings
- 17.22 Thermo Fisher Scientific Inc. (United States)
- Thermo Fisher Scientific Inc. (United States) - Overview
- Thermo Fisher Scientific Inc. (United States) - Product / Service
- Thermo Fisher Scientific Inc. (United States) - Key offerings
- 17.23 Abbott Laboratories
- Abbott Laboratories - Overview
- Abbott Laboratories - Product / Service
- Abbott Laboratories - Key offerings
- 17.24 Abnova Corp.
- Abnova Corp. - Overview
- Abnova Corp. - Product / Service
- Abnova Corp. - Key offerings
- 17.25 Agilent Technologies Inc.
- Agilent Technologies Inc. - Overview
- Agilent Technologies Inc. - Product / Service
- Agilent Technologies Inc. - Key offerings
- 17.26 Becton Dickinson and Co.
- Becton Dickinson and Co. - Overview
- Becton Dickinson and Co. - Product / Service
- Becton Dickinson and Co. - Key offerings
- 17.27 Bio Techne Corp.
- Bio Techne Corp. - Overview
- Bio Techne Corp. - Product / Service
- Bio Techne Corp. - Key offerings
- 17.28 BioMerieux SA
- BioMerieux SA - Overview
- BioMerieux SA - Product / Service
- BioMerieux SA - Key offerings
- 17.29 Danaher Corp.
- Danaher Corp. - Overview
- Danaher Corp. - Product / Service
- Danaher Corp. - Key offerings
- 17.30 DiaSorin SpA
- DiaSorin SpA - Overview
- DiaSorin SpA - Product / Service
- DiaSorin SpA - Key offerings
- 17.31 F. Hoffmann La Roche Ltd.
- F. Hoffmann La Roche Ltd. - Overview
- F. Hoffmann La Roche Ltd. - Product / Service
- F. Hoffmann La Roche Ltd. - Key offerings
- 17.32 Omega Diagnostics Group Plc
- Omega Diagnostics Group Plc - Overview
- Omega Diagnostics Group Plc - Product / Service
- Omega Diagnostics Group Plc - Key offerings
- 17.33 OraSure Technologies Inc.
- OraSure Technologies Inc. - Overview
- OraSure Technologies Inc. - Product / Service
- OraSure Technologies Inc. - Key offerings
- 17.34 Perkin Elmer Inc.
- Perkin Elmer Inc. - Overview
- Perkin Elmer Inc. - Product / Service
- Perkin Elmer Inc. - Key offerings
- 17.35 QIAGEN N.V.
- QIAGEN N.V. - Overview
- QIAGEN N.V. - Product / Service
- QIAGEN N.V. - Key offerings
- 17.36 QuidelOrtho Corp.
- QuidelOrtho Corp. - Overview
- QuidelOrtho Corp. - Product / Service
- QuidelOrtho Corp. - Key offerings
- 17.37 Seramun Diagnostica GmbH
- Seramun Diagnostica GmbH - Overview
- Seramun Diagnostica GmbH - Product / Service
- Seramun Diagnostica GmbH - Key offerings
- 17.38 Shenzhen Mindray BioMedical Electronics Co. Ltd
- Shenzhen Mindray BioMedical Electronics Co. Ltd - Overview
- Shenzhen Mindray BioMedical Electronics Co. Ltd - Product / Service
- Shenzhen Mindray BioMedical Electronics Co. Ltd - Key offerings
- 17.39 Siemens AG
- Siemens AG - Overview
- Siemens AG - Product / Service
- Siemens AG - Key offerings
- 17.40 Sysmex Corp.
- Sysmex Corp. - Overview
- Sysmex Corp. - Product / Service
- Sysmex Corp. - Key offerings
- 17.41 Tecan Trading AG
- Tecan Trading AG - Overview
- Tecan Trading AG - Product / Service
- Tecan Trading AG - Key offerings
- 17.42 Thermo Fisher Scientific Inc.
- Thermo Fisher Scientific Inc. - Overview
- Thermo Fisher Scientific Inc. - Product / Service
- Thermo Fisher Scientific Inc. - Key offerings
18 Appendix
- 18.2 Inclusions and exclusions checklist
- Inclusions checklist
- Exclusions checklist
- 18.3 Currency conversion rates for US$
- Currency conversion rates for US$
- 18.4 Research methodology
- 18.7 Validation techniques employed for market sizing
- Validation techniques employed for market sizing
- 18.9 360 degree market analysis
- 360 degree market analysis
- 18.10 List of abbreviations