Shoe Care Products Market Size 2025-2029
The shoe care products market size is forecast to increase by USD 284.4 million at a CAGR of 8% between 2024 and 2029.
- The market is experiencing significant growth, driven by the increasing trend towards product innovation and product line extension. Brands are focusing on premium shoes their offerings by introducing high-quality, advanced shoe care solutions. Another key trend is the rising demand for natural ingredient-based shoe care products, as consumers become more health-conscious and environmentally aware. However, the footwear market is not without challenges. Fluctuating raw material prices pose a significant obstacle, as the cost of key ingredients such as natural extracts and synthetic compounds can impact the profitability of shoe care product manufacturers. To navigate these challenges and capitalize on market opportunities, companies must stay informed about raw material price trends and explore alternative sourcing options.
- Additionally, investing in research and development to create innovative, eco-friendly, and cost-effective solutions can help brands differentiate themselves in a competitive market. Overall, the market offers significant growth potential for companies that can successfully navigate the dynamic market landscape.
What will be the Size of the Shoe Care Products Market during the forecast period?

- The shoe care market continues to evolve, driven by shifting consumer preferences and advancements in technology. Cruelty-free shoe care solutions, such as plant-based shoe shine and conditioners, are gaining traction among ethical consumers. Luxury footwear brands are also investing in innovative shoe care services, including professional shoe care and shoe repair, to maintain their products' quality and appeal. Meanwhile, the rise of sustainable footwear and eco-friendly shoe care options, like biodegradable shoe care and waterproofing sprays, is reshaping the industry. DIY shoe care and online shoe care services are also on the rise, catering to consumers' convenience and cost-effectiveness.
- Shoe care retailers are adapting to these trends, offering a range of organic shoe care products and natural shoe care solutions. Men's and women's shoes, as well as athletic footwear and casual shoes, all require regular care and attention. Shoe care research and development are ongoing, with a focus on creating effective, sustainable, and cruelty-free solutions. The shoe care industry is a dynamic and evolving landscape, with ongoing innovation and trends shaping its future. From shoe care technology and branding to marketing and distribution, the sector is constantly adapting to meet the changing needs and preferences of consumers.
How is this Shoe Care Products Industry segmented?
The shoe care products industry research report provides comprehensive data (region-wise segment analysis), with forecasts and estimates in "USD million" for the period 2025-2029, as well as historical data from 2019-2023 for the following segments.
- Distribution Channel
- Leather
- Suede
- Synthetic
- Product
- Brushes and buffing clothes
- Polishing creams
- Waxes and liquids
- Others
- End-User
- Residential
- Commercial
- Geography
- North America
- US
- Canada
- Mexico
- Europe
- France
- Germany
- The Netherlands
- UK
- Middle East and Africa
- UAE
- APAC
- Australia
- China
- India
- Japan
- South Korea
- South America
- Brazil
- Rest of World (ROW)
- North America
By Distribution Channel Insights
The leather segment is estimated to witness significant growth during the forecast period.
The shoe care market encompasses a range of products and services, including shoe brushes, cleaners, and conditioners, as well as professional care and DIY kits. Brands cater to various segments, such as vegan footwear, luxury, and sustainable options. Waterproofing sprays and shoe care technology are popular innovations, while women's and men's shoes, sports footwear, casual and dress shoes, and athletic footwear each have distinct care requirements. Professional shoe care services and retailers offer solutions for shoe repair, restoration, and customization. Research and development in organic, plant-based, and eco-friendly shoe care are growing trends. Shoe care distributors play a crucial role in bringing these products to market, while shoe care wholesalers cater to retailers and larger businesses.
The offline distribution channel, which includes sales through specialty stores, department stores, and other retail formats, has seen declining revenue due to the rise of online shopping. To counteract this trend, manufacturers and retailers are expanding their presence in local and regional markets and implementing competitive pricing strategies and wider assortments. Shoe care marketing efforts focus on various channels, including social media, influencer partnerships, and targeted advertising. Shoe care subscription services offer convenience and regular maintenance, while online platforms provide access to a wider range of products and services. Innovations in shoe care technology, such as crepe cleaner and shoe protector, continue to shape the market.
The shoe care industry's focus on sustainability and cruelty-free practices is driving growth in the vegan and eco-friendly shoe care segments. Overall, the shoe care market is evolving to meet the diverse needs of consumers and the changing retail landscape.
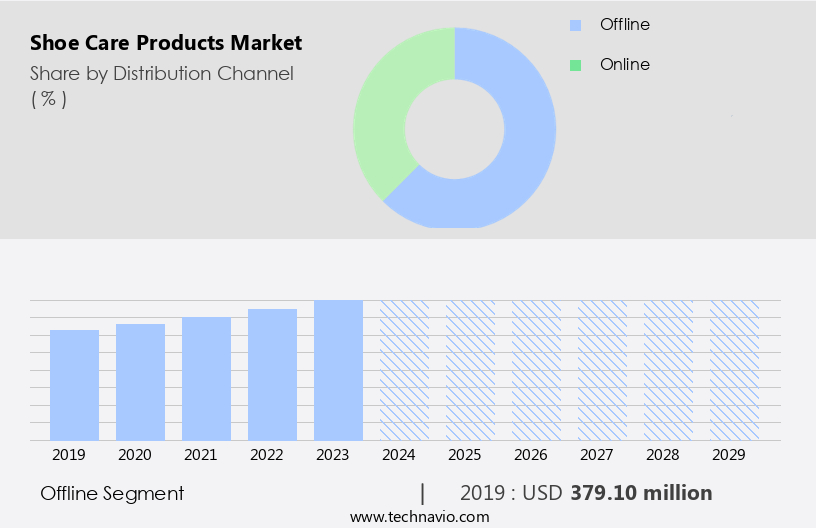
The Leather segment was valued at USD 379.10 million in 2019 and showed a gradual increase during the forecast period.
Regional Analysis
North America is estimated to contribute 37% to the growth of the global market during the forecast period.Technavio's analysts have elaborately explained the regional trends and drivers that shape the market during the forecast period.
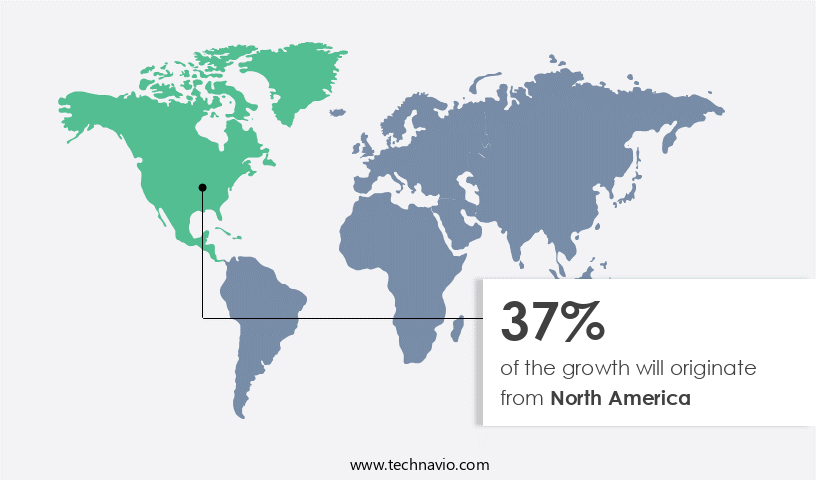
The North American the market holds a significant share in the global industry, with the United States and Mexico being key contributors. The market's expansion is driven by the increasing adoption of shoe care products and the intense competition among established players. These companies focus on product innovation, new product development, and expanding distribution channels to cater to diverse consumer preferences. The US market is anticipated to witness further growth, with new entrants expected to intensify competition during the forecast period. Various shoe care product categories, including shoe brushes, cleaners, conditioners, waterproofing sprays, and polishes, are in high demand.
Women's and men's shoes, casual and dress footwear, athletic footwear, and sustainable and vegan options are among the popular segments. DIY shoe care, professional shoe care services, and retail shoe care solutions are also gaining traction. Innovative shoe care technologies, such as plant-based, organic, biodegradable, and eco-friendly products, are increasingly popular. Consumers are also seeking cruelty-free and sustainable shoe care options. Shoe care retailers, distributors, and manufacturers are responding to these trends by offering a wide range of products and services. The shoe care industry is also witnessing advancements in shoe care marketing, packaging, and subscription services.
Online shoe care solutions, shoe dyeing, and shoe restoration services are becoming increasingly accessible. The market is expected to continue evolving, with a focus on meeting the diverse needs of consumers and staying ahead of the competition.
Market Dynamics
Our researchers analyzed the data with 2024 as the base year, along with the key drivers, trends, and challenges. A holistic analysis of drivers will help companies refine their marketing strategies to gain a competitive advantage.
What are the key market drivers leading to the rise in the adoption of Shoe Care Products Industry?
- Product innovation and extension of product lines, resulting in the creation of premium offerings, serve as the primary catalyst for market growth.
- Shoe care product manufacturers are prioritizing innovation to meet evolving consumer demands. They are developing advanced shoe care solutions, such as eco-friendly shoe deodorizers and shoe protectors, to differentiate their offerings from substitutes. These products not only help maintain the appearance of shoes but also extend their life. Consumers are willing to invest in premium shoe care products due to their multi-functionality and ease of use. As a result, there is a growing trend towards product premiumization and line extension in the shoe care market.
- Additionally, manufacturers are focusing on sustainable and eco-friendly shoe care advertising to appeal to environmentally-conscious consumers. Shoe restoration and crepe cleaner are other innovative shoe care offerings that cater to the diverse needs of consumers. Overall, the shoe care market is witnessing significant growth due to these advancements and the increasing awareness of the importance of shoe care.
What are the market trends shaping the Shoe Care Products Industry?
- The use of natural shoe care products is gaining popularity as the latest market trend. This increasing demand is driven by consumers seeking eco-friendly and health-conscious alternatives to traditional shoe care products.
- Shoe care products have gained significant attention in the market due to consumers' increasing awareness of health and environmental concerns. Instead of opting for shoe care products laden with harsh chemicals, consumers are now preferring those made from natural and raw ingredients. These products offer several benefits, including being alcohol-free, safe for health, and eco-friendly. Professional shoe care brands and distributors are responding to this trend by introducing a range of shoe care products, including shoe brushes and cleaners, made from biodegradable materials. These products cater to various footwear types, such as women's shoes, casual shoes, and vegan footwear.
- Shoe care technology has also advanced, with waterproofing sprays and DIY shoe care kits becoming increasingly popular. Shoe deodorizers, for instance, now contain natural ingredients like essential oils to neutralize odors and provide a pleasant fragrance. By choosing natural shoe care products, consumers can protect their footwear while safeguarding their health and the environment.
What challenges does the Shoe Care Products Industry face during its growth?
- The volatility in raw material prices poses a significant challenge to the industry's growth trajectory.
- The market faces challenges due to the volatile prices of raw materials, primarily waxes and solvents. These materials, which make up the majority of shoe care products such as shoe polish, consist of 20-40% waxes and 70% solvents. Common solvents include naphtha and turpentine, which are petroleum derivatives and subject to price instability due to their dependence on crude oil prices and natural forest products. Additionally, traditional dyes used in shoe care products, like nigrosine, also contribute to the market's volatility. The increasing demand for shoe care products, including shoe shine, leather conditioner, shoe repair, and shoe care services, presents an opportunity for innovation in the industry.
- Consumers are increasingly seeking cruelty-free, plant-based, organic, and natural shoe care options, which could potentially reduce reliance on traditional, petroleum-based raw materials. Shoe care retailers can address this trend by offering alternative, sustainable solutions, such as shoe care products made from organic or plant-based ingredients.
Exclusive Customer Landscape
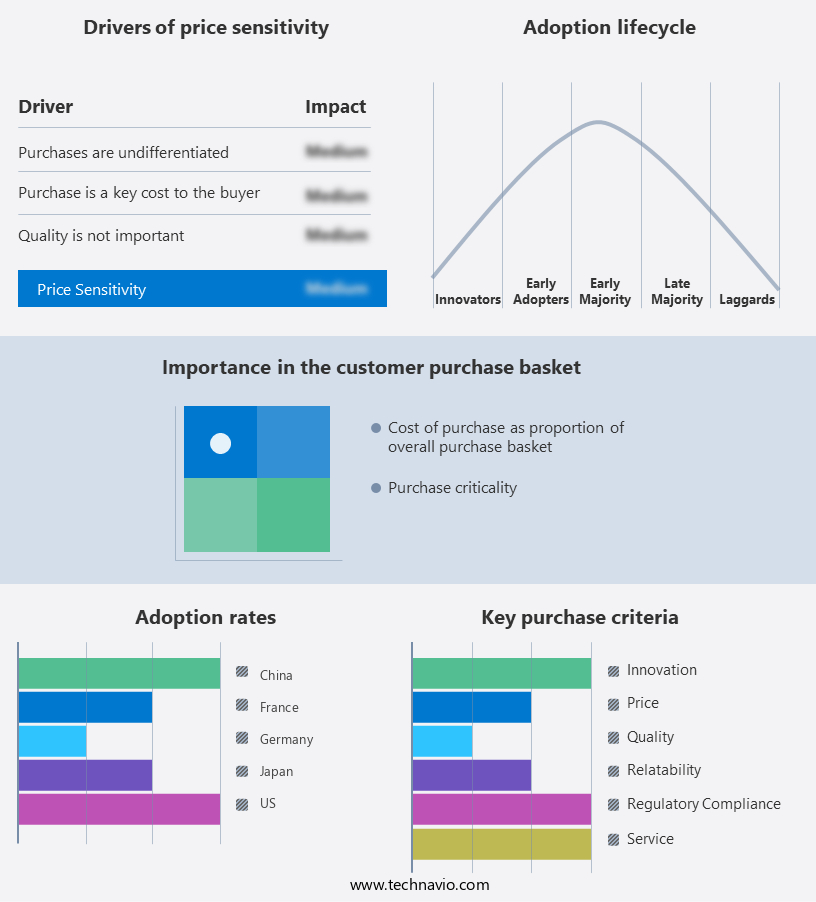
The shoe care products market forecasting report includes the adoption lifecycle of the market, covering from the innovator's stage to the laggard's stage. It focuses on adoption rates in different regions based on penetration. Furthermore, the shoe care products market report also includes key purchase criteria and drivers of price sensitivity to help companies evaluate and develop their market growth analysis strategies.
Customer Landscape
Key Companies & Market Insights
Companies are implementing various strategies, such as strategic alliances, shoe care products market forecast, partnerships, mergers and acquisitions, geographical expansion, and product/service launches, to enhance their presence in the industry.
Angelus Shoe Polish - The company showcases a range of high-quality shoe care products under the brand name Angelus. These offerings include Angelus shoe wax polish, military-grade roll call shoe wax polish, leather balm, and various brushes. Our products cater to those seeking superior footwear maintenance solutions. The Angelus shoe wax polish ensures a rich, long-lasting shine, while the military-grade roll call polish delivers a matte finish. The leather balm restores and conditions leather, and our brushes are designed for optimal application. By utilizing these products, consumers can maintain their footwear in pristine condition.
The industry research and growth report includes detailed analyses of the competitive landscape of the market and information about key companies, including:
- Angelus Shoe Polish
- C P Marketing Inc.
- C.A. Zoes Mfg Co.
- Caleres Inc.
- Fiebing Co. Inc.
- Grangers International Ltd.
- Implus Footcare LLC
- Lincoln Shoe Polish
- M. V. Shoe Care Pvt. Ltd.
- Moneysworth and Best Quality Shoe Care
- OTTER WAX LLC
- Payless Shoe Source Inc.
- Rocket Pure Care LLC
- S.C. Johnson and Son Inc.
- Salzenbrodt GmbH and Co. KG
- Shinola
- TARRAGO BRANDS INTERNATIONIAL, S.L.
- The Clinkard Group Ltd.
- TRG BESTNETS SL
- Woodland Worldwide
Qualitative and quantitative analysis of companies has been conducted to help clients understand the wider business environment as well as the strengths and weaknesses of key industry players. Data is qualitatively analyzed to categorize companies as pure play, category-focused, industry-focused, and diversified; it is quantitatively analyzed to categorize companies as dominant, leading, strong, tentative, and weak.
Recent Development and News in Shoe Care Products Market
- In January 2024, leading shoe care products manufacturer, SoleMate, introduced a new line of eco-friendly, plant-based shoe care products. This launch marked a significant shift in the industry towards more sustainable and environmentally-friendly offerings (SoleMate Press Release).
- In May 2025, Adidas and leading shoe care products provider, Jason Markk, announced a strategic partnership to co-brand and distribute Jason Markk's popular shoe cleaning kits exclusively with Adidas stores and online platforms. This collaboration aimed to enhance the customer experience and boost sales for both companies (Adidas Press Release).
- In September 2024, major shoe care products manufacturer, Kiwi, completed the acquisition of its primary competitor, Cobbler's Choice, for USD120 million. This acquisition granted Kiwi a larger market share and expanded its product offerings, making it a dominant player in the industry (SEC Filing).
- In November 2025, the European Union passed new regulations on microplastics in personal care and cleaning products, including shoe care items. Companies were required to reduce microplastic content by 30% by 2027, driving innovation and investment in alternative, non-microplastic solutions (European Commission Press Release).
Research Analyst Overview
The shoe care market encompasses a range of products and services aimed at preserving and enhancing footwear. Water resistance, a crucial aspect of shoe care, is achieved through synthetic shoe care solutions and advanced polish formulas. Shoe care advice, disseminated through guides, tutorials, and expert recommendations, is in high demand. Sustainability is a significant trend, with eco-friendly ingredients and ethical manufacturing practices gaining popularity. Shoe care professionals and enthusiasts rely on certifications, ratings, and safety guidelines to ensure the highest standards. Innovations in leather care, suede care, odor control, and UV protection continue to shape the industry. Shoe care business models include comparisons, reviews, and applications of various cleaning solutions and techniques.
Research and technology advancements focus on abrasion resistance, nubuck care, and longer shoe longevity. Shoe care trends emphasize the importance of adhering to regulations and maintaining ethical practices. Shoe care techniques and applications continue to evolve, driven by the ever-growing demand for well-maintained footwear.
Dive into Technavio's robust research methodology, blending expert interviews, extensive data synthesis, and validated models for unparalleled Shoe Care Products Market insights. See full methodology.
|
Market Scope |
|
|
Report Coverage |
Details |
|
Page number |
197 |
|
Base year |
2024 |
|
Historic period |
2019-2023 |
|
Forecast period |
2025-2029 |
|
Growth momentum & CAGR |
Accelerate at a CAGR of 8% |
|
Market growth 2025-2029 |
USD 284.4 million |
|
Market structure |
Fragmented |
|
YoY growth 2024-2025(%) |
7.2 |
|
Key countries |
US, China, Germany, Japan, UK, Australia, India, France, Brazil, Canada, Brazil, UAE, Australia, Rest of World (ROW), Saudi Arabia, France, South Korea, Mexico, and The Netherlands |
|
Competitive landscape |
Leading Companies, Market Positioning of Companies, Competitive Strategies, and Industry Risks |
What are the Key Data Covered in this Shoe Care Products Market Research and Growth Report?
- CAGR of the Shoe Care Products industry during the forecast period
- Detailed information on factors that will drive the growth and forecasting between 2025 and 2029
- Precise estimation of the size of the market and its contribution of the industry in focus to the parent market
- Accurate predictions about upcoming growth and trends and changes in consumer behaviour
- Growth of the market across North America, Europe, APAC, Middle East and Africa, and South America
- Thorough analysis of the market's competitive landscape and detailed information about companies
- Comprehensive analysis of factors that will challenge the shoe care products market growth of industry companies
We can help! Our analysts can customize this shoe care products market research report to meet your requirements.
 RIA -
RIA - 
