
Smart Cards Market Size and Growth Forecast 2026-2030
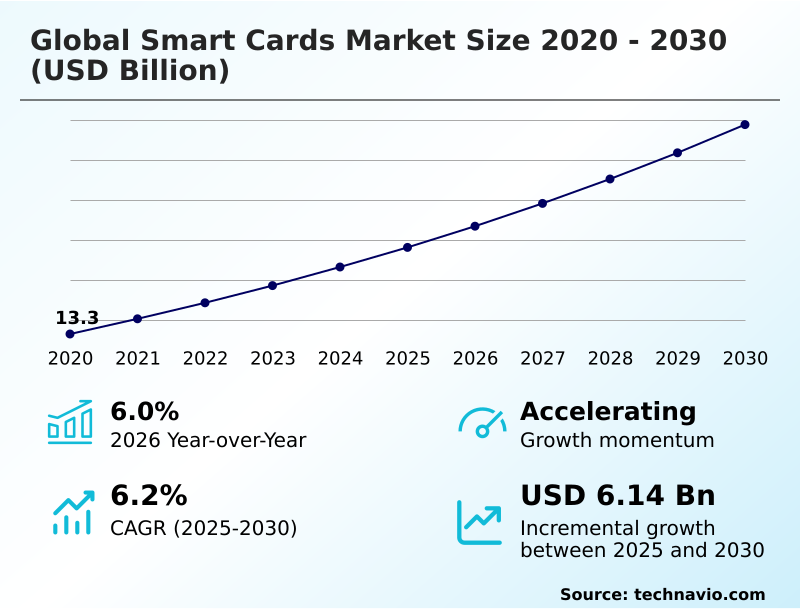
The Smart Cards Market size was valued at USD 17.63 billion in 2025 growing at a CAGR of 6.2% during the forecast period 2026-2030.
APAC accounts for 44.3% of incremental growth during the forecast period. The Contactless smart cards segment by Type was valued at USD 8.19 billion in 2024, while the Transaction segment holds the largest revenue share by Application.
The market is projected to grow by USD 10.47 billion from 2020 to 2030, with USD 6.14 billion of the growth expected during the forecast period of 2025 to 2030.
Get Key Insights on Market Forecast (PDF) Request Free Sample
Smart Cards Market Overview
The smart cards market is navigating a critical transition where the physical integrated circuit chip is no longer just a transaction tool but a cornerstone of digital trust architecture. Demand is propelled by the global build-out of contactless payment infrastructure and large-scale e-government initiatives, which rely on the robust security of hardware-based authentication. In practice, a government agency deploying a new national identification program utilizes microprocessor smart card technology to secure citizen data and streamline access to public services, a shift that can reduce administrative fraud by over 70% compared to paper-based systems. While the convenience of the mobile payment ecosystem presents a competitive challenge, the tangible security of a dual-interface card remains paramount for high-stakes applications. The APAC region is a major force in this expansion, accounting for a significant portion of the market's incremental growth, as countries implement ambitious digital identity projects. The ongoing development of biometric system-on-card and post-quantum cryptography solutions underscores the industry's focus on future-proofing physical credentials against evolving threats.
Drivers, Trends, and Challenges in the Smart Cards Market
The market's trajectory is increasingly defined by high-value, specific use cases where security and reliability are paramount. While overall contactless payment adoption rates continue to climb, strategic focus is shifting toward the technical nuances of biometric authentication on-card and the complex architectural requirements of government digital identity solutions.
Adherence to international standards, such as ISO/IEC 7816 for physical card characteristics and the forthcoming NIST guidelines for post-quantum cryptography, are becoming critical vendor selection criteria. For instance, a financial institution's decision-making process around sustainable card material manufacturing must balance ESG goals with the need for durability and chip integrity.
This contrasts with the challenge of integrating a secure element for IoT devices, where power consumption and form factor are primary constraints. The pivot to sustainable materials is significant, with some issuers replacing over 80% of their new card stock with recycled or bio-sourced plastics, a stark increase from just a few years ago.
This demonstrates how specialized demands are reshaping procurement and product development across the industry.
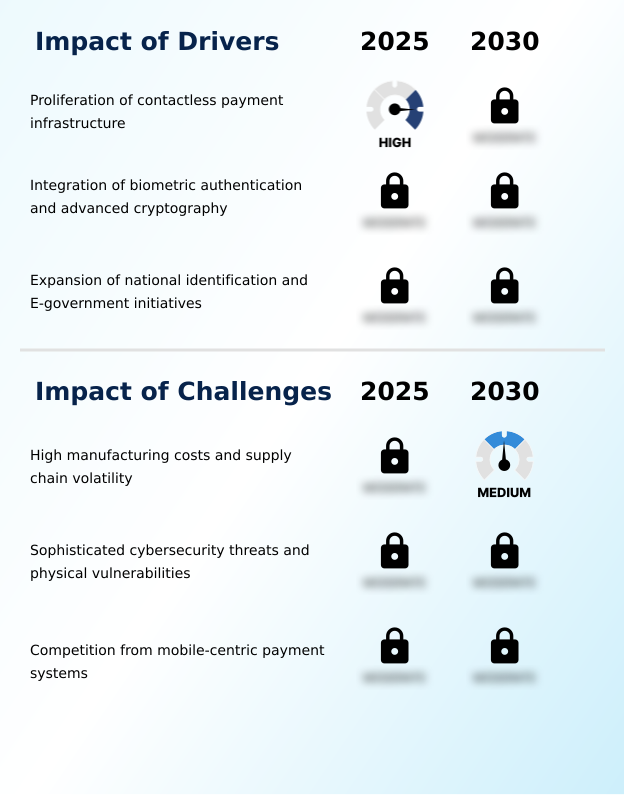
Primary Growth Driver: The proliferation of contactless payment infrastructure across the retail and transit sectors serves as a key driver for the market's growth.
Market momentum is primarily fueled by the rapid expansion of contactless payment infrastructure, which has made the contactless smart card the standard in retail and public transit environments globally.
This proliferation is reinforced by an escalating demand for more sophisticated security features beyond basic PINs, driving the adoption of hardware-based authentication methods like on-card biometrics and advanced encryption. A significant catalyst is the global expansion of e-government initiatives.
Large-scale national identification programs, particularly in APAC, create a massive and sustained demand for microprocessor smart card technology.
This region alone accounts for over 44% of the market's incremental growth, as governments digitize public services and require a secure, physical token for citizen identity verification.
Emerging Market Trend: A significant market trend is the shift toward sustainable materials and circular economy initiatives in card manufacturing, driven by regulatory pressures and increasing consumer demand for environmentally responsible products.
A defining trend is the industry-wide pivot toward sustainability, with manufacturers increasingly offering card bodies made from recycled or bio-sourced materials to meet corporate ESG mandates. This move toward a circular economy is complemented by technological advancements in on-card security.
The commercialization of biometric system-on-card technology, which enables fingerprint authentication directly on the device, is enhancing security for both payment and identity verification without needing an internal battery. Concurrently, to address future threats, the industry is proactively integrating post-quantum cryptography into the secure element of high-security cards.
This is especially critical for government-issued documents like e-passports, which have long operational lifecycles and require protection against the decryption capabilities of future quantum computers. These trends collectively push the market toward more secure, convenient, and environmentally responsible solutions.
Key Industry Challenge: High manufacturing costs associated with advanced features and persistent supply chain volatility for semiconductor components present key challenges affecting the industry's growth.
High manufacturing costs and supply chain volatility for core components, including the integrated circuit chip and specialized biometric sensors, remain a significant market challenge, limiting the mass issuance of advanced cards in price-sensitive regions. The industry also grapples with persistent and evolving cybersecurity threats.
Sophisticated side-channel attacks targeting the microprocessor smart card and relay attacks on contactless protocols necessitate continuous and costly investment in hardware countermeasures. The most significant structural challenge, however, comes from the competitive pressure of mobile-centric digital wallets.
The convenience of the mobile payment ecosystem offers a compelling substitute, forcing smart card vendors to innovate and emphasize the unique security value proposition of a physical, power-independent secure element.
Explore Full Market Dynamics Analysis Request Free Sample
Smart Cards Market Segmentation
The smart cards industry research report provides comprehensive data including region-wise segment analysis, with forecasts and analysis for the period 2026-2030, as well as historical data from 2020-2024 for the following segments.
Type Segment Analysis
The contactless smart cards segment is estimated to witness significant growth during the forecast period.
Contactless smart cards, which leverage near field communication (NFC) and radio frequency identification (RFID) for data transmission, represent the market's largest and fastest-growing segment.
This dominance is driven by the global build-out of contactless payment infrastructure in retail and transit sectors, where speed and hygiene are paramount.
These cards, containing a secure element and an antenna, draw power from the reader, eliminating the need for physical contact and reducing mechanical wear.
The technology is foundational to modern cashless societies, supporting everything from tap-and-go credit card payments to urban mobility passes.
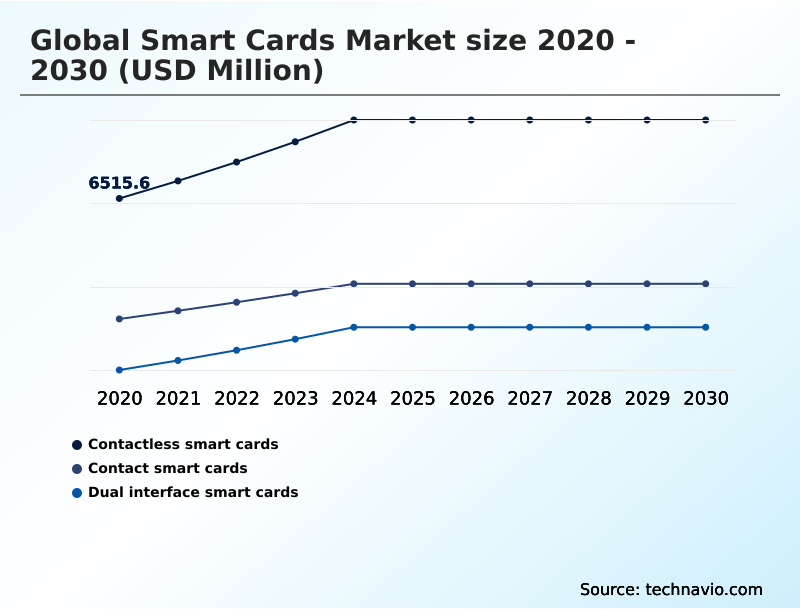
As infrastructure modernization accelerates, the demand for dual-interface cards that support both legacy contact and contactless interactions continues to grow, ensuring backward compatibility while paving the way for future applications in identity verification.
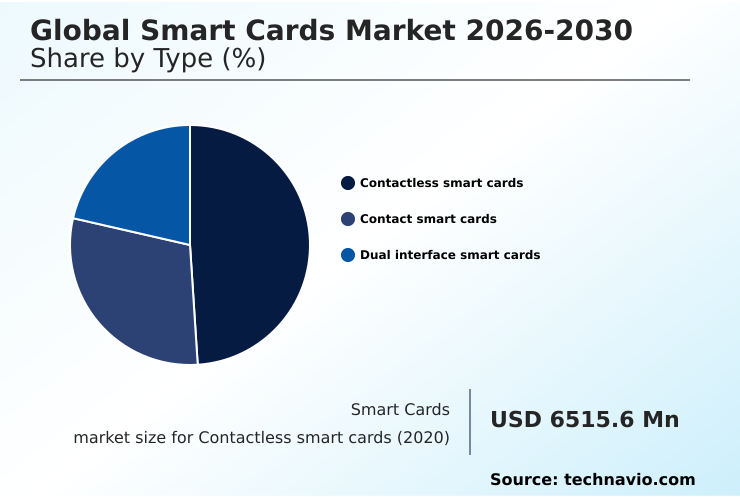
The Contactless smart cards segment was valued at USD 8.19 billion in 2024 and showed a gradual increase during the forecast period.
Smart Cards Market by Region: APAC Leads with 44.3% Growth Share
APAC is estimated to contribute 44.3% to the growth of the global market during the forecast period.
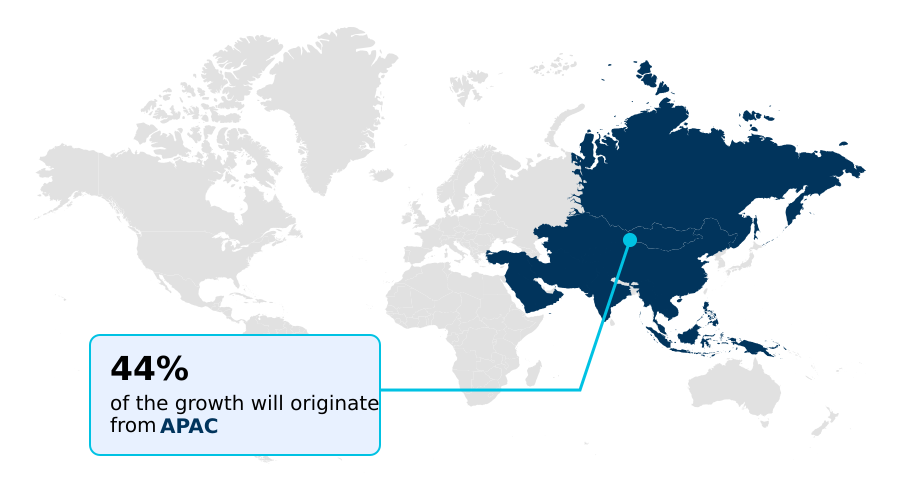
The global landscape is led by APAC, which is projected to contribute approximately 44% of the market's incremental growth, largely fueled by massive national identification programs in countries like India and China.
These projects drive large-volume demand for microprocessor smart card technology to enable secure e-government initiatives.
North America, accounting for around 21% of the opportunity, is focused on upgrading its contactless payment infrastructure and deploying advanced biometric system-on-card solutions for financial and corporate security.
Europe, with a comparable share, prioritizes adherence to stringent data privacy regulations and leads in the adoption of post-quantum cryptography for long-lifecycle documents like passports.
This regional focus ensures that the hardware-based authentication provided by a dual-interface card remains a critical component of secure identity frameworks worldwide, even with the rise of digital alternatives.
Customer Landscape Analysis for the Smart Cards Market
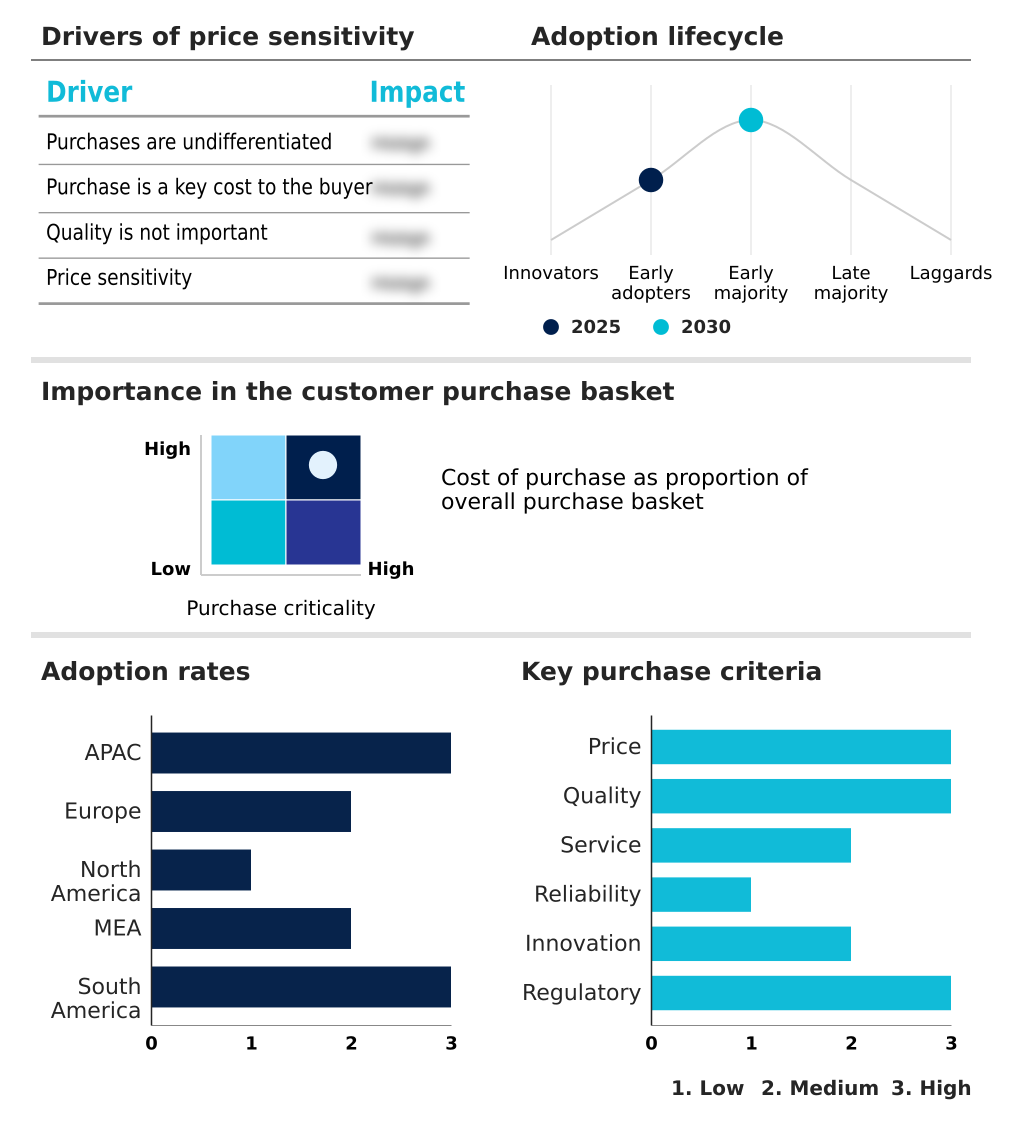
The smart cards market forecasting report includes the adoption lifecycle of the market, covering from the innovator’s stage to the laggard’s stage. It focuses on adoption rates in different regions based on penetration. Furthermore, the smart cards market report also includes key purchase criteria and drivers of price sensitivity to help companies evaluate and develop their market growth analysis strategies.
Competitive Landscape of the Smart Cards Market
Companies are implementing various strategies, such as strategic alliances, partnerships, mergers and acquisitions, geographical expansion, and product/service launches, to enhance their presence in the smart cards market industry.
ABCorp. - Analysts view the market as centered on embedded integrated circuit chips for secure data storage and processing, critical for modern authentication and transaction integrity.
The industry research and growth report includes detailed analyses of the competitive landscape of the market and information about key companies, including:
- ABCorp.
- Alioth LLC.
- CardLogix Corp.
- CPI Card Group Inc.
- Eastcompeace Technology Co. Ltd.
- Excelsecu Data Technology Co. Ltd.
- Fingerprint Cards AB.
- Giesecke Devrient GmbH
- Hengbao Co. Ltd.
- HID Global Corp.
- IDEMIA France SAS
- IDENTIV INC.
- KONA I
- NXP Semiconductors NV
- Sony Group Corp.
- STMicroelectronics NV
- Thales Group
- Toppan Inc.
- WATCHDATA TECHNOLOGIES Ltd.
- zwipe solution pvt ltd.
Qualitative and quantitative analysis of companies has been conducted to help clients understand the wider business environment as well as the strengths and weaknesses of key industry players. Data is qualitatively analyzed to categorize companies as pure play, category-focused, industry-focused, and diversified; it is quantitatively analyzed to categorize companies as dominant, leading, strong, tentative, and weak.
Recent Developments in the Smart Cards Market
- In May 2025, the government of Singapore initiated an update to its national identity card system, incorporating a secondary secure element designed to store emergency medical data and digital health insurance credentials.
- In April 2025, the Metropolitan Transportation Authority in New York City finalized a comprehensive upgrade of its regional transit ticketing system, enabling advanced contactless card interactions across all its commuter rail lines.
- In March 2025, Deutsche Telekom launched a pilot program for a new generation of high-capacity smart cards engineered specifically for securing industrial IoT applications operating on private networks.
- In February 2025, Thales Group announced the commercial launch of a new high-security smart card body constructed entirely from non-food corn, targeting large-scale government identity projects with a sustainable alternative to traditional plastics.
Research Analyst Overview: Smart Cards Market
The industry is navigating a critical transition where the integrated circuit chip is evolving from a simple transaction tool into a fundamental anchor for digital identity.
This shift is creating new boardroom-level decisions regarding capital expenditure, as financial institutions must now weigh the higher unit cost of a dual-interface card with an embedded biometric system-on-card against the long-term benefits of reduced fraud and enhanced customer trust.
With the contactless smart card segment already commanding the majority of the market, the next frontier of competition lies in advanced security features. Adherence to the EMV chip standard is now baseline; differentiation comes from readiness to implement post-quantum cryptography, a key requirement for government contracts involving long-lifecycle documents like national IDs.
The reliability of the subscriber identity module in telecommunications and the robust security of a microprocessor smart card for financial applications ensure that hardware-based authentication remains indispensable, despite the growth of software-based alternatives.
Dive into Technavio’s robust research methodology, blending expert interviews, extensive data synthesis, and validated models for unparalleled Smart Cards Market insights. See full methodology.
| Market Scope | |
|---|---|
| Page number | 309 |
| Base year | 2025 |
| Historic period | 2020-2024 |
| Forecast period | 2026-2030 |
| Growth momentum & CAGR | Accelerate at a CAGR of 6.2% |
| Market growth 2026-2030 | USD 6137.9 million |
| Market structure | Fragmented |
| YoY growth 2025-2026(%) | 6.0% |
| Key countries | China, India, Japan, South Korea, Australia, Indonesia, France, Germany, UK, Italy, Spain, The Netherlands, US, Canada, Mexico, Saudi Arabia, UAE, South Africa, Israel, Turkey, Brazil, Argentina and Colombia |
| Competitive landscape | Leading Companies, Market Positioning of Companies, Competitive Strategies, and Industry Risks |
Smart Cards Market: Key Questions Answered in This Report
-
What is the expected growth of the Smart Cards Market between 2026 and 2030?
-
The Smart Cards Market is expected to grow by USD 6.14 billion during 2026-2030, registering a CAGR of 6.2%. Year-over-year growth in 2026 is estimated at 6.0%%. This acceleration is shaped by proliferation of contactless payment infrastructure, which is intensifying demand across multiple end-use verticals covered in the report.
-
-
What segmentation does the market report cover?
-
The report is segmented by Type (Contactless smart cards, Contact smart cards, and Dual interface smart cards), Application (Transaction, Communication, Government, Security and access control, and Others), Product Type (Memory based smart cards, Microprocessor smart cards, and Magnetic stripe) and Geography (APAC, Europe, North America, Middle East and Africa, South America). Among these, the Contactless smart cards segment is estimated to witness significant growth during the forecast period, driven by rising adoption across key application areas. Each segment includes detailed qualitative and quantitative analysis, along with historical data from 2020-2024 and forecasts through 2030 with year-over-year growth rates.
-
-
Which regions are analyzed in the report?
-
The report covers APAC, Europe, North America, Middle East and Africa and South America. APAC is estimated to contribute 44.3% to market growth during the forecast period. Country-level analysis includes China, India, Japan, South Korea, Australia, Indonesia, France, Germany, UK, Italy, Spain, The Netherlands, US, Canada, Mexico, Saudi Arabia, UAE, South Africa, Israel, Turkey, Brazil, Argentina and Colombia, with dedicated market size tables and year-over-year growth for each.
-
-
What are the key growth drivers and market challenges?
-
The primary driver is proliferation of contactless payment infrastructure, which is accelerating investment and industry demand. The main challenge is high manufacturing costs and supply chain volatility, creating operational barriers for key market participants. The report quantifies the impact of each driver and challenge across 2026 and 2030 with comparative analysis.
-
-
Who are the major players in the Smart Cards Market?
-
Key vendors include ABCorp., Alioth LLC., CardLogix Corp., CPI Card Group Inc., Eastcompeace Technology Co. Ltd., Excelsecu Data Technology Co. Ltd., Fingerprint Cards AB., Giesecke Devrient GmbH, Hengbao Co. Ltd., HID Global Corp., IDEMIA France SAS, IDENTIV INC., KONA I, NXP Semiconductors NV, Sony Group Corp., STMicroelectronics NV, Thales Group, Toppan Inc., WATCHDATA TECHNOLOGIES Ltd. and zwipe solution pvt ltd.. The report provides qualitative and quantitative analysis categorizing companies as dominant, leading, strong, tentative, and weak based on their market positioning. Company profiles include business segment analysis, SWOT assessment, key offerings, and recent strategic developments.
-
Smart Cards Market Research Insights
Compliance with the EMV chip standard remains foundational, but market dynamics are increasingly shaped by broader e-government initiatives and the push for a unified identity verification framework across borders. The demand for secure transaction protocols is intensifying as nations move toward cashless societies, though this is tempered by the pervasive mobile payment ecosystem.
While the transaction application segment is the largest, the government segment exhibits robust demand, reflecting the scale of national identification programs. In practice, a smart card's secure element provides a hardened credential for logical access control, offering a more resilient defense against certain cyberattacks compared to purely software-based authenticators.
This hardware-centric security is a key differentiator in corporate and government environments where data integrity is non-negotiable.
We can help! Our analysts can customize this smart cards market research report to meet your requirements.
 RIA -
RIA - 
