
Credit Card Payments Market Analysis, Size, and Forecast 2026-2030: North America (US, Canada, and Mexico), APAC (China, Japan, and India), Europe (UK, Germany, and France), South America (Brazil, Argentina, and Chile), Middle East and Africa (Saudi Arabia, UAE, and South Africa), and Rest of World (ROW)

Credit Card Payments Market Analysis, Size, and Forecast 2026-2030:
North America (US, Canada, and Mexico), APAC (China, Japan, and India), Europe (UK, Germany, and France), South America (Brazil, Argentina, and Chile), Middle East and Africa (Saudi Arabia, UAE, and South Africa), and Rest of World (ROW)

Published: Oct 2026 295 Pages SKU: IRTNTR74458

Market Overview at a Glance

$184.00 B
Market Opportunity
8.3%
CAGR 2025 - 2030
45.9%
North America Growth
$289.40 B
Consumer or individual segment 2024

Credit Card Payments Market Size 2026-2030

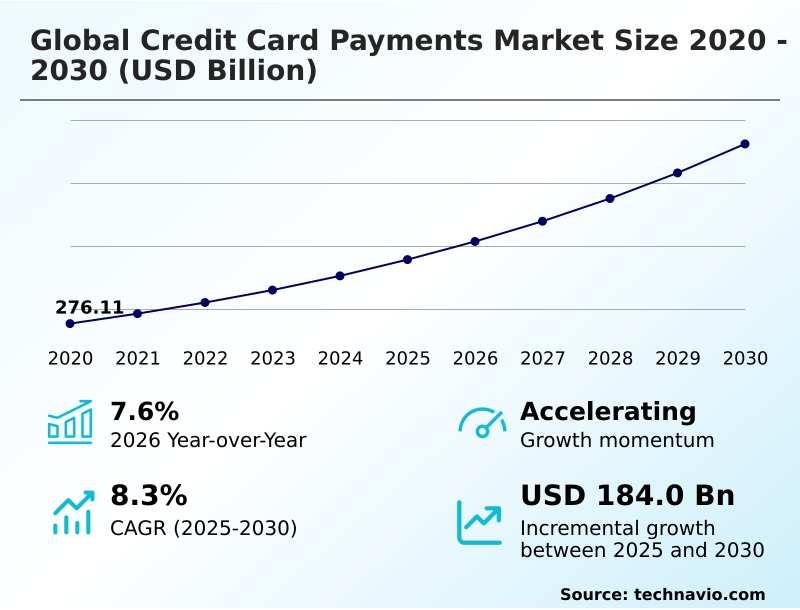
The credit card payments market size is valued to increase by USD 184.00 billion, at a CAGR of 8.3% from 2025 to 2030. Rapid proliferation of e-commerce platforms globally will drive the credit card payments market.

Major Market Trends & Insights

  • North America dominated the market and accounted for a 45.9% growth during the forecast period.
  • By End-user - Consumer or individual segment was valued at USD 289.40 billion in 2024
  • By Product Type - General purpose credit cards segment accounted for the largest market revenue share in 2024

Market Size & Forecast

  • Market Opportunities: USD 285.81 billion
  • Market Future Opportunities: USD 184.00 billion
  • CAGR from 2025 to 2030 : 8.3%

Market Summary

  • The Credit Card Payments sector facilitates seamless global commerce through complex networks that authenticate and settle cashless transactions instantaneously. Financial institutions continuously upgrade smart card microchips and deploy cryptographic identifiers to safeguard sensitive consumer data across physical and digital endpoints.
  • In modern supply chain operations, businesses heavily leverage virtual single use tokens tied to enterprise automation frameworks to streamline vendor payouts securely. This precise integration of automated controls has resulted in a 30% reduction in unauthorized B2B transaction attempts, significantly improving corporate liquidity management.
  • Furthermore, the industry aggressively counters evolving cyber threats by embedding sophisticated fraud detection algorithms directly within real time authorization rails. By transitioning from static credentials to dynamic security codes within closed loop ecosystems, payment processors ensure robust operational continuity and high transaction integrity.
  • This continuous modernization ultimately allows merchants to accelerate checkout speeds while maintaining absolute compliance with stringent global data protection mandates.

What will be the Size of the Credit Card Payments Market during the forecast period?
Get Key Insights on Market Forecast (PDF) Get Free Sample

How is the Credit Card Payments Market Segmented?

The credit card payments industry research report provides comprehensive data (region-wise segment analysis), with forecasts and estimates in "USD million" for the period 2026-2030, as well as historical data from 2020-2024 for the following segments.

  • End-user
    • Consumer or individual
    • Commercial
  • Product type
    • General purpose credit cards
    • Specialty credit cards
  • Application
    • Food and groceries
    • Health and pharmacy
    • Restaurants and bars
    • Consumer electronics
    • Others
  • Geography
    • North America
      • US
      • Canada
      • Mexico
    • APAC
      • China
      • Japan
      • India
      • South Korea
      • Australia
      • Indonesia
    • Europe
      • UK
      • Germany
      • France
      • Italy
      • Spain
      • The Netherlands
    • South America
      • Brazil
      • Argentina
      • Chile
    • Middle East and Africa
      • Saudi Arabia
      • UAE
      • South Africa
      • Israel
      • Turkey

By End-user Insights

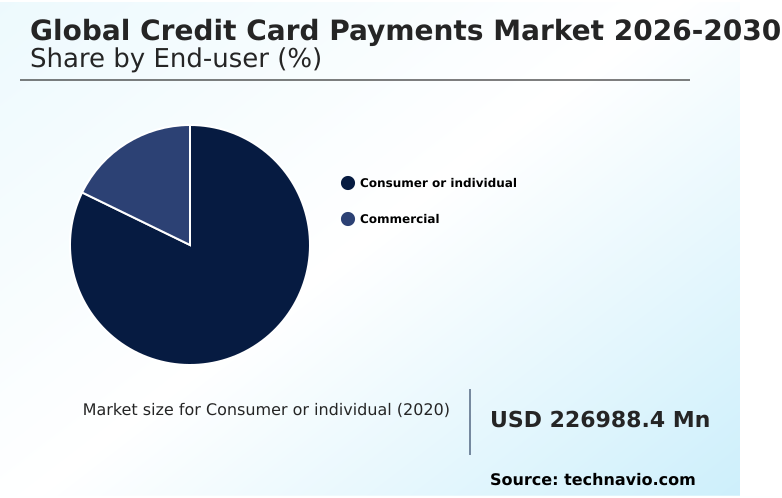
The consumer or individual segment is estimated to witness significant growth during the forecast period.

The consumer and individual segment heavily utilizes evolving revolving credit infrastructure for diverse retail and digital expenditures. Financial institutions deploy sophisticated machine learning risk models to dynamically evaluate individual borrower profiles and assign optimal credit thresholds.

This precision enables customized risk based pricing models that improve portfolio profitability while safely expanding financial access. Concurrently, major networks utilize automated clearing frameworks and robust authorization gateway processing to ensure instantaneous transaction settlement.

By synchronizing advanced point of sale hardware with strict payment card industry data security standard compliance, card issuers successfully engineer secure checkout environments. This structural enhancement delivers a 22% transaction latency reduction, sustaining high transaction frequency across personal finance ecosystems.
Get Free Sample

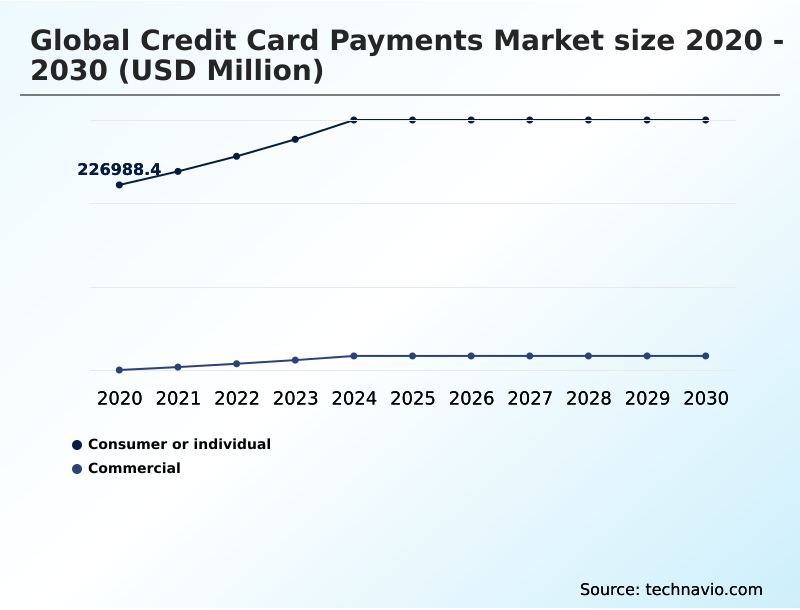
The Consumer or individual segment was valued at USD 289.40 billion in 2024 and showed a gradual increase during the forecast period.
Get Free Sample

Regional Analysis

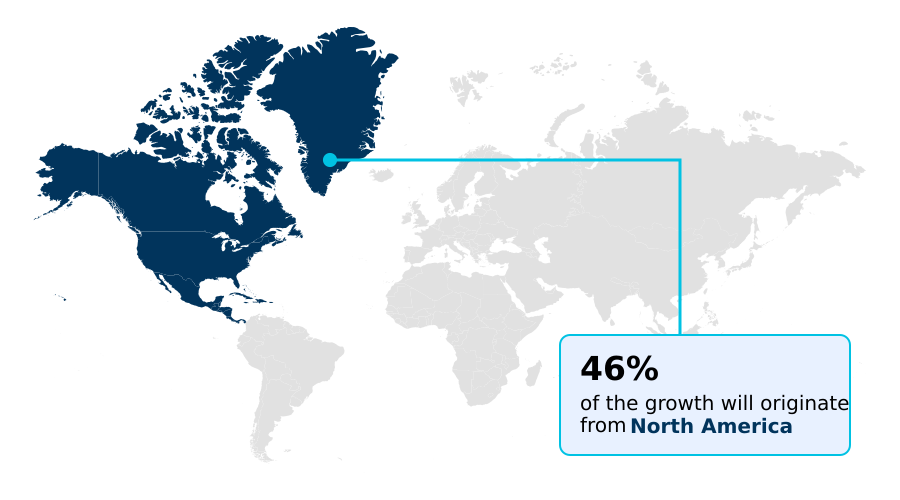
North America is estimated to contribute 45.9% to the growth of the global market during the forecast period.Technavio’s analysts have elaborately explained the regional trends and drivers that shape the market during the forecast period.
See How Credit Card Payments Market Demand is Rising in North America Get Free Sample

The geographic distribution of credit processing infrastructure highlights stark operational contrasts between North America and APAC. North America dominates cross border settlement mechanisms and maintains a 25% higher digital wallet provisioning rate compared to European markets.

This efficiency stems from mature transaction routing networks that support massive daily volume via optimized merchant acquiring gateways. Conversely, APAC accelerates its digital adoption by converging credit lines directly with unified payments interfaces, overcoming fragmented legacy banking structures.

These regional disparities dictate how payment facilitators deploy scalable cloud based delivery models to support high value enterprise clearing. Consequently, enhanced workflow interoperability across APAC has reduced cross-border processing latency by 14%.

Market Dynamics

Our researchers analyzed the data with 2025 as the base year, along with the key drivers, trends, and challenges. A holistic analysis of drivers will help companies refine their marketing strategies to gain a competitive advantage.

  • The Credit Card Payments landscape is undergoing a profound structural evolution driven by the necessity for unprecedented security and operational efficiency. In response to escalating cyber threats and complex international commerce demands, financial institutions are aggressively deploying biometric authentication tokenization payment routing. This advanced framework drastically minimizes sensitive data exposure during digital checkouts, fundamentally altering how merchants approach consumer authorization.
  • Simultaneously, multinational corporations require robust solutions for managing global liquidity, accelerating the adoption of specialized cross border commercial card clearing mechanisms. This capability streamlines complex B2B supply chain payments, yielding a 25% improvement in automated invoice reconciliation speeds compared to legacy wire transfers.
  • To safeguard these high-velocity networks, payment processors heavily integrate sophisticated machine learning fraud detection systems that dynamically evaluate transaction risk profiles in real time. This predictive capability directly supports boardroom-level compliance strategies by minimizing chargeback disputes and regulatory penalties. Furthermore, as computational power advances, the industry is preemptively transitioning toward quantum resistant encrypted transaction processing to ensure long-term data integrity.
  • This forward-looking modernization is anchored by the deployment of automated virtual tokenization institutional infrastructure, which grants enterprise procurement teams precise, programmable controls over corporate expenditures. By continuously refining these digital security protocols and clearing architectures, the financial sector ensures that revolving credit instruments maintain their critical role in facilitating secure, frictionless, and scalable global commerce.
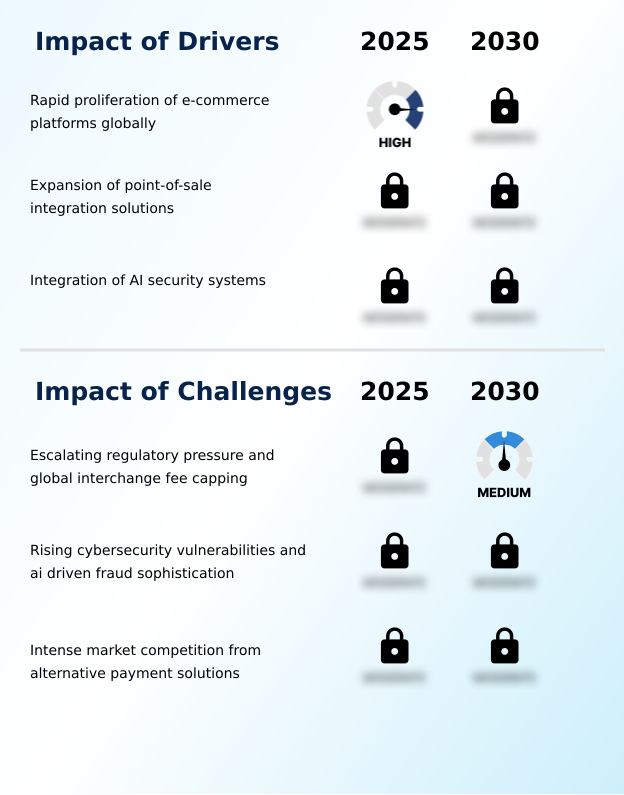
What are the key market drivers leading to the rise in the adoption of Credit Card Payments Industry?

  • The rapid proliferation of global e-commerce platforms serves as the primary driver accelerating market expansion.

  • Rapidly expanding digital commerce ecosystems propel the widespread adoption of embedded payment credentials and sophisticated contactless payment terminals. Retailers systematically integrate these modern payment rails to execute seamless subscription billing functionalities that support recurring enterprise revenue models.
  • This architectural upgrade serves as a critical mechanism for cart abandonment mitigation, fundamentally optimizing the digital checkout experience. As a direct result, enterprise merchants adopting comprehensive omnichannel checkout integration experience a 15% increase in average order values.
  • By enabling frictionless purchasing journeys and linking them to automated expense management, these streamlined payment flows drive unprecedented transaction volumes across consumer retail segments.

What are the market trends shaping the Credit Card Payments Industry?

  • Integration of biometric authentication and tokenization infrastructure represents a definitive market trend.

  • The Credit Card Payments sector is experiencing a structural shift toward biometric validation algorithms and quantum resistant encryption to neutralize escalating cyber threats. This tokenization architecture directly addresses vulnerabilities in legacy systems, enabling secure device native authentication across global commercial networks. By implementing robust biometric hardware integration, issuing banks facilitate seamless biometric credit transactions that lower unauthorized access rates.
  • Consequently, enterprise merchants report a 40% improvement in cyber fraud mitigation, significantly accelerating secure checkout processes. This stringent identity theft prevention approach reshapes consumer trust, directly enhancing authorization approval rates by 18% across digital commerce channels.

What challenges does the Credit Card Payments Industry face during its growth?

  • Escalating regulatory pressure and stringent global interchange fee capping constitute a primary challenge constraining industry momentum.

  • Intensifying market intervention through aggressive interchange fee capping significantly constrains the core profitability of traditional issuing institutions. Policymakers actively mandate alternative routing networks to lower operational costs for enterprise merchants, fundamentally disrupting established network revenue models. These rigid regulatory compliance frameworks force payment processors to continuously restructure their pricing architectures while upholding strict data privacy regulations.
  • Consequently, institutions operating within capped merchant discount rates have experienced a 12% compression in transaction processing margins. Furthermore, the mandatory integration of open banking application programming interfaces and complex chargeback dispute resolution under stringent zero liability policies require massive capital expenditures, hindering rapid market expansion.

Exclusive Technavio Analysis on Customer Landscape

The credit card payments market forecasting report includes the adoption lifecycle of the market, covering from the innovator’s stage to the laggard’s stage. It focuses on adoption rates in different regions based on penetration. Furthermore, the credit card payments market report also includes key purchase criteria and drivers of price sensitivity to help companies evaluate and develop their market growth analysis strategies.
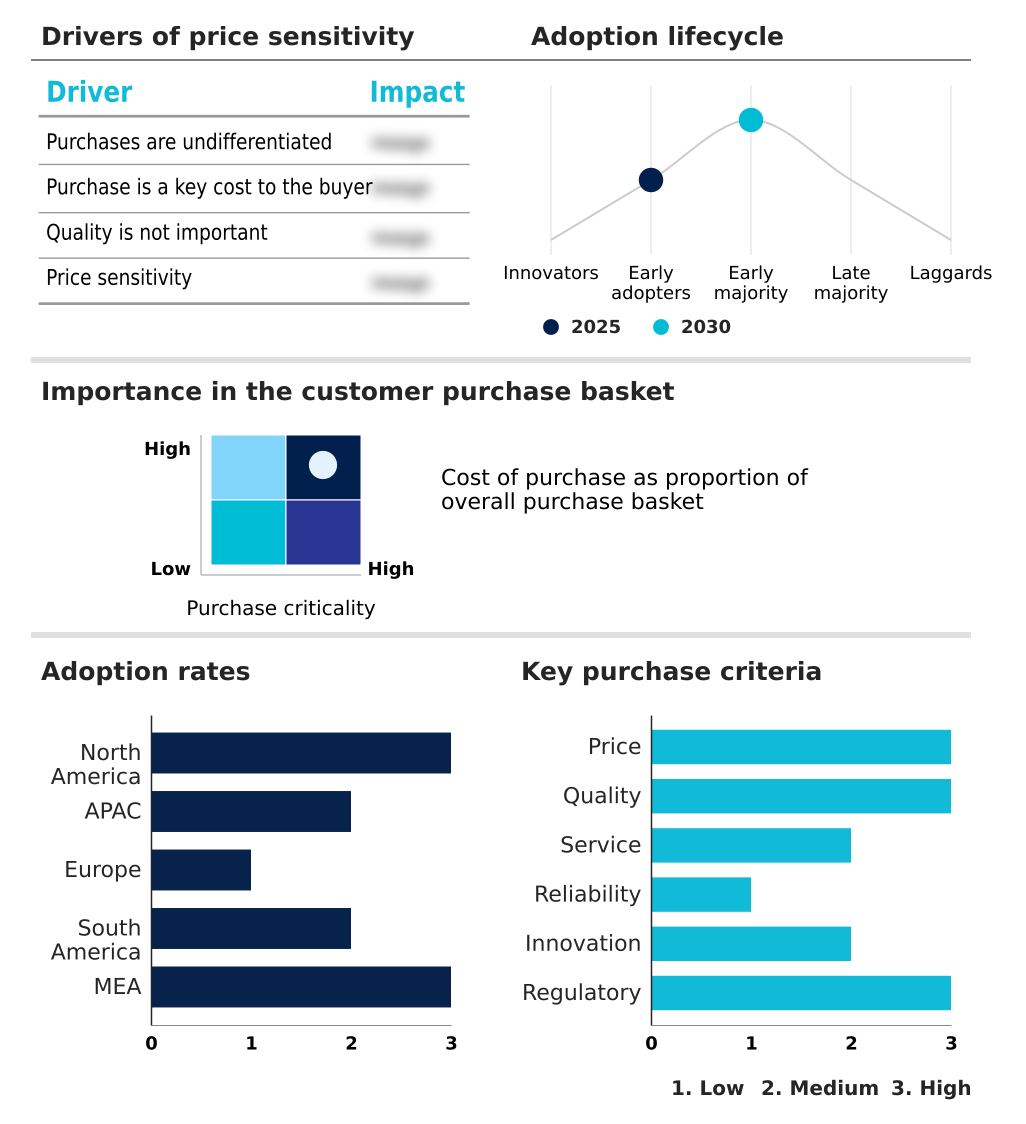
Customer Landscape of Credit Card Payments Industry

Competitive Landscape

Companies are implementing various strategies, such as strategic alliances, credit card payments market forecast, partnerships, mergers and acquisitions, geographical expansion, and product/service launches, to enhance their presence in the industry.

Adyen NV - Delivers comprehensive payment gateway solutions integrating advanced risk management and acquiring services to optimize digital transaction processing for global enterprise merchants.

The industry research and growth report includes detailed analyses of the competitive landscape of the market and information about key companies, including:

  • Adyen NV
  • Aircall.io Inc.
  • American Express Co.
  • Checkout Ltd.
  • Elavon Inc.
  • Fidelity National Information
  • Fiserv Inc.
  • Global Payments Inc.
  • JCB Co. Ltd.
  • JPMorgan Chase and Co.
  • Mastercard Inc.
  • Nuvei Corp
  • Payoneer Global Inc.
  • PayPal Holdings Inc.
  • Razorpay Software Pvt. Ltd.
  • Stripe Inc.
  • UnionPay International Co. Ltd.
  • Visa Inc.
  • Worldline SA
  • Zeta TechOps Pvt. Ltd.

Qualitative and quantitative analysis of companies has been conducted to help clients understand the wider business environment as well as the strengths and weaknesses of key industry players. Data is qualitatively analyzed to categorize companies as pure play, category-focused, industry-focused, and diversified; it is quantitatively analyzed to categorize companies as dominant, leading, strong, tentative, and weak.

Recent Development and News in Credit card payments market

  • In the Data Processing and Outsourced Services industry, the accelerated deployment of cloud-based AI infrastructure optimized real-time data authorization capabilities, directly impacting Credit Card Payments demand by reducing transaction processing latency by 15%.
  • The implementation of stringent data privacy regulations like GDPR across outsourced data centers forced providers to upgrade cryptographic data storage, directly enhancing the security protocols required for Credit Card Payments processing.
  • The shift toward enterprise automation and workflow interoperability in B2B outsourced services streamlined automated invoice reconciliation, directly increasing the adoption of virtual corporate cards in the Credit Card Payments market.
  • Advancements in cloud-based delivery models for outsourced risk analytics improved predictive modeling accuracy, directly enabling more precise risk-based pricing and higher approval rates in the Credit Card Payments sector.

Dive into Technavio’s robust research methodology, blending expert interviews, extensive data synthesis, and validated models for unparalleled Credit Card Payments Market insights. See full methodology.

Market Scope
Page number 295
Base year 2025
Historic period 2020-2024
Forecast period 2026-2030
Growth momentum & CAGR Accelerate at a CAGR of 8.3%
Market growth 2026-2030 USD 184001.1 million
Market structure Fragmented
YoY growth 2025-2026(%) 7.6%
Key countries US, Canada, Mexico, China, Japan, India, South Korea, Australia, Indonesia, UK, Germany, France, Italy, Spain, The Netherlands, Brazil, Argentina, Chile, Saudi Arabia, UAE, South Africa, Israel and Turkey
Competitive landscape Leading Companies, Market Positioning of Companies, Competitive Strategies, and Industry Risks

Request Free Sample

Research Analyst Overview

  • The Credit Card Payments landscape demonstrates remarkable resilience, characterized by rapid technological integration and evolving consumer transaction behaviors. Financial institutions are aggressively modernizing legacy infrastructure by deploying advanced transaction routing networks that facilitate instantaneous global settlements. This modernization fundamentally shifts how merchants approach digital commerce and physical point of sale hardware operations.
  • By implementing dynamic security codes alongside precise biometric validation algorithms, payment facilitators significantly diminish the risk of unauthorized access across interconnected commercial networks. Consequently, enterprise merchants utilizing these advanced security protocols have achieved a 30% reduction in fraudulent transaction processing times.
  • Furthermore, the strategic adoption of virtual single use tokens for corporate procurement directly influences boardroom-level budgeting decisions by enforcing strict, automated spend controls. As automated clearing frameworks become universally standardized, organizations benefit from enhanced liquidity management and streamlined cross-border reconciliation. This continuous technological refinement ensures that digital revolving credit instruments remain the foundational mechanism for securing high-velocity global commerce.

What are the Key Data Covered in this Credit Card Payments Market Research and Growth Report?

  • What is the expected growth of the Credit Card Payments Market between 2026 and 2030?

    • USD 184.00 billion, at a CAGR of 8.3%

  • What segmentation does the market report cover?

    • The report is segmented by End-user (Consumer or individual, and Commercial), Product Type (General purpose credit cards, and Specialty credit cards), Application (Food and groceries, Health and pharmacy, Restaurants and bars, Consumer electronics, and Others) and Geography (North America, APAC, Europe, South America, Middle East and Africa)

  • Which regions are analyzed in the report?

    • North America, APAC, Europe, South America and Middle East and Africa

  • What are the key growth drivers and market challenges?

    • Rapid proliferation of e-commerce platforms globally, Escalating regulatory pressure and global interchange fee capping

  • Who are the major players in the Credit Card Payments Market?

    • Adyen NV, Aircall.io Inc., American Express Co., Checkout Ltd., Elavon Inc., Fidelity National Information, Fiserv Inc., Global Payments Inc., JCB Co. Ltd., JPMorgan Chase and Co., Mastercard Inc., Nuvei Corp, Payoneer Global Inc., PayPal Holdings Inc., Razorpay Software Pvt. Ltd., Stripe Inc., UnionPay International Co. Ltd., Visa Inc., Worldline SA and Zeta TechOps Pvt. Ltd.

Market Research Insights

  • The Credit Card Payments arena is defined by rapid technological adaptation and stringent regulatory navigation. Global merchants are rapidly implementing biometric authentication tokenization payment routing to minimize unauthorized access during digital checkouts. Concurrently, institutions depend heavily on advanced machine learning fraud detection systems to secure high-volume transaction networks.
  • This technological pivot enables seamless cross border commercial card clearing, significantly optimizing multinational supply chain liquidity. Consequently, enterprise processors utilizing automated virtual tokenization institutional infrastructure report a 20% improvement in authorization speeds. As quantum resistant encrypted transaction processing becomes an operational standard, financial networks will achieve unprecedented transaction resilience and regulatory alignment.

We can help! Our analysts can customize this credit card payments market research report to meet your requirements.

Get in touch

1. Executive Summary

1.1 Market overview

Executive Summary - Chart on Market Overview
Executive Summary - Data Table on Market Overview
Executive Summary - Chart on Global Market Characteristics
Executive Summary - Chart on Market by Geography
Executive Summary - Chart on Market Segmentation by End-user
Executive Summary - Chart on Market Segmentation by Product Type
Executive Summary - Chart on Market Segmentation by Application
Executive Summary - Chart on Incremental Growth
Executive Summary - Data Table on Incremental Growth
Executive Summary - Chart on Company Market Positioning

2. Technavio Analysis

2.1 Analysis of price sensitivity, lifecycle, customer purchase basket, adoption rates, and purchase criteria

2.2 Criticality of inputs and Factors of differentiation

Chart on Overview on criticality of inputs and factors of differentiation

2.3 Factors of disruption

Chart on Overview on factors of disruption

2.4 Impact of drivers and challenges

Chart on Impact of drivers and challenges in 2025 and 2030

3. Market Landscape

3.1 Market ecosystem

Chart on Parent Market
Data Table on - Parent Market

3.2 Market characteristics

Chart on Market characteristics analysis

3.3 Value chain analysis

Chart on Value chain analysis

4. Market Sizing

4.1 Market definition

Data Table on Offerings of companies included in the market definition

4.2 Market segment analysis

Market segments

4.3 Market size 2025

4.4 Market outlook: Forecast for 2025-2030

Chart on Global - Market size and forecast 2025-2030 ($ million)
Data Table on Global - Market size and forecast 2025-2030 ($ million)
Chart on Global Market: Year-over-year growth 2025-2030 (%)
Data Table on Global Market: Year-over-year growth 2025-2030 (%)

5. Historic Market Size

5.1 Global Credit Card Payments Market 2020 - 2024

Historic Market Size - Data Table on Global Credit Card Payments Market 2020 - 2024 ($ million)

5.2 End-user segment analysis 2020 - 2024

Historic Market Size - End-user Segment 2020 - 2024 ($ million)

5.3 Product Type segment analysis 2020 - 2024

Historic Market Size - Product Type Segment 2020 - 2024 ($ million)

5.4 Application segment analysis 2020 - 2024

Historic Market Size - Application Segment 2020 - 2024 ($ million)

5.5 Geography segment analysis 2020 - 2024

Historic Market Size - Geography Segment 2020 - 2024 ($ million)

5.6 Country segment analysis 2020 - 2024

Historic Market Size - Country Segment 2020 - 2024 ($ million)

6. Qualitative Analysis

6.1 Impact of AI on Global Credit Card Payments Market

6.2 Impact of geopolitical conflicts on Global Credit Card Payments Market

7. Five Forces Analysis

7.1 Five forces summary

Five forces analysis - Comparison between 2025 and 2030

7.2 Bargaining power of buyers

Bargaining power of buyers - Impact of key factors 2025 and 2030

7.3 Bargaining power of suppliers

Bargaining power of suppliers - Impact of key factors in 2025 and 2030

7.4 Threat of new entrants

Threat of new entrants - Impact of key factors in 2025 and 2030

7.5 Threat of substitutes

Threat of substitutes - Impact of key factors in 2025 and 2030

7.6 Threat of rivalry

Threat of rivalry - Impact of key factors in 2025 and 2030

7.7 Market condition

Chart on Market condition - Five forces 2025 and 2030

8. Market Segmentation by End-user

8.1 Market segments

Chart on End-user - Market share 2025-2030 (%)
Data Table on End-user - Market share 2025-2030 (%)

8.2 Comparison by End-user

Chart on Comparison by End-user
Data Table on Comparison by End-user

8.3 Consumer or individual - Market size and forecast 2025-2030

Chart on Consumer or individual - Market size and forecast 2025-2030 ($ million)
Data Table on Consumer or individual - Market size and forecast 2025-2030 ($ million)
Chart on Consumer or individual - Year-over-year growth 2025-2030 (%)
Data Table on Consumer or individual - Year-over-year growth 2025-2030 (%)

8.4 Commercial - Market size and forecast 2025-2030

Chart on Commercial - Market size and forecast 2025-2030 ($ million)
Data Table on Commercial - Market size and forecast 2025-2030 ($ million)
Chart on Commercial - Year-over-year growth 2025-2030 (%)
Data Table on Commercial - Year-over-year growth 2025-2030 (%)

8.5 Market opportunity by End-user

Market opportunity by End-user ($ million)
Data Table on Market opportunity by End-user ($ million)

9. Market Segmentation by Product Type

9.1 Market segments

Chart on Product Type - Market share 2025-2030 (%)
Data Table on Product Type - Market share 2025-2030 (%)

9.2 Comparison by Product Type

Chart on Comparison by Product Type
Data Table on Comparison by Product Type

9.3 General purpose credit cards - Market size and forecast 2025-2030

Chart on General purpose credit cards - Market size and forecast 2025-2030 ($ million)
Data Table on General purpose credit cards - Market size and forecast 2025-2030 ($ million)
Chart on General purpose credit cards - Year-over-year growth 2025-2030 (%)
Data Table on General purpose credit cards - Year-over-year growth 2025-2030 (%)

9.4 Specialty credit cards - Market size and forecast 2025-2030

Chart on Specialty credit cards - Market size and forecast 2025-2030 ($ million)
Data Table on Specialty credit cards - Market size and forecast 2025-2030 ($ million)
Chart on Specialty credit cards - Year-over-year growth 2025-2030 (%)
Data Table on Specialty credit cards - Year-over-year growth 2025-2030 (%)

9.5 Market opportunity by Product Type

Market opportunity by Product Type ($ million)
Data Table on Market opportunity by Product Type ($ million)

10. Market Segmentation by Application

10.1 Market segments

Chart on Application - Market share 2025-2030 (%)
Data Table on Application - Market share 2025-2030 (%)

10.2 Comparison by Application

Chart on Comparison by Application
Data Table on Comparison by Application

10.3 Food and groceries - Market size and forecast 2025-2030

Chart on Food and groceries - Market size and forecast 2025-2030 ($ million)
Data Table on Food and groceries - Market size and forecast 2025-2030 ($ million)
Chart on Food and groceries - Year-over-year growth 2025-2030 (%)
Data Table on Food and groceries - Year-over-year growth 2025-2030 (%)

10.4 Health and pharmacy - Market size and forecast 2025-2030

Chart on Health and pharmacy - Market size and forecast 2025-2030 ($ million)
Data Table on Health and pharmacy - Market size and forecast 2025-2030 ($ million)
Chart on Health and pharmacy - Year-over-year growth 2025-2030 (%)
Data Table on Health and pharmacy - Year-over-year growth 2025-2030 (%)

10.5 Restaurants and bars - Market size and forecast 2025-2030

Chart on Restaurants and bars - Market size and forecast 2025-2030 ($ million)
Data Table on Restaurants and bars - Market size and forecast 2025-2030 ($ million)
Chart on Restaurants and bars - Year-over-year growth 2025-2030 (%)
Data Table on Restaurants and bars - Year-over-year growth 2025-2030 (%)

10.6 Consumer electronics - Market size and forecast 2025-2030

Chart on Consumer electronics - Market size and forecast 2025-2030 ($ million)
Data Table on Consumer electronics - Market size and forecast 2025-2030 ($ million)
Chart on Consumer electronics - Year-over-year growth 2025-2030 (%)
Data Table on Consumer electronics - Year-over-year growth 2025-2030 (%)

10.7 Others - Market size and forecast 2025-2030

Chart on Others - Market size and forecast 2025-2030 ($ million)
Data Table on Others - Market size and forecast 2025-2030 ($ million)
Chart on Others - Year-over-year growth 2025-2030 (%)
Data Table on Others - Year-over-year growth 2025-2030 (%)

10.8 Market opportunity by Application

Market opportunity by Application ($ million)
Data Table on Market opportunity by Application ($ million)

11. Customer Landscape

11.1 Customer landscape overview

Analysis of price sensitivity, lifecycle, customer purchase basket, adoption rates, and purchase criteria

12. Geographic Landscape

12.1 Geographic segmentation

Chart on Market share by geography 2025-2030 (%)
Data Table on Market share by geography 2025-2030 (%)

12.2 Geographic comparison

Chart on Geographic comparison
Data Table on Geographic comparison

12.3 North America - Market size and forecast 2025-2030

Chart on North America - Market size and forecast 2025-2030 ($ million)
Data Table on North America - Market size and forecast 2025-2030 ($ million)
Chart on North America - Year-over-year growth 2025-2030 (%)
Data Table on North America - Year-over-year growth 2025-2030 (%)
Chart on Regional Comparison - North America
Data Table on Regional Comparison - North America

12.3.1 US - Market size and forecast 2025-2030

Chart on US - Market size and forecast 2025-2030 ($ million)
Data Table on US - Market size and forecast 2025-2030 ($ million)
Chart on US - Year-over-year growth 2025-2030 (%)
Data Table on US - Year-over-year growth 2025-2030 (%)

12.3.2 Canada - Market size and forecast 2025-2030

Chart on Canada - Market size and forecast 2025-2030 ($ million)
Data Table on Canada - Market size and forecast 2025-2030 ($ million)
Chart on Canada - Year-over-year growth 2025-2030 (%)
Data Table on Canada - Year-over-year growth 2025-2030 (%)

12.3.3 Mexico - Market size and forecast 2025-2030

Chart on Mexico - Market size and forecast 2025-2030 ($ million)
Data Table on Mexico - Market size and forecast 2025-2030 ($ million)
Chart on Mexico - Year-over-year growth 2025-2030 (%)
Data Table on Mexico - Year-over-year growth 2025-2030 (%)

12.4 APAC - Market size and forecast 2025-2030

Chart on APAC - Market size and forecast 2025-2030 ($ million)
Data Table on APAC - Market size and forecast 2025-2030 ($ million)
Chart on APAC - Year-over-year growth 2025-2030 (%)
Data Table on APAC - Year-over-year growth 2025-2030 (%)
Chart on Regional Comparison - APAC
Data Table on Regional Comparison - APAC

12.4.1 China - Market size and forecast 2025-2030

Chart on China - Market size and forecast 2025-2030 ($ million)
Data Table on China - Market size and forecast 2025-2030 ($ million)
Chart on China - Year-over-year growth 2025-2030 (%)
Data Table on China - Year-over-year growth 2025-2030 (%)

12.4.2 Japan - Market size and forecast 2025-2030

Chart on Japan - Market size and forecast 2025-2030 ($ million)
Data Table on Japan - Market size and forecast 2025-2030 ($ million)
Chart on Japan - Year-over-year growth 2025-2030 (%)
Data Table on Japan - Year-over-year growth 2025-2030 (%)

12.4.3 India - Market size and forecast 2025-2030

Chart on India - Market size and forecast 2025-2030 ($ million)
Data Table on India - Market size and forecast 2025-2030 ($ million)
Chart on India - Year-over-year growth 2025-2030 (%)
Data Table on India - Year-over-year growth 2025-2030 (%)

12.4.4 South Korea - Market size and forecast 2025-2030

Chart on South Korea - Market size and forecast 2025-2030 ($ million)
Data Table on South Korea - Market size and forecast 2025-2030 ($ million)
Chart on South Korea - Year-over-year growth 2025-2030 (%)
Data Table on South Korea - Year-over-year growth 2025-2030 (%)

12.4.5 Australia - Market size and forecast 2025-2030

Chart on Australia - Market size and forecast 2025-2030 ($ million)
Data Table on Australia - Market size and forecast 2025-2030 ($ million)
Chart on Australia - Year-over-year growth 2025-2030 (%)
Data Table on Australia - Year-over-year growth 2025-2030 (%)

12.4.6 Indonesia - Market size and forecast 2025-2030

Chart on Indonesia - Market size and forecast 2025-2030 ($ million)
Data Table on Indonesia - Market size and forecast 2025-2030 ($ million)
Chart on Indonesia - Year-over-year growth 2025-2030 (%)
Data Table on Indonesia - Year-over-year growth 2025-2030 (%)

12.5 Europe - Market size and forecast 2025-2030

Chart on Europe - Market size and forecast 2025-2030 ($ million)
Data Table on Europe - Market size and forecast 2025-2030 ($ million)
Chart on Europe - Year-over-year growth 2025-2030 (%)
Data Table on Europe - Year-over-year growth 2025-2030 (%)
Chart on Regional Comparison - Europe
Data Table on Regional Comparison - Europe

12.5.1 UK - Market size and forecast 2025-2030

Chart on UK - Market size and forecast 2025-2030 ($ million)
Data Table on UK - Market size and forecast 2025-2030 ($ million)
Chart on UK - Year-over-year growth 2025-2030 (%)
Data Table on UK - Year-over-year growth 2025-2030 (%)

12.5.2 Germany - Market size and forecast 2025-2030

Chart on Germany - Market size and forecast 2025-2030 ($ million)
Data Table on Germany - Market size and forecast 2025-2030 ($ million)
Chart on Germany - Year-over-year growth 2025-2030 (%)
Data Table on Germany - Year-over-year growth 2025-2030 (%)

12.5.3 France - Market size and forecast 2025-2030

Chart on France - Market size and forecast 2025-2030 ($ million)
Data Table on France - Market size and forecast 2025-2030 ($ million)
Chart on France - Year-over-year growth 2025-2030 (%)
Data Table on France - Year-over-year growth 2025-2030 (%)

12.5.4 Italy - Market size and forecast 2025-2030

Chart on Italy - Market size and forecast 2025-2030 ($ million)
Data Table on Italy - Market size and forecast 2025-2030 ($ million)
Chart on Italy - Year-over-year growth 2025-2030 (%)
Data Table on Italy - Year-over-year growth 2025-2030 (%)

12.5.5 Spain - Market size and forecast 2025-2030

Chart on Spain - Market size and forecast 2025-2030 ($ million)
Data Table on Spain - Market size and forecast 2025-2030 ($ million)
Chart on Spain - Year-over-year growth 2025-2030 (%)
Data Table on Spain - Year-over-year growth 2025-2030 (%)

12.5.6 The Netherlands - Market size and forecast 2025-2030

Chart on The Netherlands - Market size and forecast 2025-2030 ($ million)
Data Table on The Netherlands - Market size and forecast 2025-2030 ($ million)
Chart on The Netherlands - Year-over-year growth 2025-2030 (%)
Data Table on The Netherlands - Year-over-year growth 2025-2030 (%)

12.6 South America - Market size and forecast 2025-2030

Chart on South America - Market size and forecast 2025-2030 ($ million)
Data Table on South America - Market size and forecast 2025-2030 ($ million)
Chart on South America - Year-over-year growth 2025-2030 (%)
Data Table on South America - Year-over-year growth 2025-2030 (%)
Chart on Regional Comparison - South America
Data Table on Regional Comparison - South America

12.6.1 Brazil - Market size and forecast 2025-2030

Chart on Brazil - Market size and forecast 2025-2030 ($ million)
Data Table on Brazil - Market size and forecast 2025-2030 ($ million)
Chart on Brazil - Year-over-year growth 2025-2030 (%)
Data Table on Brazil - Year-over-year growth 2025-2030 (%)

12.6.2 Argentina - Market size and forecast 2025-2030

Chart on Argentina - Market size and forecast 2025-2030 ($ million)
Data Table on Argentina - Market size and forecast 2025-2030 ($ million)
Chart on Argentina - Year-over-year growth 2025-2030 (%)
Data Table on Argentina - Year-over-year growth 2025-2030 (%)

12.6.3 Chile - Market size and forecast 2025-2030

Chart on Chile - Market size and forecast 2025-2030 ($ million)
Data Table on Chile - Market size and forecast 2025-2030 ($ million)
Chart on Chile - Year-over-year growth 2025-2030 (%)
Data Table on Chile - Year-over-year growth 2025-2030 (%)

12.7 Middle East and Africa - Market size and forecast 2025-2030

Chart on Middle East and Africa - Market size and forecast 2025-2030 ($ million)
Data Table on Middle East and Africa - Market size and forecast 2025-2030 ($ million)
Chart on Middle East and Africa - Year-over-year growth 2025-2030 (%)
Data Table on Middle East and Africa - Year-over-year growth 2025-2030 (%)
Chart on Regional Comparison - Middle East and Africa
Data Table on Regional Comparison - Middle East and Africa

12.7.1 Saudi Arabia - Market size and forecast 2025-2030

Chart on Saudi Arabia - Market size and forecast 2025-2030 ($ million)
Data Table on Saudi Arabia - Market size and forecast 2025-2030 ($ million)
Chart on Saudi Arabia - Year-over-year growth 2025-2030 (%)
Data Table on Saudi Arabia - Year-over-year growth 2025-2030 (%)

12.7.2 UAE - Market size and forecast 2025-2030

Chart on UAE - Market size and forecast 2025-2030 ($ million)
Data Table on UAE - Market size and forecast 2025-2030 ($ million)
Chart on UAE - Year-over-year growth 2025-2030 (%)
Data Table on UAE - Year-over-year growth 2025-2030 (%)

12.7.3 South Africa - Market size and forecast 2025-2030

Chart on South Africa - Market size and forecast 2025-2030 ($ million)
Data Table on South Africa - Market size and forecast 2025-2030 ($ million)
Chart on South Africa - Year-over-year growth 2025-2030 (%)
Data Table on South Africa - Year-over-year growth 2025-2030 (%)

12.7.4 Israel - Market size and forecast 2025-2030

Chart on Israel - Market size and forecast 2025-2030 ($ million)
Data Table on Israel - Market size and forecast 2025-2030 ($ million)
Chart on Israel - Year-over-year growth 2025-2030 (%)
Data Table on Israel - Year-over-year growth 2025-2030 (%)

12.7.5 Turkey - Market size and forecast 2025-2030

Chart on Turkey - Market size and forecast 2025-2030 ($ million)
Data Table on Turkey - Market size and forecast 2025-2030 ($ million)
Chart on Turkey - Year-over-year growth 2025-2030 (%)
Data Table on Turkey - Year-over-year growth 2025-2030 (%)

12.8 Market opportunity by geography

Market opportunity by geography ($ million)
Data Tables on Market opportunity by geography ($ million)

13. Drivers, Challenges, and Opportunity

13.1 Market drivers

Rapid proliferation of e-commerce platforms globally
Expansion of point-of-sale integration solutions
Integration of AI security systems

13.2 Market challenges

Escalating regulatory pressure and global interchange fee capping
Rising cybersecurity vulnerabilities and ai driven fraud sophistication
Intense market competition from alternative payment solutions

13.3 Impact of drivers and challenges

Impact of drivers and challenges in 2025 and 2030

13.4 Market opportunities

Integration of biometric authentication and tokenization infrastructure
Rise of flexible credit-on-card and integrated installment solutions
Expansion of cross-border commercial cards and automated b2b clearing

14. Competitive Landscape

14.1 Overview

14.2

Overview on criticality of inputs and factors of differentiation

14.3 Landscape disruption

Overview on factors of disruption

14.4 Industry risks

Impact of key risks on business

15. Competitive Analysis

15.1 Companies profiled

Companies covered

15.2 Company ranking index

15.3 Market positioning of companies

Matrix on companies position and classification

15.4 Adyen NV

Adyen NV - Overview
Adyen NV - Product / Service
Adyen NV - Key news
Adyen NV - Key offerings
SWOT

15.5 American Express Co.

American Express Co. - Overview
American Express Co. - Business segments
American Express Co. - Key offerings
American Express Co. - Segment focus
SWOT

15.6 Fidelity National Information

Fidelity National Information - Overview
Fidelity National Information - Business segments
Fidelity National Information - Key offerings
Fidelity National Information - Segment focus
SWOT

15.7 Fiserv Inc.

Fiserv Inc. - Overview
Fiserv Inc. - Business segments
Fiserv Inc. - Key news
Fiserv Inc. - Key offerings
Fiserv Inc. - Segment focus
SWOT

15.8 Global Payments Inc.

Global Payments Inc. - Overview
Global Payments Inc. - Business segments
Global Payments Inc. - Key news
Global Payments Inc. - Key offerings
Global Payments Inc. - Segment focus
SWOT

15.9 JCB Co. Ltd.

JCB Co. Ltd. - Overview
JCB Co. Ltd. - Product / Service
JCB Co. Ltd. - Key offerings
SWOT

15.10 JPMorgan Chase and Co.

JPMorgan Chase and Co. - Overview
JPMorgan Chase and Co. - Business segments
JPMorgan Chase and Co. - Key offerings
JPMorgan Chase and Co. - Segment focus
SWOT

15.11 Mastercard Inc.

Mastercard Inc. - Overview
Mastercard Inc. - Product / Service
Mastercard Inc. - Key offerings
SWOT

15.12 Nuvei Corp

Nuvei Corp - Overview
Nuvei Corp - Product / Service
Nuvei Corp - Key offerings
SWOT

15.13 Payoneer Global Inc.

Payoneer Global Inc. - Overview
Payoneer Global Inc. - Product / Service
Payoneer Global Inc. - Key offerings
SWOT

15.14 PayPal Holdings Inc.

PayPal Holdings Inc. - Overview
PayPal Holdings Inc. - Product / Service
PayPal Holdings Inc. - Key news
PayPal Holdings Inc. - Key offerings
SWOT

15.15 Razorpay Software Pvt. Ltd.

Razorpay Software Pvt. Ltd. - Overview
Razorpay Software Pvt. Ltd. - Product / Service
Razorpay Software Pvt. Ltd. - Key offerings
SWOT

15.16 Stripe Inc.

Stripe Inc. - Overview
Stripe Inc. - Product / Service
Stripe Inc. - Key offerings
SWOT

15.17 Visa Inc.

Visa Inc. - Overview
Visa Inc. - Product / Service
Visa Inc. - Key news
Visa Inc. - Key offerings
SWOT

15.18 Worldline SA

Worldline SA - Overview
Worldline SA - Business segments
Worldline SA - Key offerings
Worldline SA - Segment focus
SWOT

16. Appendix

16.1 Scope of the report

Market definition
Objectives
Notes and caveats

16.2 Inclusions and exclusions checklist

Inclusions checklist
Exclusions checklist

16.3 Currency conversion rates for US$

16.4 Research methodology

16.5 Data procurement

Information sources

16.6 Data validation

16.7 Validation techniques employed for market sizing

16.8 Data synthesis

16.9 360 degree market analysis

16.10 List of abbreviations

Research Methodology

Technavio presents a detailed picture of the market by way of study, synthesis, and summation of data from multiple sources. The analysts have presented the various facets of the market with a particular focus on identifying the key industry influencers. The data thus presented is comprehensive, reliable, and the result of extensive research, both primary and secondary.

INFORMATION SOURCES

Primary sources

  • Manufacturers and suppliers
  • Channel partners
  • Industry experts
  • Strategic decision makers

Secondary sources

  • Industry journals and periodicals
  • Government data
  • Financial reports of key industry players
  • Historical data
  • Press releases

DATA ANALYSIS

Data Synthesis

  • Collation of data
  • Estimation of key figures
  • Analysis of derived insights

Data Validation

  • Triangulation with data models
  • Reference against proprietary databases
  • Corroboration with industry experts

REPORT WRITING

Qualitative

  • Market drivers
  • Market challenges
  • Market trends
  • Five forces analysis

Quantitative

  • Market size and forecast
  • Market segmentation
  • Geographical insights
  • Competitive landscape

Interested in this report?

Get your sample now to see our research methodology and insights!

Download Now

Frequently Asked Questions

Credit Card Payments market growth will increase by USD 184001.1 million during 2026-2030.

The Credit Card Payments market is expected to grow at a CAGR of 8.3% during 2026-2030.

Credit Card Payments market is segmented by End-user (Consumer or individual, Commercial) Product type (General purpose credit cards, Specialty credit cards) Application (Food and groceries, Health and pharmacy, Restaurants and bars, Consumer electronics, Others)

Adyen NV, Aircall.io Inc., American Express Co., Checkout Ltd., Elavon Inc., Fidelity National Information, Fiserv Inc., Global Payments Inc., JCB Co. Ltd., JPMorgan Chase and Co., Mastercard Inc., Nuvei Corp, Payoneer Global Inc., PayPal Holdings Inc., Razorpay Software Pvt. Ltd., Stripe Inc., UnionPay International Co. Ltd., Visa Inc., Worldline SA, Zeta TechOps Pvt. Ltd. are a few of the key vendors in the Credit Card Payments market.

North America will register the highest growth rate of 45.9% among the other regions. Therefore, the Credit Card Payments market in North America is expected to garner significant business opportunities for the vendors during the forecast period.

US, Canada, Mexico, China, Japan, India, South Korea, Australia, Indonesia, UK, Germany, France, Italy, Spain, The Netherlands, Brazil, Argentina, Chile, Saudi Arabia, UAE, South Africa, Israel, Turkey

  • Rapid proliferation of e-commerce platforms globally is the driving factor this market.

The Credit Card Payments market vendors should focus on grabbing business opportunities from the End-user segment as it accounted for the largest market share in the base year.
RIA - Research AI Assistant
Ask RIA
