Smart Home Appliances Market Analysis, Size, and Forecast 2026-2030: North America (US, Canada, and Mexico), Europe (Germany, UK, and France), APAC (China, Japan, and India), South America (Brazil, Argentina, and Colombia), Middle East and Africa (Saudi Arabia, UAE, and Israel), and Rest of World (ROW)

Smart Home Appliances Market Analysis, Size, and Forecast 2026-2030:
North America (US, Canada, and Mexico), Europe (Germany, UK, and France), APAC (China, Japan, and India), South America (Brazil, Argentina, and Colombia), Middle East and Africa (Saudi Arabia, UAE, and Israel), and Rest of World (ROW)

Published: Mar 2026 306 Pages SKU: IRTNTR40419

Market Overview at a Glance

$98.02 B
Market Opportunity
20.6%
CAGR 2025 - 2030
39.7%
North America Growth
$25.92 B
SWMD segment 2024

Smart Home Appliances Market Size 2026-2030

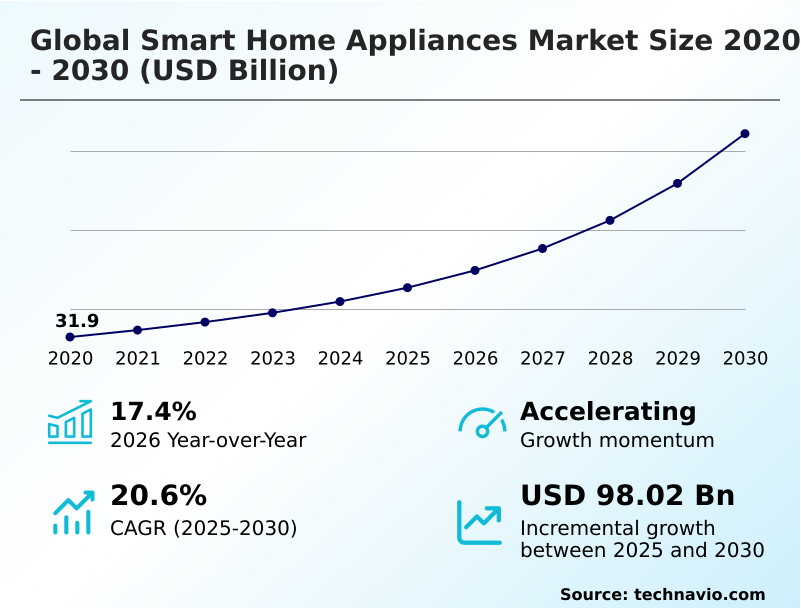
The smart home appliances market size is valued to increase by USD 98.02 billion, at a CAGR of 20.6% from 2025 to 2030. Rising consumer preference for connected and automated living environments will drive the smart home appliances market.

Major Market Trends & Insights

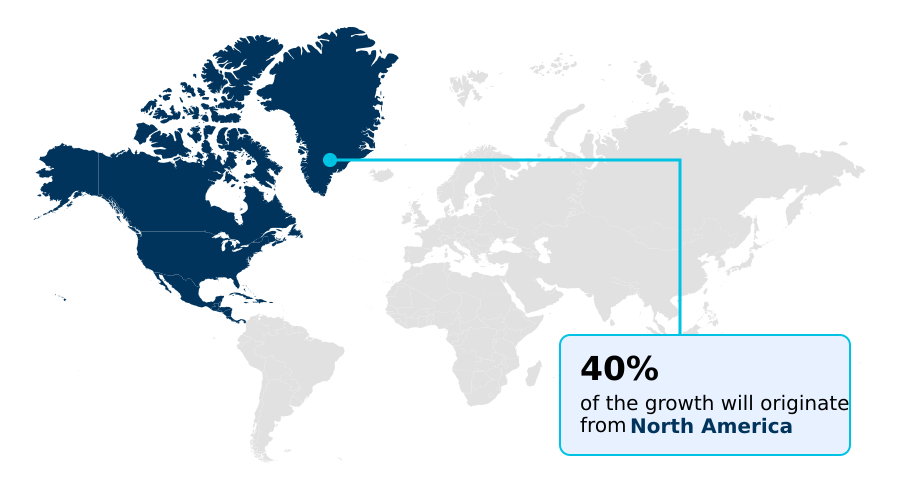
  • North America dominated the market and accounted for a 39.7% growth during the forecast period.
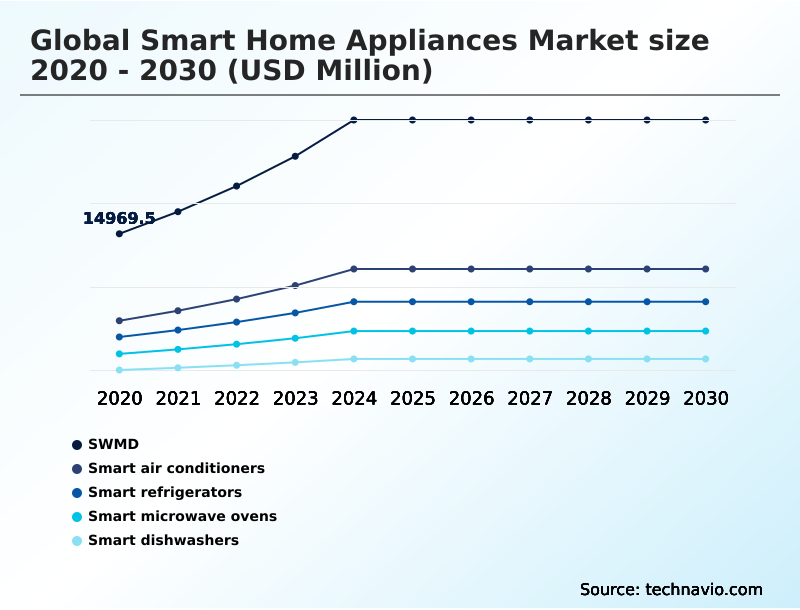
  • By Product - SWMD segment was valued at USD 25.92 billion in 2024
  • By Distribution Channel - Offline segment accounted for the largest market revenue share in 2024

Market Size & Forecast

  • Market Opportunities: USD 129.41 billion
  • Market Future Opportunities: USD 98.02 billion
  • CAGR from 2025 to 2030 : 20.6%

Market Summary

  • The smart home appliances market is evolving from standalone connected devices to fully integrated smart home ecosystems where appliances function as intelligent components. This shift is driven by consumer demand for convenience, energy efficiency, and enhanced control over their living environments.
  • The integration of advanced technologies like AI and IoT allows for features such as predictive maintenance algorithms, which can anticipate hardware failures and schedule service, and sophisticated energy management systems that optimize consumption based on utility rates and household routines.
  • For instance, in a commercial residential setting, a property manager can use a central dashboard to monitor the status of smart HVAC systems across hundreds of units, preemptively addressing issues and reducing maintenance overhead. However, achieving seamless cross-device communication remains a challenge due to fragmented interoperability standards for IoT.
  • The development of AI-powered refrigerators that automate grocery lists and the increasing prevalence of voice control for home appliances highlight the industry's focus on creating user-centric, automated living experiences. Addressing smart home data privacy concerns is crucial for building consumer trust and fostering wider adoption of these interconnected technologies.

What will be the Size of the Smart Home Appliances Market during the forecast period?

Get Key Insights on Market Forecast (PDF) Request Free Sample

How is the Smart Home Appliances Market Segmented?

The smart home appliances industry research report provides comprehensive data (region-wise segment analysis), with forecasts and estimates in "USD million" for the period 2026-2030, as well as historical data from 2020-2024 for the following segments.

  • Product
    • SWMD
    • Smart air conditioners
    • Smart refrigerators
    • Smart microwave ovens
    • Smart dishwashers
  • Distribution channel
    • Offline
    • Online
  • Technology
    • Wi-Fi
    • Bluetooth
    • Others
  • Geography
    • North America
      • US
      • Canada
      • Mexico
    • Europe
      • Germany
      • UK
      • France
    • APAC
      • China
      • Japan
      • India
    • South America
      • Brazil
      • Argentina
      • Colombia
    • Middle East and Africa
      • Saudi Arabia
      • UAE
      • Israel
    • Rest of World (ROW)

By Product Insights

The swmd segment is estimated to witness significant growth during the forecast period.

The smart washing machines and dryers (SWMD) segment is defined by the proliferation of automated laundry systems that prioritize resource management and user convenience.

These appliances utilize AI-driven wash and dry technology, leveraging sensor fusion technology to analyze load weight and fabric type, which informs personalized appliance operation.

This functionality optimizes water and detergent use, with some systems demonstrating a 15% improvement in resource efficiency.

Integration with home energy management systems allows for cycles to run during off-peak hours, aligning with smart home automation routines and supporting energy consumption tracking. Real-time data exchange enables user behavior learning, refining cycles over time.

While smart appliance connectivity issues persist, improving interoperability standards for IoT are making these user-centric designs more accessible.

Request Free Sample

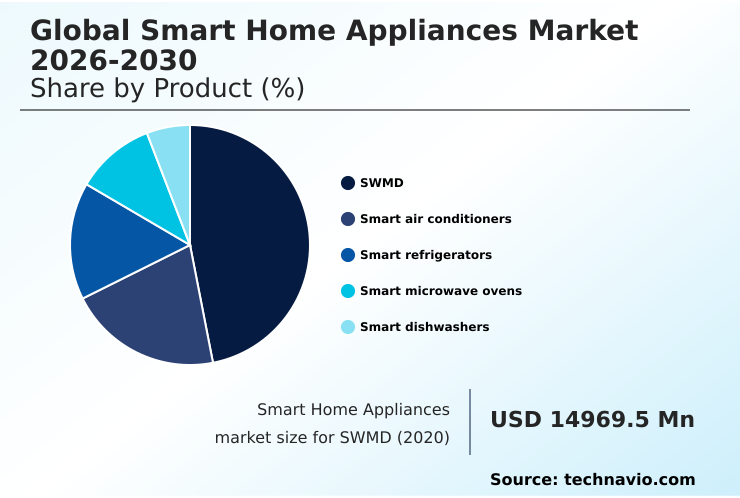
The SWMD segment was valued at USD 25.92 billion in 2024 and showed a gradual increase during the forecast period.

Request Free Sample

Regional Analysis

North America is estimated to contribute 39.7% to the growth of the global market during the forecast period.Technavio’s analysts have elaborately explained the regional trends and drivers that shape the market during the forecast period.

See How Smart Home Appliances Market Demand is Rising in North America Request Free Sample

The geographic landscape is led by North America, which accounts for nearly 40% of the market's incremental growth, driven by high adoption of smart HVAC systems and energy efficient smart appliances.

The region's robust digital infrastructure supports advanced features like automated grocery list generation from AI-powered refrigerators. APAC follows, demonstrating the fastest regional expansion, with a strong focus on smart kitchen gadget integration and automated cleaning robots.

In Europe, which contributes over 27% of growth, regulatory focus on sustainability and data privacy shapes product development, promoting user-centric appliance design. The deployment of distributed intelligence networks is enabling zero-touch provisioning for new devices, simplifying setup for consumers.

In contrast, adoption in South America and the Middle East and Africa is more nascent, centered on security and luxury applications.

Market Dynamics

Our researchers analyzed the data with 2025 as the base year, along with the key drivers, trends, and challenges. A holistic analysis of drivers will help companies refine their marketing strategies to gain a competitive advantage.

  • Strategic decision-making in the smart home appliance sector requires a granular understanding of consumer needs, moving beyond broad trends to specific use cases. For instance, comparing smart refrigerators with internal cameras reveals that models with advanced food recognition are central to AI-powered refrigerators for meal planning.
  • Similarly, assessing the best smart washing machine for energy savings involves analyzing adaptive cycles and integration with real-time energy monitoring for homes. A key adoption barrier is complexity; thus, creating a smart home hub for multi-brand appliances is critical for market penetration. Consumers are increasingly interested in voice-controlled smart kitchen gadget automation and personalized cooking cycles on smart microwaves.
  • From an operational standpoint, manufacturers offering remote diagnostic tools for appliance repair can reduce service call escalations by over 25% compared to traditional models. Security risks of connected home appliances remain a major concern, necessitating transparent communication about firmware updates for smart home security.
  • The benefits of mesh networking for IoT devices are clear in ensuring robust cross-device communication between appliances. Other key considerations include the cost of smart HVAC systems vs traditional, the effectiveness of smart air conditioners with air purification, and the tangible smart dishwasher benefits for water conservation.
  • The automated laundry system with detergent replenishment and the convenience of setting up home automation routines with AI illustrate the push toward a fully autonomous home environment, driven by predictive maintenance alerts for smart dryers.

What are the key market drivers leading to the rise in the adoption of Smart Home Appliances Industry?

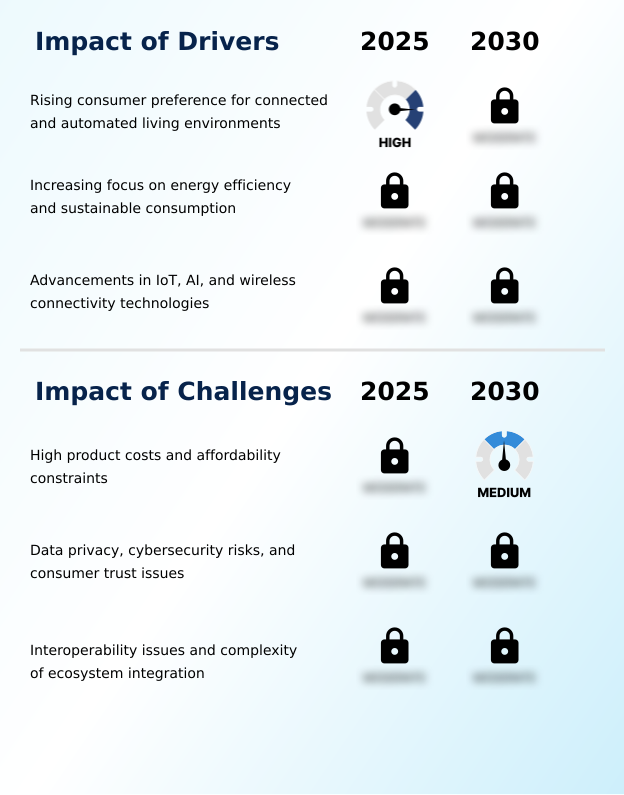
  • Rising consumer preference for connected and automated living environments is a primary driver for the expansion of the market.

  • Advancements in wireless connectivity technologies and edge AI processing are key drivers for the market, enabling sophisticated whole-home automation systems. These innovations support complex functionalities like predictive maintenance algorithms, which reduce appliance downtime by 40%.
  • The demand for convenience is fueling the adoption of voice control for home appliances and smart air conditioner remote access. Enhanced cross-device communication allows appliances to participate in utility-led demand-response programs, cutting peak energy costs by 15%.
  • Manufacturers are leveraging federated learning models to improve smart home automation routines without compromising user privacy.
  • This focus on intelligent, interconnected functionality addresses consumer desires for efficiency and control, making predictive maintenance for appliances a standard expectation rather than a premium feature.

What are the market trends shaping the Smart Home Appliances Industry?

  • A prominent trend shaping the market is the shift from standalone smart devices to fully integrated home ecosystems. This transition improves convenience through centralized control and automation across multiple appliances.

  • The market is rapidly moving beyond standalone devices toward integrated smart home ecosystems, addressing smart home platform fragmentation. This trend focuses on delivering hyper-personalized user experiences through proactive energy management and adaptive home climate control. For example, AI in smart refrigerators now offers personalized cooking recommendations, improving meal planning efficiency by up to 25%.
  • Voice-enabled assistants serve as central control points, while semantic data interoperability allows appliances from different brands to communicate effectively, a key feature in the best smart home ecosystem. The use of a remote appliance monitoring app has become standard, with platforms now achieving 99% uptime.
  • Furthermore, the creation of a digital twin for home appliances facilitates predictive analytics and enhances smart grid integration, optimizing household energy use.

What challenges does the Smart Home Appliances Industry face during its growth?

  • High product costs and affordability constraints remain a major challenge limiting widespread market adoption.

  • Significant challenges, including smart home data privacy concerns and connected appliance cybersecurity, restrain market adoption. The fragmentation of home automation platforms and a lack of unified interoperability standards for IoT create complexity for consumers attempting smart home security integration.
  • Securing IoT-enabled kitchen appliances requires robust measures like secure element hardware and regular firmware updates over Wi-Fi, but inconsistent implementation across devices increases vulnerability. Firms using advanced IoT device management platforms report a 20% reduction in security incidents. The future need for quantum-resistant cryptography to protect long-term data highlights the escalating nature of these threats.
  • Establishing trust through transparent data policies and reliable security features like biometric user authentication is essential for overcoming consumer apprehension.

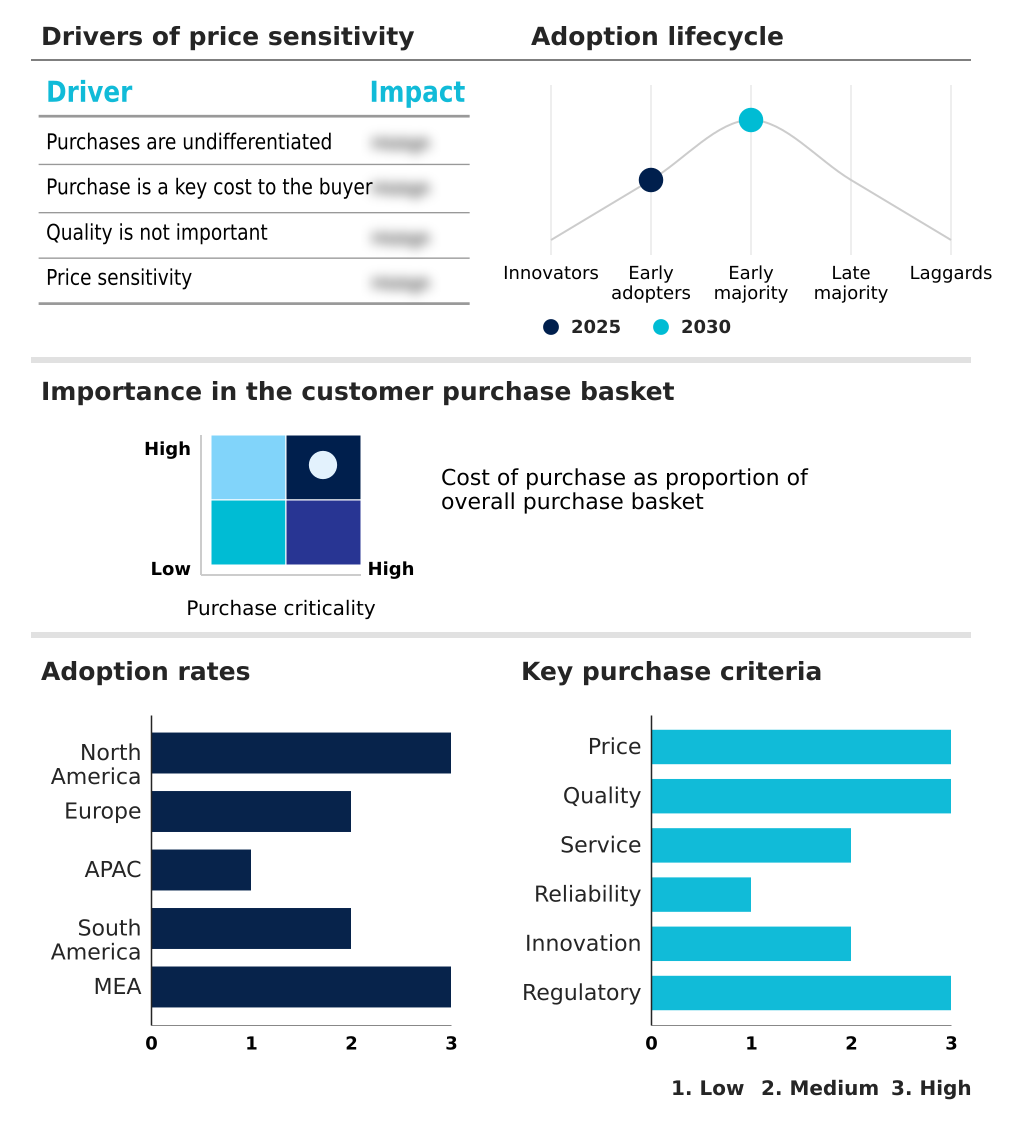
Exclusive Technavio Analysis on Customer Landscape

The smart home appliances market forecasting report includes the adoption lifecycle of the market, covering from the innovator’s stage to the laggard’s stage. It focuses on adoption rates in different regions based on penetration. Furthermore, the smart home appliances market report also includes key purchase criteria and drivers of price sensitivity to help companies evaluate and develop their market growth analysis strategies.

Customer Landscape of Smart Home Appliances Industry

Competitive Landscape

Companies are implementing various strategies, such as strategic alliances, smart home appliances market forecast, partnerships, mergers and acquisitions, geographical expansion, and product/service launches, to enhance their presence in the industry.

Arcelik A.S. - The company provides a range of smart home appliances, including connected refrigerators, washing machines, and air conditioners under its primary brands.

The industry research and growth report includes detailed analyses of the competitive landscape of the market and information about key companies, including:

  • Arcelik A.S.
  • Breville Group Ltd.
  • BSH Hausgerate GmbH
  • Electrolux Group
  • Godrej Enterprises Group
  • Haier Smart Home Co. Ltd.
  • Hisense International Co. Ltd.
  • Koninklijke Philips NV
  • LG Electronics Inc.
  • Midea Group Co. Ltd.
  • Miele and Cie. KG
  • Mitsubishi Electric Corp.
  • Panasonic Holdings Corp.
  • Samsung Electronics Co. Ltd.
  • Sharp Corp.
  • Whirlpool Corp.
  • Xiaomi Corp.

Qualitative and quantitative analysis of companies has been conducted to help clients understand the wider business environment as well as the strengths and weaknesses of key industry players. Data is qualitatively analyzed to categorize companies as pure play, category-focused, industry-focused, and diversified; it is quantitatively analyzed to categorize companies as dominant, leading, strong, tentative, and weak.

Recent Development and News in Smart home appliances market

  • In September 2024, Samsung Electronics announced the launch of its Bespoke AI Laundry Combo in Europe, an all-in-one washer-dryer solution featuring AI-driven technology and advanced heat pump drying.
  • In October 2024, Panasonic highlighted the global impact of its nanoe air purification technology, announcing that cumulative shipments of devices incorporating the system surpassed 100 million units across 107 countries.
  • In January 2025, BSH Home Appliances advanced the Matter smart home connectivity standard at CES 2025, showcasing the first Matter-enabled home appliance, a Bosch 100 Series refrigerator.
  • In March 2025, Electrolux Group unveiled an industry-leading sustainability target to increase the share of recycled steel and plastic in its products to 35% by 2030, nearly doubling its previous commitment.

Dive into Technavio’s robust research methodology, blending expert interviews, extensive data synthesis, and validated models for unparalleled Smart Home Appliances Market insights. See full methodology.

Market Scope
Page number 306
Base year 2025
Historic period 2020-2024
Forecast period 2026-2030
Growth momentum & CAGR Accelerate at a CAGR of 20.6%
Market growth 2026-2030 USD 98016.1 million
Market structure Fragmented
YoY growth 2025-2026(%) 17.4%
Key countries US, Canada, Mexico, Germany, UK, France, Italy, Spain, The Netherlands, China, Japan, India, South Korea, Australia, Indonesia, Brazil, Argentina, Colombia, Saudi Arabia, UAE, Israel, South Africa and Turkey
Competitive landscape Leading Companies, Market Positioning of Companies, Competitive Strategies, and Industry Risks

Request Free Sample

Research Analyst Overview

  • The smart home appliances market is characterized by a shift towards hyper-personalized user experiences, driven by advancements in edge AI processing and sensor fusion technology. The development of integrated smart home ecosystems, supported by home automation platforms, is becoming standard. These systems rely on wireless connectivity technologies and real-time data exchange to enable seamless cross-device communication.
  • For boardroom consideration, the integration of predictive maintenance algorithms, which can reduce field service dispatches by 30%, represents a significant operational efficiency gain. Core technologies include AI-powered refrigerators and smart HVAC systems controlled by voice-enabled assistants. Functionality is enhanced through user behavior learning for personalized appliance operation and proactive energy management via sophisticated energy management systems.
  • Security is paramount, with a focus on biometric user authentication, secure element hardware, and even future-proofing with quantum-resistant cryptography. Innovations like AI-driven wash and dry technology in automated laundry systems and adaptive cooling algorithms highlight the move toward ambient computing interfaces.
  • The success of these systems hinges on semantic data interoperability and robust mesh networking capabilities, allowing for firmware updates over Wi-Fi and effective smart grid integration through demand-response programs, all managed through remote diagnostic tools.

What are the Key Data Covered in this Smart Home Appliances Market Research and Growth Report?

  • What is the expected growth of the Smart Home Appliances Market between 2026 and 2030?

    • USD 98.02 billion, at a CAGR of 20.6%

  • What segmentation does the market report cover?

    • The report is segmented by Product (SWMD, Smart air conditioners, Smart refrigerators, Smart microwave ovens, and Smart dishwashers), Distribution Channel (Offline, and Online), Technology (Wi-Fi, Bluetooth, and Others) and Geography (North America, Europe, APAC, South America, Middle East and Africa)

  • Which regions are analyzed in the report?

    • North America, Europe, APAC, South America and Middle East and Africa

  • What are the key growth drivers and market challenges?

    • Rising consumer preference for connected and automated living environments, High product costs and affordability constraints

  • Who are the major players in the Smart Home Appliances Market?

    • Arcelik A.S., Breville Group Ltd., BSH Hausgerate GmbH, Electrolux Group, Godrej Enterprises Group, Haier Smart Home Co. Ltd., Hisense International Co. Ltd., Koninklijke Philips NV, LG Electronics Inc., Midea Group Co. Ltd., Miele and Cie. KG, Mitsubishi Electric Corp., Panasonic Holdings Corp., Samsung Electronics Co. Ltd., Sharp Corp., Whirlpool Corp. and Xiaomi Corp.

Market Research Insights

  • The market's dynamics are shaped by the pursuit of whole-home automation systems and the increasing consumer expectation for a seamless user-centric appliance design. While the best smart home ecosystem remains a topic of debate due to smart home platform fragmentation, a primary focus is resolving smart appliance connectivity issues.
  • Adoption of energy efficient smart appliances is high, with some connected laundry machine benefits including a 15% reduction in water usage. The integration of AI in smart refrigerators for automated grocery list generation and personalized cooking recommendations is a key value proposition.
  • However, smart home data privacy concerns and connected appliance cybersecurity are significant barriers, addressed through enhanced smart home security integration. Technologies like adaptive home climate control via smart air conditioner remote access and the convenience of a remote appliance monitoring app are now standard. Predictive maintenance for appliances, facilitated by IoT device management platforms, improves reliability and reduces lifecycle costs.

We can help! Our analysts can customize this smart home appliances market research report to meet your requirements.

Get in touch

1. Executive Summary

1.1 Market overview

Executive Summary - Chart on Market Overview
Executive Summary - Data Table on Market Overview
Executive Summary - Chart on Global Market Characteristics
Executive Summary - Chart on Market by Geography
Executive Summary - Chart on Market Segmentation by Product
Executive Summary - Chart on Market Segmentation by Distribution Channel
Executive Summary - Chart on Market Segmentation by Technology
Executive Summary - Chart on Incremental Growth
Executive Summary - Data Table on Incremental Growth
Executive Summary - Chart on Company Market Positioning

2. Technavio Analysis

2.1 Analysis of price sensitivity, lifecycle, customer purchase basket, adoption rates, and purchase criteria

2.2 Criticality of inputs and Factors of differentiation

Chart on Overview on criticality of inputs and factors of differentiation

2.3 Factors of disruption

Chart on Overview on factors of disruption

2.4 Impact of drivers and challenges

Chart on Impact of drivers and challenges in 2025 and 2030

3. Market Landscape

3.1 Market ecosystem

Chart on Parent Market
Data Table on - Parent Market

3.2 Market characteristics

Chart on Market characteristics analysis

3.3 Value chain analysis

Chart on Value chain analysis

4. Market Sizing

4.1 Market definition

Data Table on Offerings of companies included in the market definition

4.2 Market segment analysis

Market segments

4.3 Market size 2025

4.4 Market outlook: Forecast for 2025-2030

Chart on Global - Market size and forecast 2025-2030 ($ million)
Data Table on Global - Market size and forecast 2025-2030 ($ million)
Chart on Global Market: Year-over-year growth 2025-2030 (%)
Data Table on Global Market: Year-over-year growth 2025-2030 (%)

5. Historic Market Size

5.1 Global Smart Home Appliances Market 2020 - 2024

Historic Market Size - Data Table on Global Smart Home Appliances Market 2020 - 2024 ($ million)

5.2 Product segment analysis 2020 - 2024

Historic Market Size - Product Segment 2020 - 2024 ($ million)

5.3 Distribution Channel segment analysis 2020 - 2024

Historic Market Size - Distribution Channel Segment 2020 - 2024 ($ million)

5.4 Technology segment analysis 2020 - 2024

Historic Market Size - Technology Segment 2020 - 2024 ($ million)

5.5 Geography segment analysis 2020 - 2024

Historic Market Size - Geography Segment 2020 - 2024 ($ million)

5.6 Country segment analysis 2020 - 2024

Historic Market Size - Country Segment 2020 - 2024 ($ million)

6. Qualitative Analysis

6.1 Impact of AI in Global Smart Home Appliances Market

7. Five Forces Analysis

7.1 Five forces summary

Five forces analysis - Comparison between 2025 and 2030

7.2 Bargaining power of buyers

Bargaining power of buyers - Impact of key factors 2025 and 2030

7.3 Bargaining power of suppliers

Bargaining power of suppliers - Impact of key factors in 2025 and 2030

7.4 Threat of new entrants

Threat of new entrants - Impact of key factors in 2025 and 2030

7.5 Threat of substitutes

Threat of substitutes - Impact of key factors in 2025 and 2030

7.6 Threat of rivalry

Threat of rivalry - Impact of key factors in 2025 and 2030

7.7 Market condition

Chart on Market condition - Five forces 2025 and 2030

8. Market Segmentation by Product

8.1 Market segments

Chart on Product - Market share 2025-2030 (%)
Data Table on Product - Market share 2025-2030 (%)

8.2 Comparison by Product

Chart on Comparison by Product
Data Table on Comparison by Product

8.3 SWMD - Market size and forecast 2025-2030

Chart on SWMD - Market size and forecast 2025-2030 ($ million)
Data Table on SWMD - Market size and forecast 2025-2030 ($ million)
Chart on SWMD - Year-over-year growth 2025-2030 (%)
Data Table on SWMD - Year-over-year growth 2025-2030 (%)

8.4 Smart air conditioners - Market size and forecast 2025-2030

Chart on Smart air conditioners - Market size and forecast 2025-2030 ($ million)
Data Table on Smart air conditioners - Market size and forecast 2025-2030 ($ million)
Chart on Smart air conditioners - Year-over-year growth 2025-2030 (%)
Data Table on Smart air conditioners - Year-over-year growth 2025-2030 (%)

8.5 Smart refrigerators - Market size and forecast 2025-2030

Chart on Smart refrigerators - Market size and forecast 2025-2030 ($ million)
Data Table on Smart refrigerators - Market size and forecast 2025-2030 ($ million)
Chart on Smart refrigerators - Year-over-year growth 2025-2030 (%)
Data Table on Smart refrigerators - Year-over-year growth 2025-2030 (%)

8.6 Smart microwave ovens - Market size and forecast 2025-2030

Chart on Smart microwave ovens - Market size and forecast 2025-2030 ($ million)
Data Table on Smart microwave ovens - Market size and forecast 2025-2030 ($ million)
Chart on Smart microwave ovens - Year-over-year growth 2025-2030 (%)
Data Table on Smart microwave ovens - Year-over-year growth 2025-2030 (%)

8.7 Smart dishwashers - Market size and forecast 2025-2030

Chart on Smart dishwashers - Market size and forecast 2025-2030 ($ million)
Data Table on Smart dishwashers - Market size and forecast 2025-2030 ($ million)
Chart on Smart dishwashers - Year-over-year growth 2025-2030 (%)
Data Table on Smart dishwashers - Year-over-year growth 2025-2030 (%)

8.8 Market opportunity by Product

Market opportunity by Product ($ million)
Data Table on Market opportunity by Product ($ million)

9. Market Segmentation by Distribution Channel

9.1 Market segments

Chart on Distribution Channel - Market share 2025-2030 (%)
Data Table on Distribution Channel - Market share 2025-2030 (%)

9.2 Comparison by Distribution Channel

Chart on Comparison by Distribution Channel
Data Table on Comparison by Distribution Channel

9.3 Offline - Market size and forecast 2025-2030

Chart on Offline - Market size and forecast 2025-2030 ($ million)
Data Table on Offline - Market size and forecast 2025-2030 ($ million)
Chart on Offline - Year-over-year growth 2025-2030 (%)
Data Table on Offline - Year-over-year growth 2025-2030 (%)

9.4 Online - Market size and forecast 2025-2030

Chart on Online - Market size and forecast 2025-2030 ($ million)
Data Table on Online - Market size and forecast 2025-2030 ($ million)
Chart on Online - Year-over-year growth 2025-2030 (%)
Data Table on Online - Year-over-year growth 2025-2030 (%)

9.5 Market opportunity by Distribution Channel

Market opportunity by Distribution Channel ($ million)
Data Table on Market opportunity by Distribution Channel ($ million)

10. Market Segmentation by Technology

10.1 Market segments

Chart on Technology - Market share 2025-2030 (%)
Data Table on Technology - Market share 2025-2030 (%)

10.2 Comparison by Technology

Chart on Comparison by Technology
Data Table on Comparison by Technology

10.3 Wi-Fi - Market size and forecast 2025-2030

Chart on Wi-Fi - Market size and forecast 2025-2030 ($ million)
Data Table on Wi-Fi - Market size and forecast 2025-2030 ($ million)
Chart on Wi-Fi - Year-over-year growth 2025-2030 (%)
Data Table on Wi-Fi - Year-over-year growth 2025-2030 (%)

10.4 Bluetooth - Market size and forecast 2025-2030

Chart on Bluetooth - Market size and forecast 2025-2030 ($ million)
Data Table on Bluetooth - Market size and forecast 2025-2030 ($ million)
Chart on Bluetooth - Year-over-year growth 2025-2030 (%)
Data Table on Bluetooth - Year-over-year growth 2025-2030 (%)

10.5 Others - Market size and forecast 2025-2030

Chart on Others - Market size and forecast 2025-2030 ($ million)
Data Table on Others - Market size and forecast 2025-2030 ($ million)
Chart on Others - Year-over-year growth 2025-2030 (%)
Data Table on Others - Year-over-year growth 2025-2030 (%)

10.6 Market opportunity by Technology

Market opportunity by Technology ($ million)
Data Table on Market opportunity by Technology ($ million)

11. Customer Landscape

11.1 Customer landscape overview

Analysis of price sensitivity, lifecycle, customer purchase basket, adoption rates, and purchase criteria

12. Geographic Landscape

12.1 Geographic segmentation

Chart on Market share by geography 2025-2030 (%)
Data Table on Market share by geography 2025-2030 (%)

12.2 Geographic comparison

Chart on Geographic comparison
Data Table on Geographic comparison

12.3 North America - Market size and forecast 2025-2030

Chart on North America - Market size and forecast 2025-2030 ($ million)
Data Table on North America - Market size and forecast 2025-2030 ($ million)
Chart on North America - Year-over-year growth 2025-2030 (%)
Data Table on North America - Year-over-year growth 2025-2030 (%)
Chart on Regional Comparison - North America
Data Table on Regional Comparison - North America

12.3.1 US - Market size and forecast 2025-2030

Chart on US - Market size and forecast 2025-2030 ($ million)
Data Table on US - Market size and forecast 2025-2030 ($ million)
Chart on US - Year-over-year growth 2025-2030 (%)
Data Table on US - Year-over-year growth 2025-2030 (%)

12.3.2 Canada - Market size and forecast 2025-2030

Chart on Canada - Market size and forecast 2025-2030 ($ million)
Data Table on Canada - Market size and forecast 2025-2030 ($ million)
Chart on Canada - Year-over-year growth 2025-2030 (%)
Data Table on Canada - Year-over-year growth 2025-2030 (%)

12.3.3 Mexico - Market size and forecast 2025-2030

Chart on Mexico - Market size and forecast 2025-2030 ($ million)
Data Table on Mexico - Market size and forecast 2025-2030 ($ million)
Chart on Mexico - Year-over-year growth 2025-2030 (%)
Data Table on Mexico - Year-over-year growth 2025-2030 (%)

12.4 Europe - Market size and forecast 2025-2030

Chart on Europe - Market size and forecast 2025-2030 ($ million)
Data Table on Europe - Market size and forecast 2025-2030 ($ million)
Chart on Europe - Year-over-year growth 2025-2030 (%)
Data Table on Europe - Year-over-year growth 2025-2030 (%)
Chart on Regional Comparison - Europe
Data Table on Regional Comparison - Europe

12.4.1 Germany - Market size and forecast 2025-2030

Chart on Germany - Market size and forecast 2025-2030 ($ million)
Data Table on Germany - Market size and forecast 2025-2030 ($ million)
Chart on Germany - Year-over-year growth 2025-2030 (%)
Data Table on Germany - Year-over-year growth 2025-2030 (%)

12.4.2 UK - Market size and forecast 2025-2030

Chart on UK - Market size and forecast 2025-2030 ($ million)
Data Table on UK - Market size and forecast 2025-2030 ($ million)
Chart on UK - Year-over-year growth 2025-2030 (%)
Data Table on UK - Year-over-year growth 2025-2030 (%)

12.4.3 France - Market size and forecast 2025-2030

Chart on France - Market size and forecast 2025-2030 ($ million)
Data Table on France - Market size and forecast 2025-2030 ($ million)
Chart on France - Year-over-year growth 2025-2030 (%)
Data Table on France - Year-over-year growth 2025-2030 (%)

12.4.4 Italy - Market size and forecast 2025-2030

Chart on Italy - Market size and forecast 2025-2030 ($ million)
Data Table on Italy - Market size and forecast 2025-2030 ($ million)
Chart on Italy - Year-over-year growth 2025-2030 (%)
Data Table on Italy - Year-over-year growth 2025-2030 (%)

12.4.5 Spain - Market size and forecast 2025-2030

Chart on Spain - Market size and forecast 2025-2030 ($ million)
Data Table on Spain - Market size and forecast 2025-2030 ($ million)
Chart on Spain - Year-over-year growth 2025-2030 (%)
Data Table on Spain - Year-over-year growth 2025-2030 (%)

12.4.6 The Netherlands - Market size and forecast 2025-2030

Chart on The Netherlands - Market size and forecast 2025-2030 ($ million)
Data Table on The Netherlands - Market size and forecast 2025-2030 ($ million)
Chart on The Netherlands - Year-over-year growth 2025-2030 (%)
Data Table on The Netherlands - Year-over-year growth 2025-2030 (%)

12.5 APAC - Market size and forecast 2025-2030

Chart on APAC - Market size and forecast 2025-2030 ($ million)
Data Table on APAC - Market size and forecast 2025-2030 ($ million)
Chart on APAC - Year-over-year growth 2025-2030 (%)
Data Table on APAC - Year-over-year growth 2025-2030 (%)
Chart on Regional Comparison - APAC
Data Table on Regional Comparison - APAC

12.5.1 China - Market size and forecast 2025-2030

Chart on China - Market size and forecast 2025-2030 ($ million)
Data Table on China - Market size and forecast 2025-2030 ($ million)
Chart on China - Year-over-year growth 2025-2030 (%)
Data Table on China - Year-over-year growth 2025-2030 (%)

12.5.2 Japan - Market size and forecast 2025-2030

Chart on Japan - Market size and forecast 2025-2030 ($ million)
Data Table on Japan - Market size and forecast 2025-2030 ($ million)
Chart on Japan - Year-over-year growth 2025-2030 (%)
Data Table on Japan - Year-over-year growth 2025-2030 (%)

12.5.3 India - Market size and forecast 2025-2030

Chart on India - Market size and forecast 2025-2030 ($ million)
Data Table on India - Market size and forecast 2025-2030 ($ million)
Chart on India - Year-over-year growth 2025-2030 (%)
Data Table on India - Year-over-year growth 2025-2030 (%)

12.5.4 South Korea - Market size and forecast 2025-2030

Chart on South Korea - Market size and forecast 2025-2030 ($ million)
Data Table on South Korea - Market size and forecast 2025-2030 ($ million)
Chart on South Korea - Year-over-year growth 2025-2030 (%)
Data Table on South Korea - Year-over-year growth 2025-2030 (%)

12.5.5 Australia - Market size and forecast 2025-2030

Chart on Australia - Market size and forecast 2025-2030 ($ million)
Data Table on Australia - Market size and forecast 2025-2030 ($ million)
Chart on Australia - Year-over-year growth 2025-2030 (%)
Data Table on Australia - Year-over-year growth 2025-2030 (%)

12.5.6 Indonesia - Market size and forecast 2025-2030

Chart on Indonesia - Market size and forecast 2025-2030 ($ million)
Data Table on Indonesia - Market size and forecast 2025-2030 ($ million)
Chart on Indonesia - Year-over-year growth 2025-2030 (%)
Data Table on Indonesia - Year-over-year growth 2025-2030 (%)

12.6 South America - Market size and forecast 2025-2030

Chart on South America - Market size and forecast 2025-2030 ($ million)
Data Table on South America - Market size and forecast 2025-2030 ($ million)
Chart on South America - Year-over-year growth 2025-2030 (%)
Data Table on South America - Year-over-year growth 2025-2030 (%)
Chart on Regional Comparison - South America
Data Table on Regional Comparison - South America

12.6.1 Brazil - Market size and forecast 2025-2030

Chart on Brazil - Market size and forecast 2025-2030 ($ million)
Data Table on Brazil - Market size and forecast 2025-2030 ($ million)
Chart on Brazil - Year-over-year growth 2025-2030 (%)
Data Table on Brazil - Year-over-year growth 2025-2030 (%)

12.6.2 Argentina - Market size and forecast 2025-2030

Chart on Argentina - Market size and forecast 2025-2030 ($ million)
Data Table on Argentina - Market size and forecast 2025-2030 ($ million)
Chart on Argentina - Year-over-year growth 2025-2030 (%)
Data Table on Argentina - Year-over-year growth 2025-2030 (%)

12.6.3 Colombia - Market size and forecast 2025-2030

Chart on Colombia - Market size and forecast 2025-2030 ($ million)
Data Table on Colombia - Market size and forecast 2025-2030 ($ million)
Chart on Colombia - Year-over-year growth 2025-2030 (%)
Data Table on Colombia - Year-over-year growth 2025-2030 (%)

12.7 Middle East and Africa - Market size and forecast 2025-2030

Chart on Middle East and Africa - Market size and forecast 2025-2030 ($ million)
Data Table on Middle East and Africa - Market size and forecast 2025-2030 ($ million)
Chart on Middle East and Africa - Year-over-year growth 2025-2030 (%)
Data Table on Middle East and Africa - Year-over-year growth 2025-2030 (%)
Chart on Regional Comparison - Middle East and Africa
Data Table on Regional Comparison - Middle East and Africa

12.7.1 Saudi Arabia - Market size and forecast 2025-2030

Chart on Saudi Arabia - Market size and forecast 2025-2030 ($ million)
Data Table on Saudi Arabia - Market size and forecast 2025-2030 ($ million)
Chart on Saudi Arabia - Year-over-year growth 2025-2030 (%)
Data Table on Saudi Arabia - Year-over-year growth 2025-2030 (%)

12.7.2 UAE - Market size and forecast 2025-2030

Chart on UAE - Market size and forecast 2025-2030 ($ million)
Data Table on UAE - Market size and forecast 2025-2030 ($ million)
Chart on UAE - Year-over-year growth 2025-2030 (%)
Data Table on UAE - Year-over-year growth 2025-2030 (%)

12.7.3 Israel - Market size and forecast 2025-2030

Chart on Israel - Market size and forecast 2025-2030 ($ million)
Data Table on Israel - Market size and forecast 2025-2030 ($ million)
Chart on Israel - Year-over-year growth 2025-2030 (%)
Data Table on Israel - Year-over-year growth 2025-2030 (%)

12.7.4 South Africa - Market size and forecast 2025-2030

Chart on South Africa - Market size and forecast 2025-2030 ($ million)
Data Table on South Africa - Market size and forecast 2025-2030 ($ million)
Chart on South Africa - Year-over-year growth 2025-2030 (%)
Data Table on South Africa - Year-over-year growth 2025-2030 (%)

12.7.5 Turkey - Market size and forecast 2025-2030

Chart on Turkey - Market size and forecast 2025-2030 ($ million)
Data Table on Turkey - Market size and forecast 2025-2030 ($ million)
Chart on Turkey - Year-over-year growth 2025-2030 (%)
Data Table on Turkey - Year-over-year growth 2025-2030 (%)

12.8 Market opportunity by geography

Market opportunity by geography ($ million)
Data Tables on Market opportunity by geography ($ million)

13. Drivers, Challenges, and Opportunity

13.1 Market drivers

Rising consumer preference for connected and automated living environments
Increasing focus on energy efficiency and sustainable consumption
Advancements in IoT, AI, and wireless connectivity technologies

13.2 Market challenges

High product costs and affordability constraints
Data privacy, cybersecurity risks, and consumer trust issues
Interoperability issues and complexity of ecosystem integration

13.3 Impact of drivers and challenges

Impact of drivers and challenges in 2025 and 2030

13.4 Market opportunities

Growing shift toward integrated smart home ecosystems
Increasing use of AI for personalized appliance functionality
Expansion of smart appliances in mid-range and mass-market segments

14. Competitive Landscape

14.1 Overview

14.2

Overview on criticality of inputs and factors of differentiation

14.3 Landscape disruption

Overview on factors of disruption

14.4 Industry risks

Impact of key risks on business

15. Competitive Analysis

15.1 Companies profiled

Companies covered

15.2 Company ranking index

15.3 Market positioning of companies

Matrix on companies position and classification

15.4 Arcelik A.S.

Arcelik A.S. - Overview
Arcelik A.S. - Business segments
Arcelik A.S. - Key offerings
Arcelik A.S. - Segment focus
SWOT

15.5 BSH Hausgerate GmbH

BSH Hausgerate GmbH - Overview
BSH Hausgerate GmbH - Product / Service
BSH Hausgerate GmbH - Key offerings
SWOT

15.6 Electrolux Group

Electrolux Group - Overview
Electrolux Group - Business segments
Electrolux Group - Key news
Electrolux Group - Key offerings
Electrolux Group - Segment focus
SWOT

15.7 Haier Smart Home Co. Ltd.

Haier Smart Home Co. Ltd. - Overview
Haier Smart Home Co. Ltd. - Business segments
Haier Smart Home Co. Ltd. - Key offerings
Haier Smart Home Co. Ltd. - Segment focus
SWOT

15.8 Hisense International Co. Ltd.

Hisense International Co. Ltd. - Overview
Hisense International Co. Ltd. - Product / Service
Hisense International Co. Ltd. - Key offerings
SWOT

15.9 Koninklijke Philips NV

Koninklijke Philips NV - Overview
Koninklijke Philips NV - Business segments
Koninklijke Philips NV - Key news
Koninklijke Philips NV - Key offerings
Koninklijke Philips NV - Segment focus
SWOT

15.10 LG Electronics Inc.

LG Electronics Inc. - Overview
LG Electronics Inc. - Business segments
LG Electronics Inc. - Key offerings
LG Electronics Inc. - Segment focus
SWOT

15.11 Midea Group Co. Ltd.

Midea Group Co. Ltd. - Overview
Midea Group Co. Ltd. - Business segments
Midea Group Co. Ltd. - Key offerings
Midea Group Co. Ltd. - Segment focus
SWOT

15.12 Miele and Cie. KG

Miele and Cie. KG - Overview
Miele and Cie. KG - Product / Service
Miele and Cie. KG - Key offerings
SWOT

15.13 Mitsubishi Electric Corp.

Mitsubishi Electric Corp. - Overview
Mitsubishi Electric Corp. - Business segments
Mitsubishi Electric Corp. - Key offerings
Mitsubishi Electric Corp. - Segment focus
SWOT

15.14 Panasonic Holdings Corp.

Panasonic Holdings Corp. - Overview
Panasonic Holdings Corp. - Business segments
Panasonic Holdings Corp. - Key news
Panasonic Holdings Corp. - Key offerings
Panasonic Holdings Corp. - Segment focus
SWOT

15.15 Samsung Electronics Co. Ltd.

Samsung Electronics Co. Ltd. - Overview
Samsung Electronics Co. Ltd. - Business segments
Samsung Electronics Co. Ltd. - Key news
Samsung Electronics Co. Ltd. - Key offerings
Samsung Electronics Co. Ltd. - Segment focus
SWOT

15.16 Sharp Corp.

Sharp Corp. - Overview
Sharp Corp. - Business segments
Sharp Corp. - Key news
Sharp Corp. - Key offerings
Sharp Corp. - Segment focus
SWOT

15.17 Whirlpool Corp.

Whirlpool Corp. - Overview
Whirlpool Corp. - Business segments
Whirlpool Corp. - Key offerings
Whirlpool Corp. - Segment focus
SWOT

15.18 Xiaomi Corp.

Xiaomi Corp. - Overview
Xiaomi Corp. - Business segments
Xiaomi Corp. - Key news
Xiaomi Corp. - Key offerings
Xiaomi Corp. - Segment focus
SWOT

16. Appendix

16.1 Scope of the report

Market definition
Objectives
Notes and caveats

16.2 Inclusions and exclusions checklist

Inclusions checklist
Exclusions checklist

16.3 Currency conversion rates for US$

16.4 Research methodology

16.5 Data procurement

Information sources

16.6 Data validation

16.7 Validation techniques employed for market sizing

16.8 Data synthesis

16.9 360 degree market analysis

16.10 List of abbreviations

Research Methodology

Technavio presents a detailed picture of the market by way of study, synthesis, and summation of data from multiple sources. The analysts have presented the various facets of the market with a particular focus on identifying the key industry influencers. The data thus presented is comprehensive, reliable, and the result of extensive research, both primary and secondary.

INFORMATION SOURCES

Primary sources

  • Manufacturers and suppliers
  • Channel partners
  • Industry experts
  • Strategic decision makers

Secondary sources

  • Industry journals and periodicals
  • Government data
  • Financial reports of key industry players
  • Historical data
  • Press releases

DATA ANALYSIS

Data Synthesis

  • Collation of data
  • Estimation of key figures
  • Analysis of derived insights

Data Validation

  • Triangulation with data models
  • Reference against proprietary databases
  • Corroboration with industry experts

REPORT WRITING

Qualitative

  • Market drivers
  • Market challenges
  • Market trends
  • Five forces analysis

Quantitative

  • Market size and forecast
  • Market segmentation
  • Geographical insights
  • Competitive landscape

Interested in this report?

Get your sample now to see our research methodology and insights!

Download Now

Frequently Asked Questions

Smart Home Appliances market growth will increase by USD 98016.1 million during 2026-2030.

The Smart Home Appliances market is expected to grow at a CAGR of 20.6% during 2026-2030.

Smart Home Appliances market is segmented by Product (SWMD, Smart air conditioners, Smart refrigerators, Smart microwave ovens, Smart dishwashers) Distribution channel (Offline, Online) Technology (Wi-Fi, Bluetooth, Others)

Arcelik A.S., Breville Group Ltd., BSH Hausgerate GmbH, Electrolux Group, Godrej Enterprises Group, Haier Smart Home Co. Ltd., Hisense International Co. Ltd., Koninklijke Philips NV, LG Electronics Inc., Midea Group Co. Ltd., Miele and Cie. KG, Mitsubishi Electric Corp., Panasonic Holdings Corp., Samsung Electronics Co. Ltd., Sharp Corp., Whirlpool Corp., Xiaomi Corp. are a few of the key vendors in the Smart Home Appliances market.

North America will register the highest growth rate of 39.7% among the other regions. Therefore, the Smart Home Appliances market in North America is expected to garner significant business opportunities for the vendors during the forecast period.

US, Canada, Mexico, Germany, UK, France, Italy, Spain, The Netherlands, China, Japan, India, South Korea, Australia, Indonesia, Brazil, Argentina, Colombia, Saudi Arabia, UAE, Israel, South Africa, Turkey

  • Rising consumer preference for connected and automated living environments is the driving factor this market.

The Smart Home Appliances market vendors should focus on grabbing business opportunities from the Product segment as it accounted for the largest market share in the base year.
RIA - Research AI Assistant
Ask RIA