Enjoy complimentary customisation on priority with our Enterprise License!
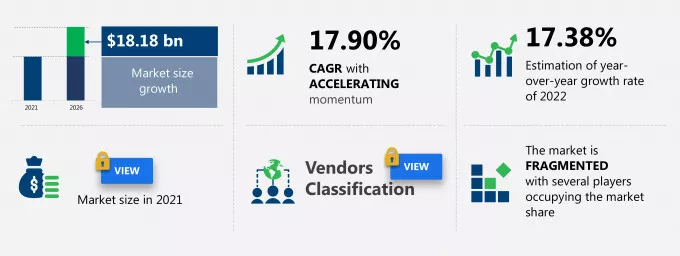
The US smart home market share is expected to increase to USD 18.18 billion from 2021 to 2026, and the market's growth momentum will accelerate at a CAGR of 17.90%.
This smart home market in US research report provides valuable insights on the post COVID-19 impact on the market, which will help companies evaluate their business approaches. The smart home market in US report also offers information on several market vendors, including ABB Ltd., Allegion Plc, Alphabet Inc., Amazon.com Inc., Apple Inc., Honeywell International Inc., Johnson Controls International Plc, Panasonic Corp., Samsung Electronics Co. Ltd., and Schneider Electric SE among others. Furthermore, this report extensively covers smart home market in US segmentation by technology (wireless and wired) and application (home entertainment, smart appliances, energy management, lighting control system and HVAC, and safety and security system).
Download the Free Report Sample to Unlock the Smart Home Market Size in US for the Forecast Period and Other Important Statistics
Based on our research output, there has been a neutral impact on the market growth during and post COVID-19 era. The growing consumer interest in home automation is notably driving the smart home market growth in US, although factors such as increase in issues related to interoperability may impede market growth. Our research analysts have studied the historical data and deduced the key market drivers and the COVID-19 pandemic impact on the smart home industry in US. The holistic analysis of the drivers will help in deducing end goals and refining marketing strategies to gain a competitive edge.
Key Smart Home Market Driver in US
Key Smart Home Market Trend in US
Key Smart Home Market Challenge in US
This smart home market in US analysis report also provides detailed information on other upcoming trends and challenges that will have a far-reaching effect on the market growth. The actionable insights on the trends and challenges will help companies evaluate and develop growth strategies for 2022-2026.
Technavio categorizes the smart home market in US as a part of the global technology hardware, storage, and peripherals market. Our research report has extensively covered external factors influencing the parent market growth potential in the coming years, which will determine the levels of growth of the smart home market in US during the forecast period.
The report analyzes the market's competitive landscape and offers information on several market vendors, including:
This statistical study of the smart home market in US encompasses successful business strategies deployed by the key vendors. The smart home market in US is fragmented and the vendors are deploying growth strategies such as an expansion of product portfolio to compete in the market.
To make the most of the opportunities and recover from post COVID-19 impact, market vendors should focus more on the growth prospects in the fast-growing segments, while maintaining their positions in the slow-growing segments.
The smart home market in US forecast report offers in-depth insights into key vendor profiles. The profiles include information on the production, sustainability, and prospects of the leading companies.
Our report provides extensive information on the value chain analysis for the smart home market in US, which vendors can leverage to gain a competitive advantage during the forecast period. The end-to-end understanding of the value chain is essential in profit margin optimization and evaluation of business strategies. The data available in our value chain analysis segment can help vendors drive costs and enhance customer services during the forecast period.

To gain further insights on the market contribution of various segments Request for a FREE sample
The smart home market share growth in US by the wireless segment will be significant during the forecast period. The high demand for smart home products owing to technological innovations will be driving the growth of this segment in the coming years in the US. For instance, in January 2019, Samsung announced the launch of smart laundry with a washer and dryer equipped with a Bixby voice assistant.
This report provides an accurate prediction of the contribution of all the segments to the growth of the smart home market size in US and actionable market insights on post COVID-19 impact on each segment.
Smart Home Safety market - The market share is expected to increase by USD 14.10 billion from 2021 to 2026, and the market's growth momentum will accelerate at a CAGR of 16.48%.
Smart Home Appliances market - The market share is expected to increase by USD 34.31 billion from 2021 to 2026, and the market's growth momentum will accelerate at a CAGR of 15%.
|
Smart Home Market Scope in US |
|
|
Report Coverage |
Details |
|
Page number |
120 |
|
Base year |
2021 |
|
Forecast period |
2022-2026 |
|
Growth momentum & CAGR |
Accelerate at a CAGR of 17.90% |
|
Market growth 2022-2026 |
$ 18.18 billion |
|
Market structure |
Fragmented |
|
YoY growth (%) |
17.38 |
|
Competitive landscape |
Leading companies, Competitive strategies, Consumer engagement scope |
|
Key companies profiled |
ABB Ltd., Allegion Plc, Alphabet Inc., Amazon.com Inc., Apple Inc., Honeywell International Inc., Johnson Controls International Plc, Panasonic Corp., Samsung Electronics Co. Ltd., and Schneider Electric SE |
|
Market dynamics |
Parent market analysis, Market growth inducers and obstacles, Fast-growing and slow-growing segment analysis, COVID 19 impact and recovery analysis and future consumer dynamics, Market condition analysis for forecast period |
|
Customization purview |
If our report has not included the data that you are looking for, you can reach out to our analysts and get segments customized. |
We can help! Our analysts can customize this report to meet your requirements. Get in touch
***1. Executive Summary
***2. Market Landscape
**2.1 Market ecosystem
*Exhibit 01: Parent market
**2.2: Market Characteristics
*Exhibit 02: Market Characteristics
*Exhibit 03: Value chain analysis: Communications equipment
*2.2.1 Input
*2.2.2 Inbound logistics
*2.2.3 Operations
*2.2.4 Outbound logistics
*2.2.5 Marketing and sales
*2.2.6 Service
*2.2.7 Industry innovation
3. Market Sizing
**3.1 Market definition
*Exhibit 04: Offerings of vendors included in the market definition
**3.2 Market segment analysis
*Exhibit 05: Market segments
**3.3 Market size 2020
**3.4 Market outlook: Forecast for 2020 - 2025
*3.4.1 Estimating growth rates for emerging and high-growth markets
*3.4.2 Estimating growth rates for mature markets
*Exhibit 06: Global - Market size and forecast 2020 - 2025 ($ million)
*Exhibit 07: Global market: Year-over-year growth 2020 - 2025 (%)
4. Five Forces Analysis
**4.1 Five Forces Summary
*Exhibit 08: Five forces analysis 2020 & 2025
**4.2 Bargaining power of buyers
*Exhibit 09: Bargaining power of buyers
**4.3 Bargaining power of suppliers
*Exhibit 10: Bargaining power of suppliers
**4.4 Threat of new entrants
*Exhibit 11: Threat of new entrants
**4.5 Threat of substitutes
*Exhibit 12: Threat of substitutes
**4.6 Threat of rivalry
*Exhibit 13: Threat of rivalry
**4.7 Market condition
*Exhibit 14: Market condition - Five forces 2020
***5. Market Segmentation by Application
**5.1 Market segments
*The segments covered in this chapter are:
*Exhibit 15: Application - Market share 2020-2025 (%)
**5.2 Comparison by Application
*Exhibit 16: Comparison by Application
**5.3 Home entertainment - Market size and forecast 2020-2025
*Exhibit 17: Home entertainment - Market size and forecast 2020-2025 ($ million)
*Exhibit 18: Home entertainment - Year-over-year growth 2020-2025 (%)
**5.4 Smart appliances - Market size and forecast 2020-2025
*Exhibit 19: Smart appliances - Market size and forecast 2020-2025 ($ million)
*Exhibit 20: Smart appliances - Year-over-year growth 2020-2025 (%)
**
5.5 Energy management - Market size and forecast 2020-2025
*Exhibit 21: Energy management - Market size and forecast 2020-2025 ($ million)
*Exhibit 22: Energy management - Year-over-year growth 2020-2025 (%)
**5.6 Lighting control and HVAC - Market size and forecast 2020-2025
*Exhibit 23: Lighting control and HVAC - Market size and forecast 2020-2025 ($ million)
*Exhibit 24: Lighting control and HVAC - Year-over-year growth 2020-2025 (%)
**5.7 Safety and security system - Market size and forecast 2020-2025
*Exhibit 25: Safety and security system - Market size and forecast 2020-2025 ($ million)
*Exhibit 26: Safety and security system - Year-over-year growth 2020-2025 (%)
*Market opportunity by Application
*Exhibit 27: Market opportunity by Application
***6. Market Segmentation by Technology
**6.1 Market segments
*The segments covered in this chapter are:
*Exhibit 28: Technology - Market share 2020-2025 (%)
**6.2 Comparison by Technology
*Exhibit 29: Comparison by Technology
**6.3 Wireless - Market size and forecast 2020-2025
*Exhibit 30: Wireless - Market size and forecast 2020-2025 ($ million)
*Exhibit 31: Wireless - Year-over-year growth 2020-2025 (%)
**6.4 Wired - Market size and forecast 2020-2025
*Exhibit 32: Wired - Market size and forecast 2020-2025 ($ million)
*Exhibit 33: Wired - Year-over-year growth 2020-2025 (%)
*Exhibit 34: Market opportunity by Technology
*Exhibit 35: Market opportunity by Technology
***7. Customer landscape
*Exhibit 35: Customer landscape
***Drivers, Challenges, and Trends
**8.1 Market drivers
*8.1.1 Growing consumer interest in home automation
*8.1.2 Availability of a wide range of smart home products
*8.1.3 Rising need for energy conservation
**8.2 Market challenges
*8.2.1 Increase in issues related to interoperability
*8.2.2 Privacy issues with respect to data
*8.2.3 Challenges associated with media storage
*Exhibit 36: Impact of drivers and challenges
**8.3 Market trends
*8.3.1 Increasing development of technologically advanced products
*8.3.2 Evolution of loT
*8.3.3 Growing smartphone penetration and increasing Internet speed
***9. Vendor Landscape
**9.1 Competitive scenario
**9.2 Vendor landscape
*Exhibit 37: Vendor Landscape
**9.3 Landscape disruption
*Exhibit 38: Landscape disruption
**9.4 Industry risks
*Exhibit 39: Industry risks
***11. Vendor Analysis
**11.1 Vendors covered
*Exhibit 40: Vendors covered
**10.2 Market positioning of vendors
*Exhibit 41: Market positioning of vendors
**10.3 ABB Ltd.
*Exhibit 42: ABB Ltd. - Overview
*Exhibit 43: ABB Ltd. - Business segments
*Exhibit 44: ABB Ltd. - Key news
*Exhibit 45: ABB Ltd. - Key offerings
*Exhibit 46: ABB Ltd. - Segment focus
**10.4 Allegion Plc
*Exhibit 47: Allegion Plc - Overview
*Exhibit 48: Allegion Plc - Business segments
*Exhibit 49: Allegion Plc - Key news
*Exhibit 50: Allegion Plc - Key offerings
*Exhibit 51: Allegion Plc - Segment focus
**10.5 Alphabet Inc.
*Exhibit 52: Alphabet Inc. - Overview
*Exhibit 53: Alphabet Inc. - Business segments
*Exhibit 54: Alphabet Inc. - Key offerings
*Exhibit 55: Alphabet Inc. - Segment focus
**10.6 Amazon.com Inc.
*Exhibit 56: Amazon.com Inc. - Overview
*Exhibit 57: Amazon.com Inc. - Business segments
*Exhibit 58: Amazon.com Inc. - Key news
*Exhibit 59: Amazon.com Inc. - Key offerings
*Exhibit 60: Amazon.com Inc. - Segment focus
**10.7 Apple Inc.
*Exhibit 61: Apple Inc. - Overview
*Exhibit 62: Apple Inc. - Business segments
* Exhibit 63: Apple Inc. - Key news
*Exhibit 64: Apple Inc. - Key offerings
*Exhibit 65: Apple Inc. - Segment focus
**10.8 Honeywell International Inc.
*Exhibit 66: Honeywell International Inc. - Overview
*Exhibit 67: Honeywell International Inc. - Business segments
*Exhibit 68: Honeywell International Inc. - Key news
*Exhibit 69: Honeywell International Inc. - Key offerings
*Exhibit 70: Honeywell International Inc. - Segment focus
**10.9 Johnson Controls International Plc
*Exhibit 71: Johnson Controls International Plc - Overview
*Exhibit 72: Johnson Controls International Plc - Business segments
*Exhibit 73: Johnson Controls International Plc - Key news
*Exhibit 74: Johnson Controls International Plc - Key offerings
*Exhibit 75: Johnson Controls International Plc - Segment focus
**10.10 Panasonic Corp.
*Exhibit 76: Panasonic Corp. - Overview
*Exhibit 77: Panasonic Corp. - Business segments
*Exhibit 78: Panasonic Corp. - Key news
*Exhibit 79: Panasonic Corp. - Key offerings
*Exhibit 80: Panasonic Corp. - Segment focus
**10.11 Samsung Electronics Co. Ltd.
*Exhibit 81: Samsung Electronics Co. Ltd. - Overview
*Exhibit 82: Samsung Electronics Co. Ltd. - Business segments
*Exhibit 83: Samsung Electronics Co. Ltd. - Key news
*Exhibit 84: Samsung Electronics Co. Ltd. - Key offerings
*Exhibit 85: Samsung Electronics Co. Ltd. - Segment focus
**10.12 Schneider Electric SE
*Exhibit 86: Schneider Electric SE - Overview
*Exhibit 87: Schneider Electric SE - Business segments
*Exhibit 88: Schneider Electric SE - Key news
*Exhibit 89: Schneider Electric SE - Key offerings
*Exhibit 90: Schneider Electric SE - Segment focus
***11. Appendix
**11.1 Scope of the report
*11.1.1 ????Market definition
*11.1.2 ????Objectives
*11.1.3 ????Notes and caveats
**11.2 Currency conversion rates for US$
*Exhibit 91: ?Currency conversion rates for US$?
**11.3 Research Methodology
*Exhibit 92: ?Research Methodology
*Exhibit 93: ??Validation techniques employed for market sizing?
*Exhibit 94: ??Information sources
**11.4 List of abbreviations
Get lifetime access to our
Technavio Insights


