Smart Shelves Market Size and Growth Forecast 2026-2030
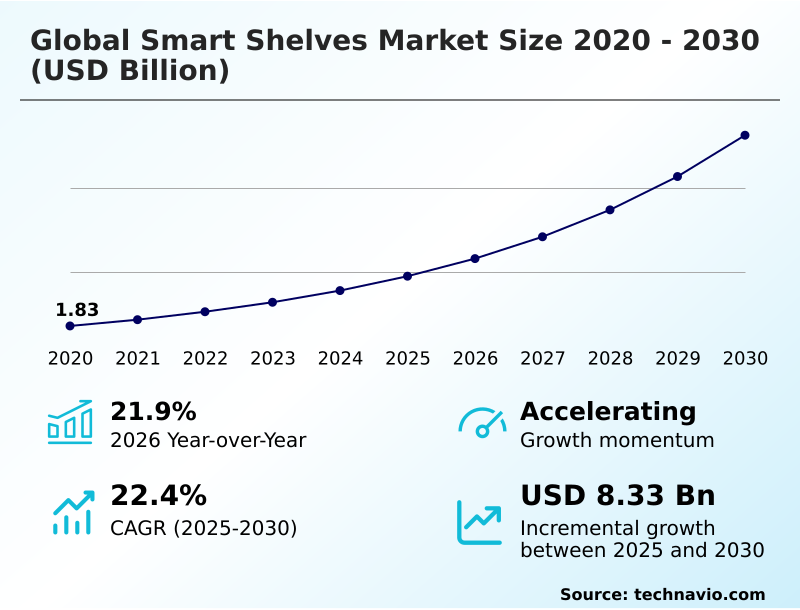
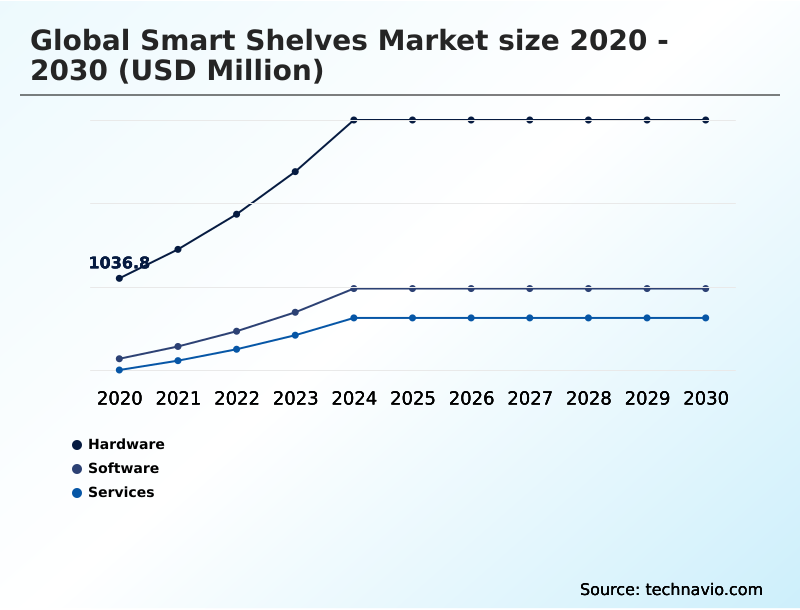
The Smart Shelves Market size was valued at USD 4.77 billion in 2025 growing at a CAGR of 22.4% during the forecast period 2026-2030.
North America accounts for 37.3% of incremental growth during the forecast period. The Hardware segment by Component was valued at USD 2.22 billion in 2024, while the RFID based smart shelves segment holds the largest revenue share by Technology.
The market is projected to grow by USD 11.27 billion from 2020 to 2030, with USD 8.33 billion of the growth expected during the forecast period of 2025 to 2030.
Get Key Insights on Market Forecast (PDF) Request Free Sample
Smart Shelves Market Overview
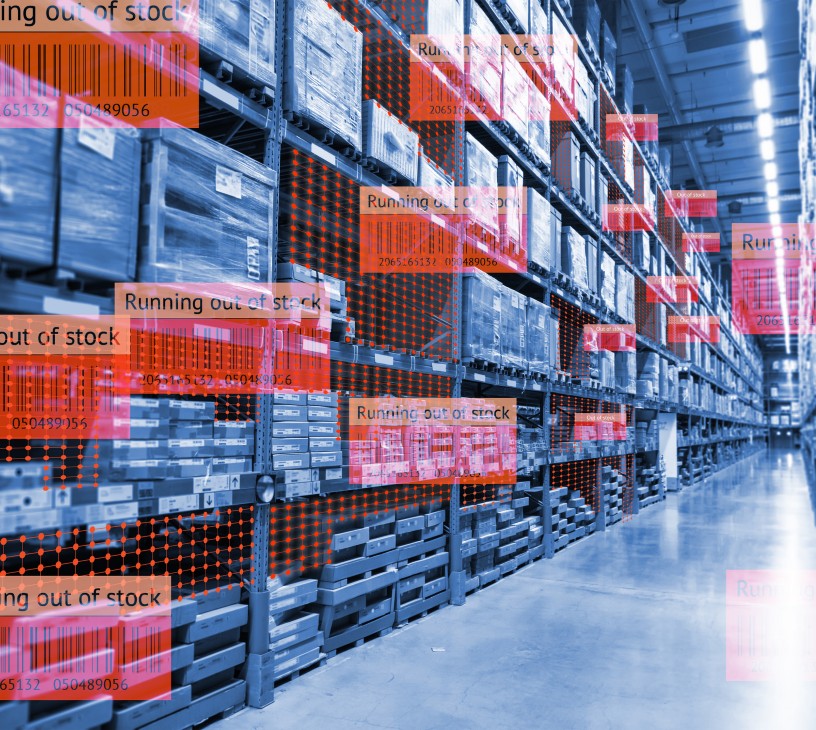
The smart shelves market is defined by the retail industry's strategic shift toward data-driven operations and enhanced store productivity. This transformation is driven by the need to achieve real-time inventory visibility and streamline replenishment processes, directly addressing the high costs associated with stockouts and manual audits. The integration of IoT retail infrastructure and sophisticated retail analytics platforms enables automated product recognition and in-store merchandising analytics. In a typical scenario, a large grocery chain deploys computer vision shelf analysis systems to monitor perishable goods, leading to a measurable reduction in spoilage by optimizing replenishment cycles based on actual shelf data. With North America contributing over 37% of the incremental growth, the region's focus on omnichannel fulfillment support and digital store transformation underscores the market's momentum. These technologies are foundational for retailers aiming to build resilient supply chains and data-centric business models compliant with frameworks like the CCPA.
Drivers, Trends, and Challenges in the Smart Shelves Market
Strategic adoption of smart shelf technology for grocery stores is becoming a key differentiator in the competitive retail landscape. The implementation of AI-powered retail shelf monitoring systems provides granular data that was previously unattainable through manual audits, directly impacting profitability by reducing stockouts and improving labor allocation.
A critical step in this process involves integrating smart shelves with ERP systems, which centralizes inventory data for a unified view across sales channels. However, the ROI calculation for smart shelf implementation remains a primary concern for procurement decision-makers, weighing high upfront capital expenditure against long-term operational gains and benefits of computer vision in retail shelves.
For instance, in warehouse environments, RFID versus computer vision for smart shelves is a key technical evaluation, with RFID excelling in case-level tracking while vision systems offer insights into planogram compliance. In customer-facing applications, data privacy concerns with smart shelf cameras necessitate strict adherence to regulations like GDPR, especially in unmanned convenience stores.
In a typical deployment, a grocery chain using weight-sensor shelves for its bulk food section can reduce inventory-related shrinkage by more than 15% compared to manual methods, directly improving margins. Ultimately, these systems are pivotal for loss prevention and enhancing planogram compliance with smart shelves.
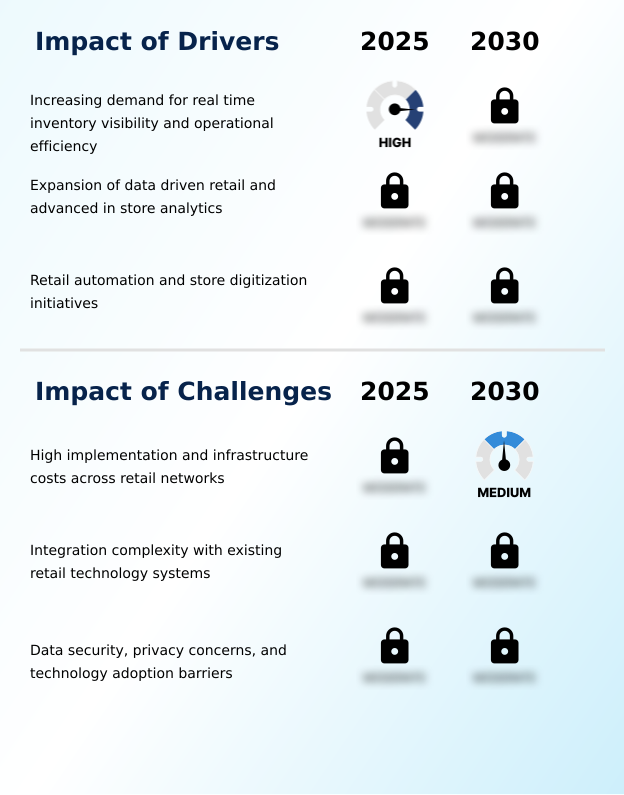
Primary Growth Driver: The critical need for real-time inventory visibility and enhanced operational efficiency is a primary driver for the adoption of smart shelf technologies.
The demand for enhanced retail operational efficiency and data-driven merchandising strategies is the core driver of market expansion, reflected in a year-over-year growth of 21.9%.
Retailers are aggressively adopting these technologies to achieve real-time inventory visibility, which is critical for reducing stockouts and improving customer satisfaction. The imperative for replenishment process automation minimizes labor costs and errors associated with manual inventory checks.
Smart shelf solutions provide essential support for omnichannel fulfillment, ensuring that physical store stock levels are accurately reflected on digital platforms. This capability is fundamental to modern retail, where a seamless connection between online and offline channels is expected.
The ability to perform sophisticated in-store merchandising analytics based on accurate shelf-level data empowers retailers to optimize layouts and promotions effectively.
Emerging Market Trend: The integration of artificial intelligence and computer vision technologies within shelf monitoring systems is a defining trend. This convergence enables automated product recognition and real-time shelf analysis.
The market's trajectory is increasingly defined by the integration of advanced technologies that automate and optimize store operations. A primary trend is the fusion of AI-driven analytics platforms with computer vision shelf analysis, enabling automated product recognition and real-time planogram compliance checks. This shift is facilitating the growth of connected store ecosystems, where IoT retail infrastructure links various in-store systems.
Furthermore, the adoption of edge computing in retail allows for faster data processing locally, reducing latency for critical tasks like out-of-stock detection.
As part of this digital store transformation, retailers are deploying systems with thermal imaging capabilities and Bluetooth low energy beacons to gather more granular data on both inventory status and shopper behavior, moving beyond simple stock counts to comprehensive in-store analytics.
Key Industry Challenge: High implementation and infrastructure costs associated with deploying solutions across extensive retail networks present a significant challenge to market growth.
Despite strong drivers, significant challenges hinder widespread market adoption, primarily the high implementation costs and the technical complexity of integration with legacy systems. The initial capital outlay for hardware, software, and network upgrades across an entire retail chain can be prohibitive for many operators.
Furthermore, ensuring seamless data flow between new smart shelf platforms and existing enterprise resource planning (ERP) or point-of-sale (POS) systems often requires significant customization and investment. Data governance and privacy concerns, particularly with camera-based computer vision systems, pose another major hurdle.
Retailers must navigate stringent regulations like GDPR, which dictate how consumer and operational data is collected and managed, adding layers of compliance risk and complexity to system deployment and management in a cloud-based retail environment.
Explore Full Market Dynamics Analysis Request Free Sample
Smart Shelves Market Segmentation
The smart shelves industry research report provides comprehensive data including region-wise segment analysis, with forecasts and analysis for the period 2026-2030, as well as historical data from 2020-2024 for the following segments.
Component Segment Analysis
The hardware segment is estimated to witness significant growth during the forecast period.
The hardware segment forms the physical foundation of the global smart shelves market, encompassing the essential components for automated retail environments.
This category includes a range of technologies from RFID shelf readers and weight sensor-based monitoring systems to advanced computer vision cameras and NFC-enabled shelf technology. These devices are crucial for shelf-level data capture, enabling continuous and autonomous sensor-based inventory monitoring.
For procurement decision-makers, the selection of hardware is a critical investment, as it directly impacts the accuracy of out-of-stock detection and the effectiveness of planogram compliance automation.
Representing the largest market segment, the initial capital expenditure on this infrastructure is significant, reflecting the strategic priority retailers place on establishing a robust framework for digital store transformation and achieving real-time inventory visibility.
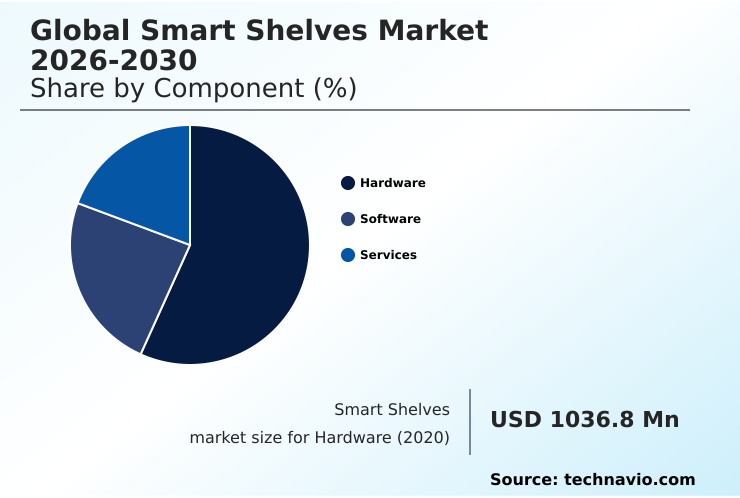
The Hardware segment was valued at USD 2.22 billion in 2024 and showed a gradual increase during the forecast period.
Smart Shelves Market by Region: North America Leads with 37.3% Growth Share
North America is estimated to contribute 37.3% to the growth of the global market during the forecast period.
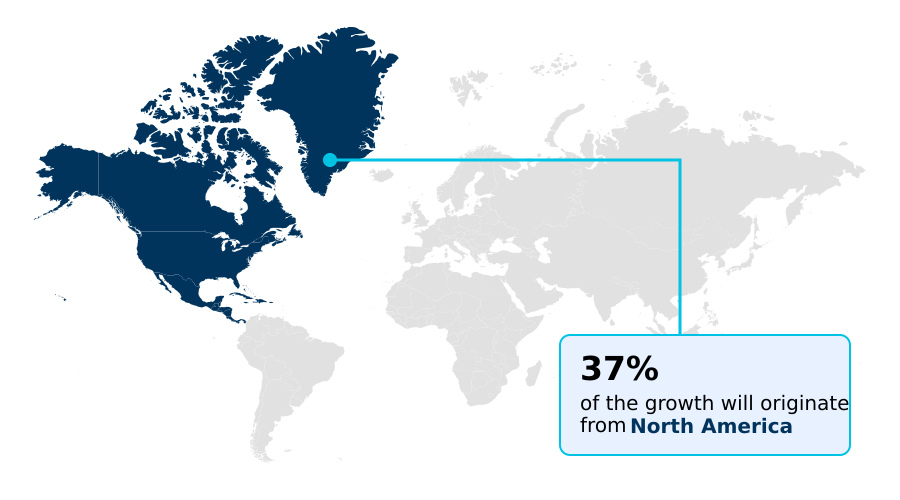
The geographic landscape of the market is led by North America, which is set to contribute approximately 37% of the market's growth, driven by large-scale digital shelf monitoring deployments in its advanced retail sector.
Europe follows, accounting for over 28% of the opportunity, with a strong focus on automated inventory management and planogram compliance automation, framed by strict GDPR standards.
The APAC region, representing about 24% of the growth, is the fastest-growing market, with rapid adoption of sensor-based inventory monitoring in its expanding modern retail infrastructure.
Across these regions, the core objective remains the same: leveraging technology to enhance operational transparency, reduce manual intervention, and gain a competitive advantage in a rapidly evolving retail environment.
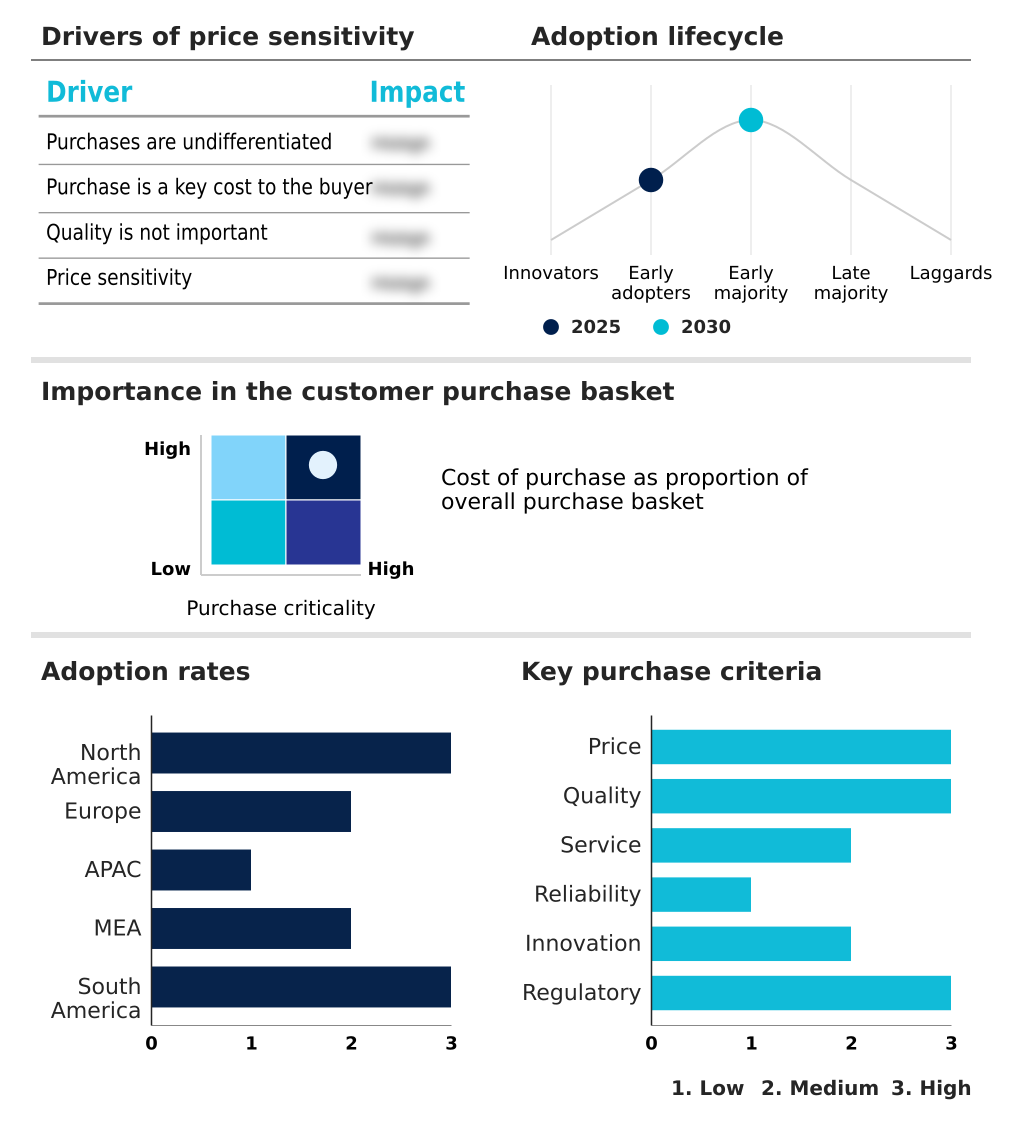
Customer Landscape Analysis for the Smart Shelves Market
The smart shelves market forecasting report includes the adoption lifecycle of the market, covering from the innovator’s stage to the laggard’s stage. It focuses on adoption rates in different regions based on penetration. Furthermore, the smart shelves market report also includes key purchase criteria and drivers of price sensitivity to help companies evaluate and develop their market growth analysis strategies.
Competitive Landscape of the Smart Shelves Market
Companies are implementing various strategies, such as strategic alliances, partnerships, mergers and acquisitions, geographical expansion, and product/service launches, to enhance their presence in the smart shelves market industry.
ACRELEC - Offers integrated digital retail solutions, including self-service kiosks and interactive displays, which form foundational components of broader smart store and automation ecosystems.
The industry research and growth report includes detailed analyses of the competitive landscape of the market and information about key companies, including:
- ACRELEC
- Advantech Co. Ltd.
- Avery Dennison Corp.
- Checkpoint Systems Inc.
- Diebold Nixdorf Incorp.
- Displaydata Ltd.
- Focal Systems Inc.
- Hangzhou Zkong Networks Co. Ltd.
- Hanshow Technology Co. Ltd.
- Johnson Controls
- NEXCOM International Co. Ltd.
- Opticon Sensors Europe BV.
- Panasonic Holdings Corp.
- PervasID
- Pricer AB
- SOLUM Europe Gmbh
- Teraoka Seiko Co. Ltd.
- Trax Technology Solutions Pte.
- VusionGroup
- Zebra Technologies Corp.
Qualitative and quantitative analysis of companies has been conducted to help clients understand the wider business environment as well as the strengths and weaknesses of key industry players. Data is qualitatively analyzed to categorize companies as pure play, category-focused, industry-focused, and diversified; it is quantitatively analyzed to categorize companies as dominant, leading, strong, tentative, and weak.
Recent Developments in the Smart Shelves Market
- In March 2025, Carrefour expanded the deployment of digital shelf monitoring technologies across selected European supermarket locations as part of its broader store digitization program designed to improve inventory accuracy and operational efficiency.
- In April 2025, Kroger expanded the deployment of digital shelf monitoring and automated inventory management technologies across selected supermarket locations as part of a broader store modernization initiative designed to improve shelf-level product visibility and reduce stock shortages.
- In April 2025, Amazon expanded the use of advanced computer vision-based shelf monitoring systems within several of its physical retail environments to improve real-time product tracking and automated inventory verification.
- In March 2025, a major American grocery conglomerate announced the full-scale deployment of vision-based smart shelf sensors across five hundred locations to optimize the replenishment of perishable goods and reduce food waste.
Research Analyst Overview: Smart Shelves Market
The market's operational reality is now dictated by the fusion of hardware and AI-driven analytics platforms. Boardroom decisions increasingly center on the total cost of ownership for digital store transformation, balancing the capital expenditure on technologies like electronic shelf labels (ESLs) and thermal imaging shelf systems against the quantifiable ROI from reduced inventory shrinkage and improved labor efficiency.
A key trend is the use of dynamic pricing integration, enabled by ESLs and Bluetooth low energy beacons, to respond to demand shifts in real time. However, the deployment of computer vision shelf analysis for in-store merchandising analytics and automated product recognition creates significant data governance obligations under frameworks like GDPR.
Retailers must evaluate how shelf-level data capture from technologies such as RFID shelf readers and weight sensor-based monitoring contributes to omnichannel fulfillment support without compromising consumer privacy. The successful adoption of sensor-based inventory monitoring hinges on a vendor's ability to provide a scalable solution for replenishment process automation and out-of-stock detection across a diverse retail footprint.
Dive into Technavio’s robust research methodology, blending expert interviews, extensive data synthesis, and validated models for unparalleled Smart Shelves Market insights. See full methodology.
| Market Scope | |
|---|---|
| Page number | 307 |
| Base year | 2025 |
| Historic period | 2020-2024 |
| Forecast period | 2026-2030 |
| Growth momentum & CAGR | Accelerate at a CAGR of 22.4% |
| Market growth 2026-2030 | USD 8331.2 million |
| Market structure | Fragmented |
| YoY growth 2025-2026(%) | 21.9% |
| Key countries | US, Canada, Mexico, Germany, UK, France, Italy, Spain, The Netherlands, China, Japan, India, South Korea, Australia, Indonesia, Saudi Arabia, UAE, South Africa, Israel, Turkey, Brazil, Argentina and Colombia |
| Competitive landscape | Leading Companies, Market Positioning of Companies, Competitive Strategies, and Industry Risks |
Smart Shelves Market: Key Questions Answered in This Report
-
What is the expected growth of the Smart Shelves Market between 2026 and 2030?
-
The Smart Shelves Market is expected to grow by USD 8.33 billion during 2026-2030, registering a CAGR of 22.4%. Year-over-year growth in 2026 is estimated at 21.9%%. This acceleration is shaped by increasing demand for real time inventory visibility and operational efficiency, which is intensifying demand across multiple end-use verticals covered in the report.
-
-
What segmentation does the market report cover?
-
The report is segmented by Component (Hardware, Software, and Services), Technology (RFID based smart shelves, Weight sensor-based, Camera and computer vision-based, and Others), End-user (Supermarkets and hypermarkets, Convenience stores, Specialty retail, and Others) and Geography (North America, Europe, APAC, Middle East and Africa, South America). Among these, the Hardware segment is estimated to witness significant growth during the forecast period, driven by rising adoption across key application areas. Each segment includes detailed qualitative and quantitative analysis, along with historical data from 2020-2024 and forecasts through 2030 with year-over-year growth rates.
-
-
Which regions are analyzed in the report?
-
The report covers North America, Europe, APAC, Middle East and Africa and South America. North America is estimated to contribute 37.3% to market growth during the forecast period. Country-level analysis includes US, Canada, Mexico, Germany, UK, France, Italy, Spain, The Netherlands, China, Japan, India, South Korea, Australia, Indonesia, Saudi Arabia, UAE, South Africa, Israel, Turkey, Brazil, Argentina and Colombia, with dedicated market size tables and year-over-year growth for each.
-
-
What are the key growth drivers and market challenges?
-
The primary driver is increasing demand for real time inventory visibility and operational efficiency, which is accelerating investment and industry demand. The main challenge is high implementation and infrastructure costs across retail networks , creating operational barriers for key market participants. The report quantifies the impact of each driver and challenge across 2026 and 2030 with comparative analysis.
-
-
Who are the major players in the Smart Shelves Market?
-
Key vendors include ACRELEC, Advantech Co. Ltd., Avery Dennison Corp., Checkpoint Systems Inc., Diebold Nixdorf Incorp., Displaydata Ltd., Focal Systems Inc., Hangzhou Zkong Networks Co. Ltd., Hanshow Technology Co. Ltd., Johnson Controls, NEXCOM International Co. Ltd., Opticon Sensors Europe BV., Panasonic Holdings Corp., PervasID, Pricer AB, SOLUM Europe Gmbh, Teraoka Seiko Co. Ltd., Trax Technology Solutions Pte., VusionGroup and Zebra Technologies Corp.. The report provides qualitative and quantitative analysis categorizing companies as dominant, leading, strong, tentative, and weak based on their market positioning. Company profiles include business segment analysis, SWOT assessment, key offerings, and recent strategic developments.
-
Smart Shelves Market Research Insights
Market dynamics are shaped by a strategic push toward retail operational efficiency and the creation of connected store ecosystems. Retailers are increasingly focused on intelligent inventory tracking to support data-driven merchandising and build frictionless checkout environments.
While North America commands the largest share of incremental growth, the APAC region is exhibiting the fastest adoption rate, with a projected CAGR of 23.2% compared to North America's 22.3%, driven by rapid modernization in its retail sector.
The deployment of these technologies, particularly those involving in-store behavioral analysis, requires careful adherence to data protection regulations like GDPR, influencing system design and vendor selection. This competitive landscape is compelling investment in automated checkout systems and integrated omnichannel retail ecosystems to maintain a competitive edge.
We can help! Our analysts can customize this smart shelves market research report to meet your requirements.
 RIA -
RIA - 
