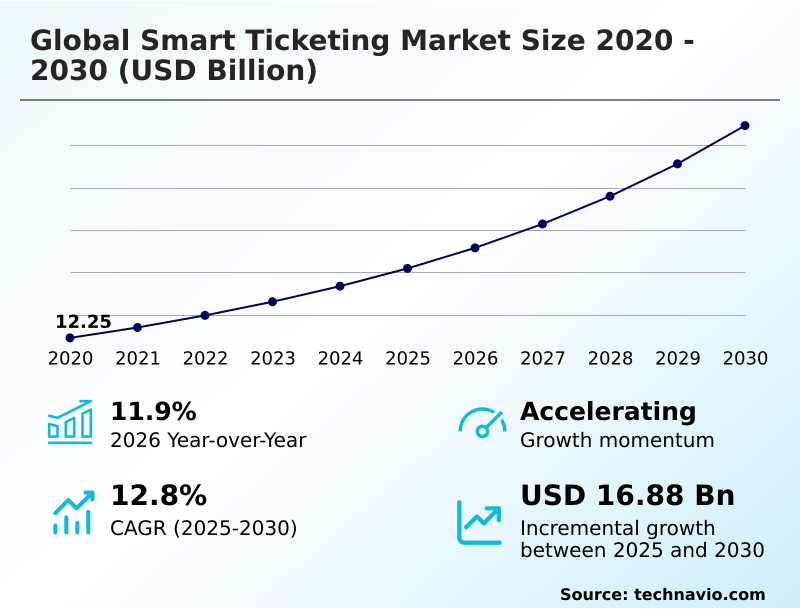
Smart Ticketing Market Size 2026-2030
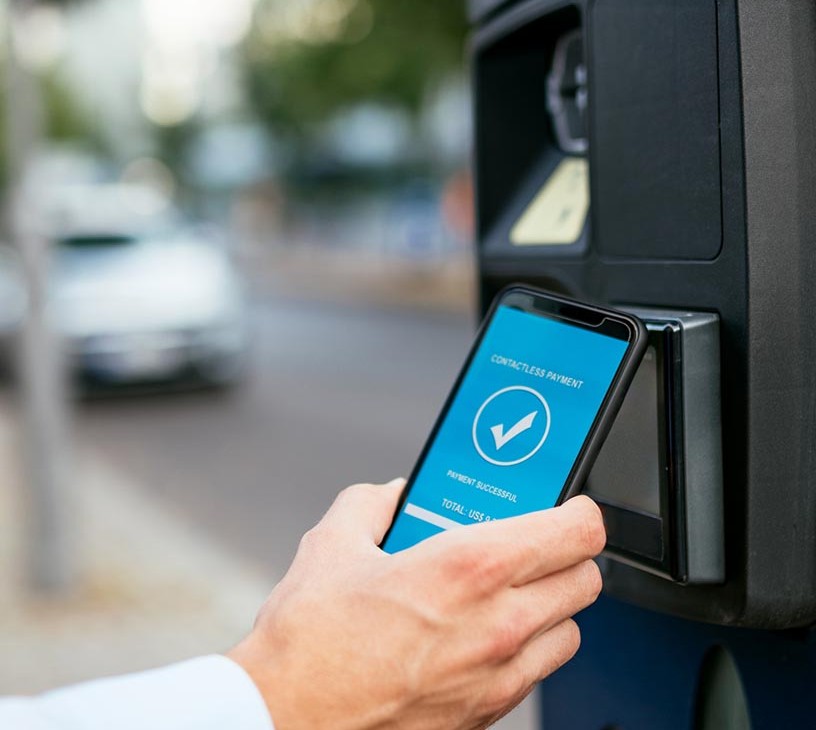
The smart ticketing market size is valued to increase by USD 16.88 billion, at a CAGR of 12.8% from 2025 to 2030. Rapid proliferation of contactless and cashless payment ecosystems will drive the smart ticketing market.
Major Market Trends & Insights
- Europe dominated the market and accounted for a 40.4% growth during the forecast period.
- By Technology - NFC segment was valued at USD 8.63 billion in 2024
- By Component - Hardware segment accounted for the largest market revenue share in 2024
Market Size & Forecast
- Market Opportunities: USD 25.10 billion
- Market Future Opportunities: USD 16.88 billion
- CAGR from 2025 to 2030 : 12.8%
Market Summary
- The smart ticketing market is undergoing a significant transformation, driven by the rapid evolution of digital infrastructure and shifting consumer preferences. The integration of mobile-centric solutions allows users to purchase and store tickets on their smartphones, reducing operational costs and providing invaluable data insights into passenger behavior.
- This shift enables more efficient resource allocation, with some operators reporting a 15% improvement in network optimization. Governments are increasingly investing in open-loop payment systems to foster interoperability between different transit modes. A key business scenario involves leveraging real-time data to implement dynamic pricing, which can manage peak-hour congestion and improve asset utilization without naming specific brands.
- This level of connectivity is essential for the realization of Mobility-as-a-Service platforms. The focus remains on creating a frictionless user experience that bridges the gap between digital payment ecosystems and physical transit infrastructure, ensuring long-term sustainability and operational resilience.
What will be the Size of the Smart Ticketing Market during the forecast period?
Get Key Insights on Market Forecast (PDF) Get Free Sample
How is the Smart Ticketing Market Segmented?
The smart ticketing industry research report provides comprehensive data (region-wise segment analysis), with forecasts and estimates in "USD million" for the period 2026-2030, as well as historical data from 2020-2024 for the following segments.
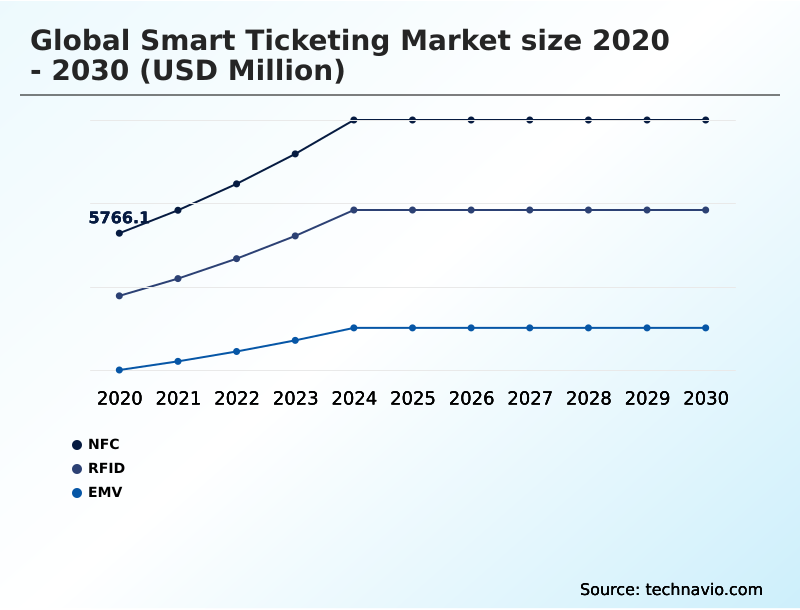
- Technology
- NFC
- RFID
- EMV
- Component
- Hardware
- Software
- Services
- Application
- Transportation
- Entertainment
- Parking
- Geography
- Europe
- UK
- Germany
- France
- North America
- US
- Canada
- Mexico
- APAC
- China
- India
- Japan
- South America
- Brazil
- Argentina
- Middle East and Africa
- UAE
- Saudi Arabia
- South Africa
- Rest of World (ROW)
- Europe
By Technology Insights
The nfc segment is estimated to witness significant growth during the forecast period.
The Near Field Communication (NFC) segment is pivotal in the smart ticketing market, facilitating secure, high-speed, contactless interactions. This technology enables the use of mobile ticketing applications and biometric ticketing technologies, shifting away from physical media.
Its integration allows for real-time journey management and supports demand-responsive transit models. The use of secure microcontrollers and contactless payment chips enhances security in automated fare collection systems.
QR code-based ticketing is also gaining traction, offering a flexible alternative for transit access management. Effective implementation of such systems, including contactless payment hardware and secure elements, can improve passenger throughput by up to 25%.
These digital ticketing platforms are central to modern urban mobility, requiring a robust transit payment back-office and mobile ticket authentication to function effectively.
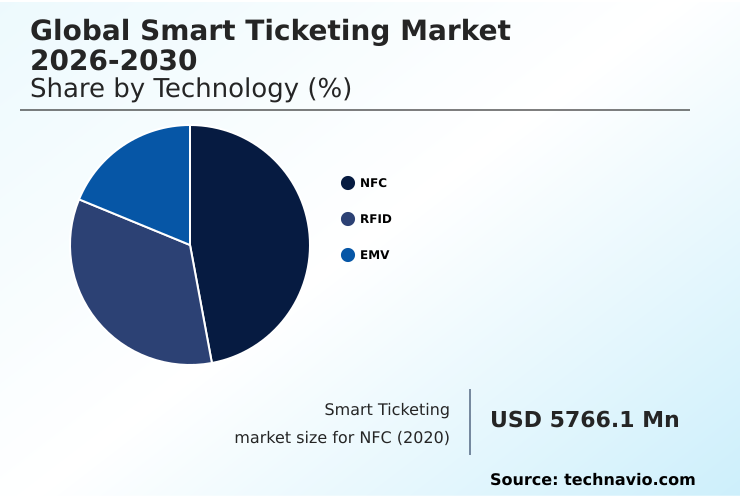
The NFC segment was valued at USD 8.63 billion in 2024 and showed a gradual increase during the forecast period.
Regional Analysis
Europe is estimated to contribute 40.4% to the growth of the global market during the forecast period.Technavio’s analysts have elaborately explained the regional trends and drivers that shape the market during the forecast period.

See How Smart Ticketing Market Demand is Rising in Europe Get Free Sample
The geographic landscape of the market is diverse, with Europe poised to contribute over 40% of the incremental growth, driven by strong government support for integrated public transit networks and cross-border transport corridors.
In North America, the focus is on upgrading legacy fare collection infrastructure with modern solutions like secure identity-based ticketing and contactless fare systems.
APAC is the fastest-growing region, characterized by large-scale deployment of digital fare collection and passenger information systems in rapidly expanding urban areas. This region sees high adoption of RFID technology.
Across all regions, the move towards cloud-based ticketing-as-a-service models is lowering entry barriers for smaller municipalities.
The implementation of digital mobility payment systems and integrated transit ticketing is creating opportunities for multi-modal ticketing systems, while automated access control and ticket vending machines are being updated to support these new technologies.
Market Dynamics
Our researchers analyzed the data with 2025 as the base year, along with the key drivers, trends, and challenges. A holistic analysis of drivers will help companies refine their marketing strategies to gain a competitive advantage.
- The strategic implementation of smart ticketing for public transportation is becoming a critical differentiator for urban centers aiming to enhance mobility and operational efficiency. The debate between NFC vs QR code ticketing continues, with NFC often providing faster transaction times while QR codes offer lower hardware deployment costs.
- Security remains a paramount concern, driving advancements in mobile ticketing app security features and the design of smart card security microcontroller technology. As the market moves from account-based ticketing vs closed-loop models toward open-loop payment systems in transit, the complexity of integration increases. EMV transit payment solutions are becoming the standard for open-loop adoption.
- The rise of MaaS platform integration challenges the traditional silos of transport operation, requiring new levels of real-time transit data interoperability. Cybersecurity in transit payment systems is a constant battle, with operators working to mitigate smart ticketing data privacy concerns and reduce fare evasion with technology.
- The cost of smart ticketing infrastructure, especially for cloud-based back-office for transit, remains a significant consideration for agencies, though systems offering predictive analytics for passenger flow can demonstrate a return on investment twice as fast as their predecessors. These advancements also extend to smart ticketing for entertainment venues, creating a unified digital access landscape.

What are the key market drivers leading to the rise in the adoption of Smart Ticketing Industry?
- The rapid proliferation of contactless and cashless payment ecosystems serves as a key driver, accelerating the adoption of digital fare collection technologies globally.
- Key drivers are reshaping the market, led by government-backed smart city initiatives that mandate intelligent transport infrastructure. This push accelerates the adoption of contactless payment ecosystems and cashless payment environments.
- Technologies like contactless smart cards, NFC technology, and EMV standards are foundational to this shift. These components enable multi-modal connectivity and the deployment of cloud-native solutions, which have been shown to reduce system maintenance costs by up to 30%.
- The rise of mobility-as-a-service (maas) platforms, which rely on centralized data platforms and universal validators, further fuels demand. The implementation of robust digital credential management is critical, with modern systems achieving a 99.9% accuracy rate in credential validation.
What are the market trends shaping the Smart Ticketing Industry?
- The proliferation of account-based ticketing and open-loop payment ecosystems represents a primary market trend. This shift is reshaping fare collection infrastructure and passenger interaction models.
- The market is advancing rapidly, driven by the adoption of account-based ticketing and open-loop payment systems, which offer a frictionless transaction experience. The move toward an integrated mobility platform is central, fostering an urban mobility ecosystem where a fare capping mechanism and dynamic pricing are standard. This is supported by ticketing software that leverages passenger analytics and real-time data interoperability.
- Modern digital access solutions utilize tokenization to enhance security, with some systems reducing fraudulent transactions by over 90%. Real-time passenger analytics also helps optimize services, leading to operational efficiency gains of up to 15%. This ongoing innovation underscores the shift toward more intelligent and user-centric transit solutions.
What challenges does the Smart Ticketing Industry face during its growth?
- The high capital expenditure and lifecycle costs associated with infrastructure modernization present a key challenge, impacting the pace of adoption for advanced systems.
- Significant challenges persist, primarily related to the high cost of upgrading fare collection infrastructure and ensuring robust cybersecurity. The deployment of multi-protocol validators and automated fare gates requires substantial upfront investment, while backend cloud servers demand continuous maintenance.
- Establishing a unified digital platform is complicated by the need for secure payment gateways and comprehensive digital identity management to prevent fare evasion detection failures. The lack of standardized protocols across different transit payment infrastructure and fare validation systems creates interoperability issues. Systems facing these challenges often report implementation delays that are 50% longer than anticipated.
- Maintaining cryptographic security across the transport payment infrastructure is a resource-intensive task, with security-related operating costs often 20% higher than initial projections.
Exclusive Technavio Analysis on Customer Landscape
The smart ticketing market forecasting report includes the adoption lifecycle of the market, covering from the innovator’s stage to the laggard’s stage. It focuses on adoption rates in different regions based on penetration. Furthermore, the smart ticketing market report also includes key purchase criteria and drivers of price sensitivity to help companies evaluate and develop their market growth analysis strategies.

Customer Landscape of Smart Ticketing Industry
Competitive Landscape
Companies are implementing various strategies, such as strategic alliances, smart ticketing market forecast, partnerships, mergers and acquisitions, geographical expansion, and product/service launches, to enhance their presence in the industry.
Amano McGann - Offerings include automated fare collection, mobile ticketing applications, and integrated multi-modal mobility platforms designed for modern transit networks.
The industry research and growth report includes detailed analyses of the competitive landscape of the market and information about key companies, including:
- Amano McGann
- Conduent Inc.
- Cubic Corp.
- Flowbird SAS
- Giesecke Devrient GmbH
- HID Global Corp.
- Hitachi Rail
- Indra Group
- Infineon Technologies AG
- Masabi Ltd.
- NEC Corp.
- NXP Semiconductors NV
- Paragon ID
- Rambus Inc.
- Scheidt and Bachmann GmbH
- Siemens AG
- SKIDATA AG
- Thales Group
- VIX IP Pty Ltd.
Qualitative and quantitative analysis of companies has been conducted to help clients understand the wider business environment as well as the strengths and weaknesses of key industry players. Data is qualitatively analyzed to categorize companies as pure play, category-focused, industry-focused, and diversified; it is quantitatively analyzed to categorize companies as dominant, leading, strong, tentative, and weak.
Recent Development and News in Smart ticketing market
- In April 2025, the United States Department of Justice implemented a significant Bulk Data Rule, establishing a new regulatory framework for transactions involving the transfer of sensitive personal data to certain foreign entities, impacting smart ticketing providers operating across international borders.
- In February 2025, Cubic Transportation Systems introduced FEnX, a next-generation fare gate system leveraging generative AI and computer vision to detect fare evasion and generate detailed real-time reports for operations and enforcement personnel.
- In January 2025, the acquisition of Flowbird Group by EasyPark Group was completed, creating a new joint company that combines digital parking expertise with full-service transportation ticketing solutions to deliver an integrated urban mobility platform.
- In December 2024, Conduent Inc. announced that the Southeastern Pennsylvania Transportation Authority finalized a plan to install approximately 100 additional Conduent 3D Fare Gate units at nine transit stations as part of a program to curb fare evasion.
Dive into Technavio’s robust research methodology, blending expert interviews, extensive data synthesis, and validated models for unparalleled Smart Ticketing Market insights. See full methodology.
| Market Scope | |
|---|---|
| Page number | 300 |
| Base year | 2025 |
| Historic period | 2020-2024 |
| Forecast period | 2026-2030 |
| Growth momentum & CAGR | Accelerate at a CAGR of 12.8% |
| Market growth 2026-2030 | USD 16880.0 million |
| Market structure | Fragmented |
| YoY growth 2025-2026(%) | 11.9% |
| Key countries | UK, Germany, France, Italy, Spain, The Netherlands, US, Canada, Mexico, China, India, Japan, South Korea, Singapore, Thailand, Brazil, Argentina, Chile, UAE, Saudi Arabia, South Africa, Turkey and Israel |
| Competitive landscape | Leading Companies, Market Positioning of Companies, Competitive Strategies, and Industry Risks |
Research Analyst Overview
- The smart ticketing market is characterized by a definitive shift toward integrated and intelligent digital ecosystems. The core of this evolution lies in the convergence of account-based ticketing and open-loop payment systems, which are becoming the standard for modern transit. This transition is not merely a technological upgrade but a strategic move that enhances the frictionless transaction experience for passengers.
- By leveraging an integrated mobility platform, operators can offer mobility-as-a-service (maas) solutions that are more convenient and efficient than traditional models. The adoption of real-time passenger analytics allows for dynamic pricing and demand-responsive transit, optimizing network performance.
- For instance, systems that utilize advanced ticketing software and digital access solutions have demonstrated the ability to improve demand forecasting accuracy by up to 20%. This data-driven approach is fundamental to building a resilient urban mobility ecosystem.
- The focus on real-time data interoperability and a robust fare capping mechanism ensures that these platforms are both user-friendly and financially sustainable for operators.
What are the Key Data Covered in this Smart Ticketing Market Research and Growth Report?
-
What is the expected growth of the Smart Ticketing Market between 2026 and 2030?
-
USD 16.88 billion, at a CAGR of 12.8%
-
-
What segmentation does the market report cover?
-
The report is segmented by Technology (NFC, RFID, and EMV), Component (Hardware, Software, and Services), Application (Transportation, Entertainment, and Parking) and Geography (Europe, North America, APAC, South America, Middle East and Africa)
-
-
Which regions are analyzed in the report?
-
Europe, North America, APAC, South America and Middle East and Africa
-
-
What are the key growth drivers and market challenges?
-
Rapid proliferation of contactless and cashless payment ecosystems, High capital expenditure and lifecycle costs of infrastructure modernization
-
-
Who are the major players in the Smart Ticketing Market?
-
Amano McGann, Conduent Inc., Cubic Corp., Flowbird SAS, Giesecke Devrient GmbH, HID Global Corp., Hitachi Rail, Indra Group, Infineon Technologies AG, Masabi Ltd., NEC Corp., NXP Semiconductors NV, Paragon ID, Rambus Inc., Scheidt and Bachmann GmbH, Siemens AG, SKIDATA AG, Thales Group and VIX IP Pty Ltd.
-
Market Research Insights
- Market dynamics are increasingly influenced by the push for a frictionless transaction experience within intelligent transport infrastructure. The adoption of an integrated mobility platform, which facilitates mobility-as-a-service (maas) and demand-responsive transit, is a key factor. Open-loop payment systems are becoming standard, with adoption rates in some urban centers exceeding 60% of all transit transactions.
- These systems leverage centralized data platforms to improve service delivery and passenger flow. The shift toward digital access solutions is supported by government-led smart city initiatives, which now account for over 40% of new infrastructure projects.
- Furthermore, a focus on the urban mobility ecosystem has led to solutions that offer more than a 25% reduction in boarding times compared to legacy systems, enhancing the overall efficiency of public transit networks.
We can help! Our analysts can customize this smart ticketing market research report to meet your requirements.
 RIA -
RIA - 
