Business Travel Market Analysis, Size, and Forecast 2026-2030: APAC (China, Japan, and India), Europe (Germany, UK, and France), North America (US, Canada, and Mexico), South America (Brazil and Argentina), Middle East and Africa (UAE, Saudi Arabia, and South Africa), and Rest of World (ROW)

Business Travel Market Analysis, Size, and Forecast 2026-2030:
APAC (China, Japan, and India), Europe (Germany, UK, and France), North America (US, Canada, and Mexico), South America (Brazil and Argentina), Middle East and Africa (UAE, Saudi Arabia, and South Africa), and Rest of World (ROW)

Published: Mar 2026 288 Pages SKU: IRTNTR44220

Market Overview at a Glance

$6,812.94 B
Market Opportunity
40.2%
CAGR 2025 - 2030
42.2%
APAC Growth
$425.35 B
Marketing segment 2024

Business Travel Market Size 2026-2030

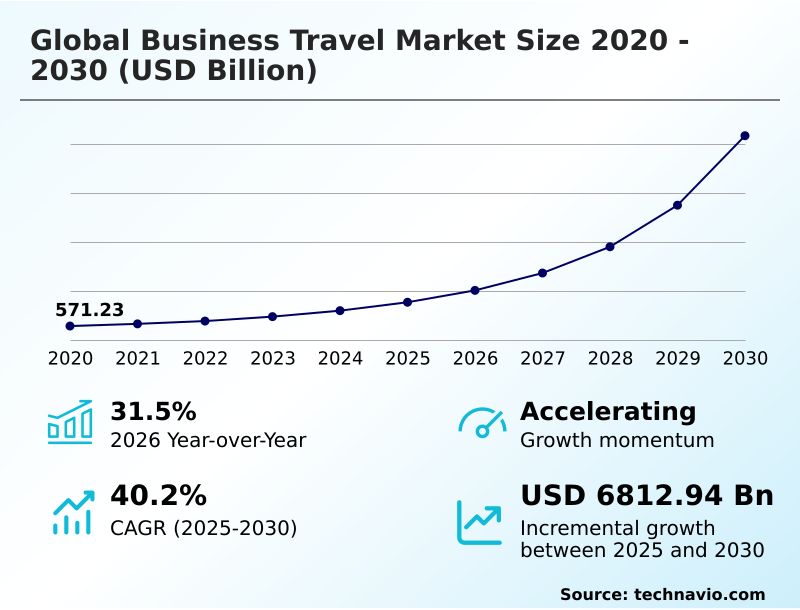
The business travel market size is valued to increase by USD 6,812.94 billion, at a CAGR of 40.2% from 2025 to 2030. Agentic AI and industrialization of zero-touch travel management systems will drive the business travel market.

Major Market Trends & Insights

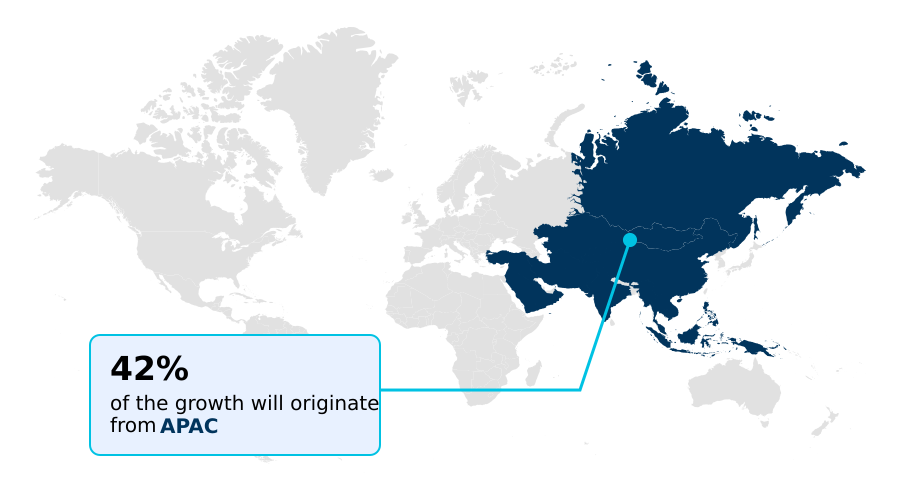
  • APAC dominated the market and accounted for a 42.2% growth during the forecast period.
  • By Application - Marketing segment was valued at USD 425.35 billion in 2024
  • By End-user - Corporate segment accounted for the largest market revenue share in 2024

Market Size & Forecast

  • Market Opportunities: USD 7,786.04 billion
  • Market Future Opportunities: USD 6,812.94 billion
  • CAGR from 2025 to 2030 : 40.2%

Market Summary

  • The business travel market is undergoing a structural shift, moving from a cost-center framework to a strategic enabler of growth and talent retention. This transition is defined by the industrialization of agentic artificial intelligence and the adoption of zero-touch travel management systems that automate logistical decisions.
  • For instance, a multinational firm launching a new product can utilize a platform that coordinates travel for its sales, marketing, and technical teams across different regions. This system would use generative AI itinerary planning to proactively book flights and accommodations that align with both dynamic corporate policies and sustainability targets, leveraging carbon-transparent procurement and new distribution capability.
  • This move toward purposeful travel logistics is driven by the need for a higher travel return on investment, where every trip is justified by measurable outcomes. The integration of multi-departmental risk ecosystems and robust duty of care 2.0 protocols further ensures traveler safety in an environment of increasing geopolitical volatility, making corporate mobility both resilient and efficient.
  • Advanced AI-enhanced expense reconciliation and biometric security integration are becoming standard, reflecting a market-wide pivot toward frictionless, data-driven operations.

What will be the Size of the Business Travel Market during the forecast period?

Get Key Insights on Market Forecast (PDF) Request Free Sample

How is the Business Travel Market Segmented?

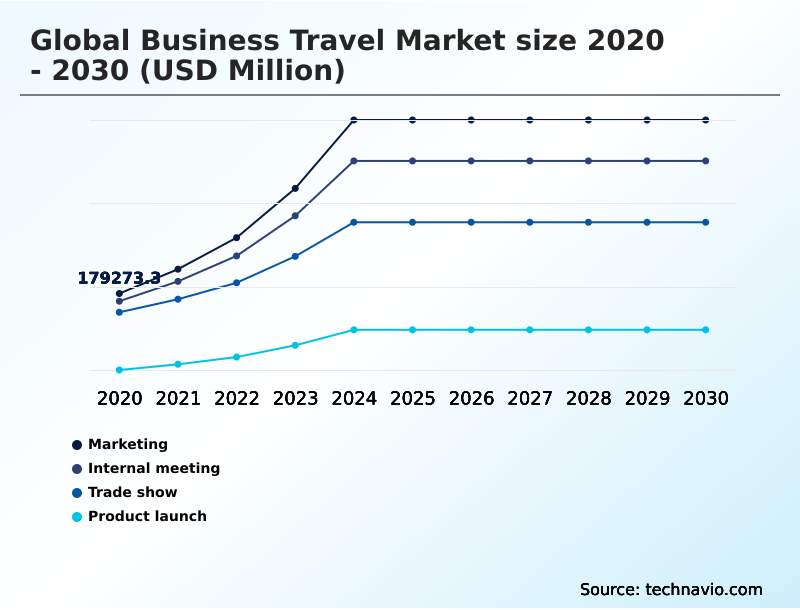
The business travel industry research report provides comprehensive data (region-wise segment analysis), with forecasts and estimates in "USD million" for the period 2026-2030, as well as historical data from 2020-2024 for the following segments.

  • Application
    • Marketing
    • Internal meeting
    • Trade show
    • Product launch
  • End-user
    • Corporate
    • Government
  • Service type
    • Accommodation
    • Transportation
    • Meetings and events
  • Geography
    • APAC
      • China
      • Japan
      • India
    • Europe
      • Germany
      • UK
      • France
    • North America
      • US
      • Canada
      • Mexico
    • South America
      • Brazil
      • Argentina
    • Middle East and Africa
      • UAE
      • Saudi Arabia
      • South Africa
    • Rest of World (ROW)

By Application Insights

The marketing segment is estimated to witness significant growth during the forecast period.

The marketing segment is defined by the strategic necessity of high-touch client engagement and brand storytelling, moving beyond digital outreach. Corporations are reinvesting in face-to-face marketing travel, using purposeful travel logistics to differentiate their value propositions.

This includes specialized travel for account management and relationship building, where physical presence fosters trust. Analyst data indicates marketing-driven travel budgets are expected to rise by 5% as firms prioritize territorial expansion and utilize phygital event experiences.

This shift underscores the belief that mobility remains a critical tool for capturing market share, supported by corporate mobility solutions and integrated travel and expense platforms that optimize travel return on investment through better data-driven supplier negotiations and real-time traveler tracking.

Request Free Sample

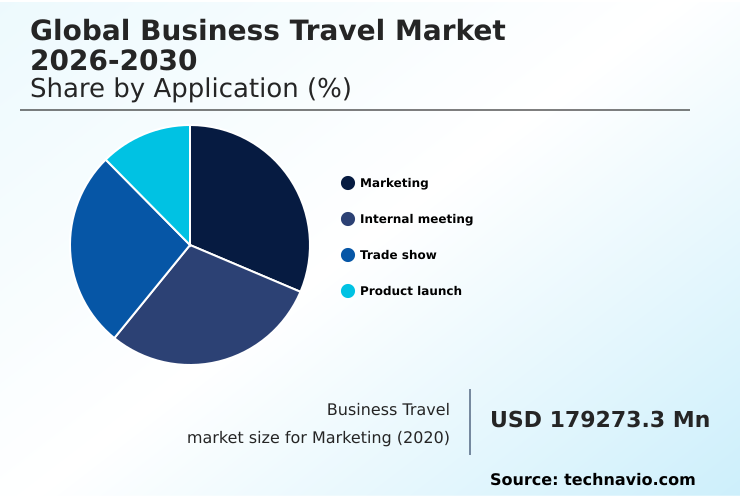
The Marketing segment was valued at USD 425.35 billion in 2024 and showed a gradual increase during the forecast period.

Request Free Sample

Regional Analysis

APAC is estimated to contribute 42.2% to the growth of the global market during the forecast period.Technavio’s analysts have elaborately explained the regional trends and drivers that shape the market during the forecast period.

See How Business Travel Market Demand is Rising in APAC Request Free Sample

The geographic landscape of the business travel market is diversifying, with distinct regional priorities shaping technology adoption. In APAC, where 65% of Indian corporations anticipate rising travel volumes, the focus is on mobile-first management tools and rapid infrastructure expansion.

Europe leads in sustainability, with corporate budgets expanding by 5.8% amid the enforcement of the corporate sustainability reporting directive, driving high-speed rail integration and the use of carbon-tracking software.

North America remains a hub for technological innovation, focusing on proactive disruption management and predictive analytics for travel. Across these regions, the demand for eco-certified accommodation networks and unified risk management is universal.

This is creating opportunities for providers offering multi-modal transportation solutions that cater to both cost and carbon-conscious policies.

Market Dynamics

Our researchers analyzed the data with 2025 as the base year, along with the key drivers, trends, and challenges. A holistic analysis of drivers will help companies refine their marketing strategies to gain a competitive advantage.

  • The modern business travel landscape requires a strategic re-evaluation of its core components, moving far beyond simple booking and expense management. A primary consideration is understanding the impact of NDC on corporate booking, which promises richer content but also introduces complexity that firms must navigate.
  • This complexity is balanced against the need to demonstrate a clear ROI of purposeful business travel, where the cost of travel vs virtual collaboration is constantly weighed. The integration of AI in travel disruption management is now critical for operational resilience, proactively re-routing employees affected by delays.
  • Concurrently, formalizing a bleisure policy and duty of care has become a key tool for talent retention, though it requires sophisticated risk management for geopolitical instability. Sustainability is a non-negotiable boardroom topic, focusing on managing scope 3 travel emissions and integrating SAF into corporate travel programs. This is where a clear strategy comparing high-speed rail versus short-haul flights becomes vital.
  • Operationally, the push is toward tech for zero-touch expense reporting, supported by biometrics for seamless airport transit. To manage structural inflation, data analytics for supplier negotiation has become essential, with firms leveraging such tools reporting up to 15% more favorable terms.
  • This data-driven approach, essential for balancing cost control with traveler satisfaction, also underpins carbon tracking for ESG reporting and ensures automated policy compliance in T&E.
  • Ultimately, the market is moving toward a model where agentic AI for proactive booking, robust duty of care in high-risk zones, and generative AI for personalized itineraries are standard, all while navigating the impact of inflation on travel budgets and optimizing multi-modal transportation routes.

What are the key market drivers leading to the rise in the adoption of Business Travel Industry?

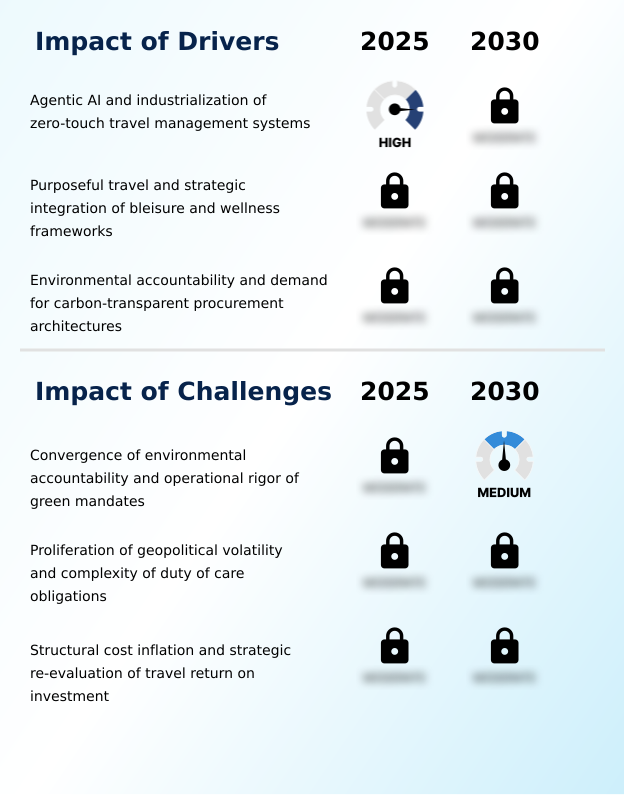
  • A key driver for the market is the adoption of agentic AI and the industrialization of zero-touch travel management systems.

  • Key market drivers are reshaping business travel around efficiency, employee well-being, and environmental accountability. The transition toward agentic artificial intelligence is central, with 65% of travel professionals prioritizing investment in technologies that enable zero-touch travel management and proactive disruption management.
  • Simultaneously, the rise of purposeful travel and strategic integration of bleisure travel frameworks are transforming corporate culture, as 68% of companies report increased blended travel. This focus on employee wellness frameworks is a direct response to talent retention challenges.
  • The third major driver is the demand for carbon-transparent procurement, compelling the use of carbon-tracking software and eco-certified accommodation networks. This sustainability focus is influencing booking behavior, with some platforms seeing a 10% shift to lower-emission options.

What are the market trends shaping the Business Travel Industry?

  • A key market trend is the institutionalization of multi-departmental risk ecosystems. This moves beyond isolated travel safety protocols to integrated Duty of Care 2.0 frameworks.

  • Market trends are pushing the business travel industry toward highly integrated, intelligent systems. The institutionalization of multi-departmental risk ecosystems represents a move toward proactive safety, where unified risk management and real-time traveler tracking are standard. This trend is complemented by the rapid adoption of AI-enhanced expense reconciliation, creating seamless financial workflows.
  • Such platforms have demonstrated the ability to reduce expense processing errors by over 90%. Another major trend is the strategic expansion of high-speed rail integration, driven by modal shift policies aimed at sustainability. In some European corridors, this has led to over 70% of corporate travelers choosing rail over air for short-haul journeys.
  • These shifts are supported by automated policy compliance and phygital experiences at events.

What challenges does the Business Travel Industry face during its growth?

  • A key challenge affecting industry growth is the convergence of environmental accountability with the operational rigor of green mandates.

  • The business travel market faces complex challenges at the intersection of regulation, security, and economics. The convergence of environmental accountability and the operational rigor of green mandates forces companies to justify the carbon footprint of every trip, often leading to a strategic reduction in travel volume.
  • Geopolitical volatility strains corporate duty of care obligations, expanding the definition of employee safety to include digital and health resilience. The most immediate challenge is structural cost inflation, with nearly 60% of travel managers struggling to balance costs against traveler satisfaction as room rates are projected to rise by 5%.
  • This pressure is compounded by AI-powered booking leakage, which can undermine negotiated corporate discounts by as much as 20%, threatening travel return on investment.

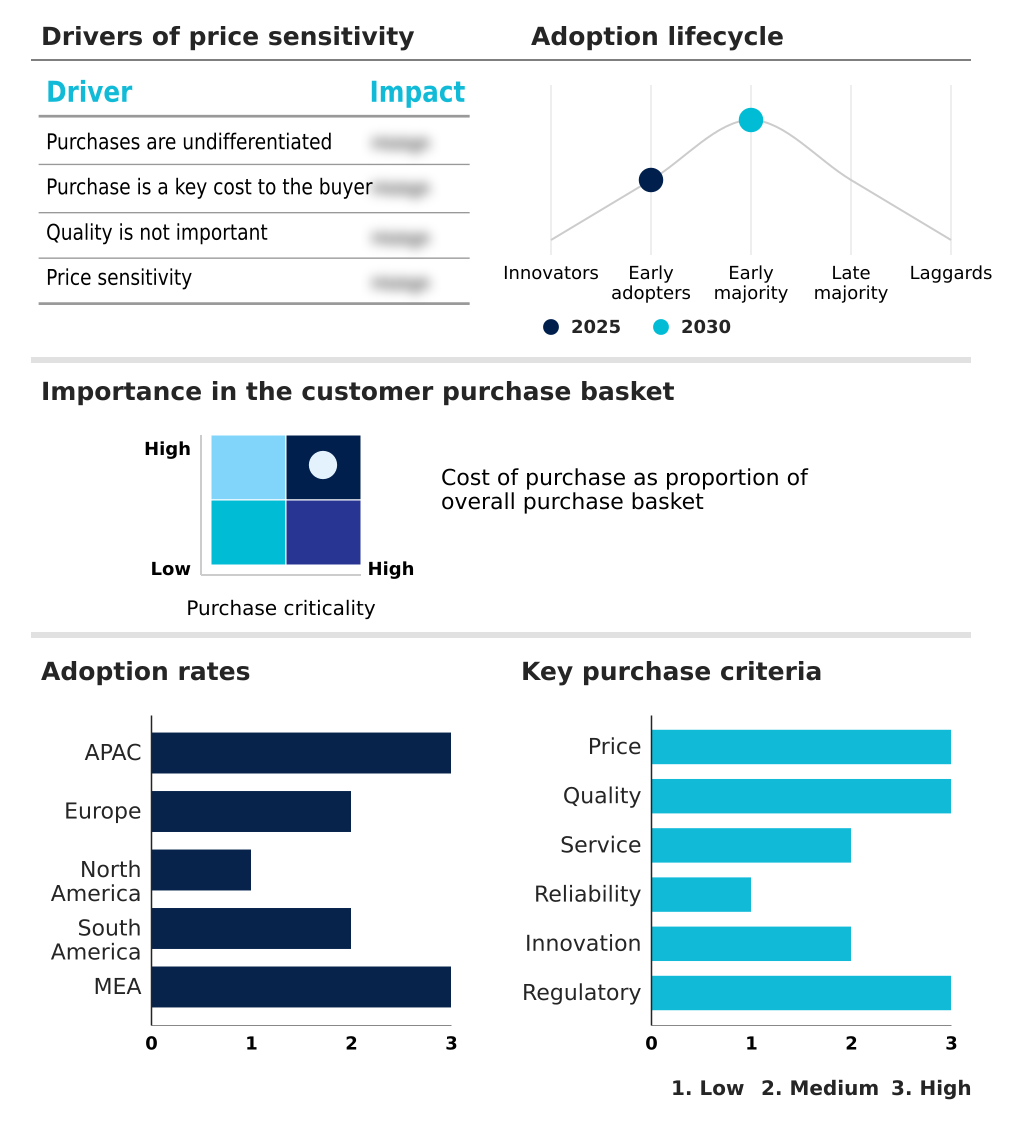
Exclusive Technavio Analysis on Customer Landscape

The business travel market forecasting report includes the adoption lifecycle of the market, covering from the innovator’s stage to the laggard’s stage. It focuses on adoption rates in different regions based on penetration. Furthermore, the business travel market report also includes key purchase criteria and drivers of price sensitivity to help companies evaluate and develop their market growth analysis strategies.

Customer Landscape of Business Travel Industry

Competitive Landscape

Companies are implementing various strategies, such as strategic alliances, business travel market forecast, partnerships, mergers and acquisitions, geographical expansion, and product/service launches, to enhance their presence in the industry.

Airbnb Inc. - Vendors provide integrated corporate travel management, leveraging technology for expense control, data-driven insights, and enhanced traveler duty-of-care through advanced software-defined platforms.

The industry research and growth report includes detailed analyses of the competitive landscape of the market and information about key companies, including:

  • Airbnb Inc.
  • ATPI Group
  • BCD Travel
  • Booking Holdings Inc.
  • Brex Payments LLC
  • Concur Technologies Inc.
  • Corporate Travel Management Ltd
  • Coupa Software Inc.
  • CWT
  • Direct Travel Inc.
  • Emburse Inc.
  • FCM Travel Solutions
  • FROSCH International Travel LLC
  • Gant Travel Ltd
  • Global Business Travel Group
  • Omega World Travel Inc.
  • Ramp Business Corp.
  • Travel Leaders Group Holdings
  • Travelator Inc.
  • World Travel Inc.

Qualitative and quantitative analysis of companies has been conducted to help clients understand the wider business environment as well as the strengths and weaknesses of key industry players. Data is qualitatively analyzed to categorize companies as pure play, category-focused, industry-focused, and diversified; it is quantitatively analyzed to categorize companies as dominant, leading, strong, tentative, and weak.

Recent Development and News in Business travel market

  • In October 2024, BCD Travel announced a strategic partnership with Riskline to deploy a next-generation travel risk management ecosystem, integrating real-time intelligence to enhance duty of care for corporate clients.
  • In November 2024, American Express Global Business Travel finalized its acquisition of CWT, a move designed to accelerate the deployment of generative AI across its software ecosystem and consolidate its global service footprint.
  • In February 2025, Direct Travel completed the global rollout of its Avenir Travel Edition, a unified travel management platform developed with Spotnana to centralize policy and data visibility for multinational corporations.
  • In April 2025, SAP Concur announced the integration of new AI-powered features into its platform, enabling automated auditing of expense reports and ensuring 100% compliance with corporate travel policies.

Dive into Technavio’s robust research methodology, blending expert interviews, extensive data synthesis, and validated models for unparalleled Business Travel Market insights. See full methodology.

Market Scope
Page number 288
Base year 2025
Historic period 2020-2024
Forecast period 2026-2030
Growth momentum & CAGR Accelerate at a CAGR of 40.2%
Market growth 2026-2030 USD 6812940.7 million
Market structure Fragmented
YoY growth 2025-2026(%) 31.5%
Key countries China, Japan, India, South Korea, Australia, Indonesia, Germany, UK, France, Italy, Spain, The Netherlands, US, Canada, Mexico, Brazil, Argentina, Chile, UAE, Saudi Arabia, South Africa, Turkey and Israel
Competitive landscape Leading Companies, Market Positioning of Companies, Competitive Strategies, and Industry Risks

Request Free Sample

Research Analyst Overview

  • The business travel market is evolving into a technologically sophisticated ecosystem where operational efficiency and strategic value are paramount. This shift is powered by agentic artificial intelligence, which enables zero-touch travel management and generative AI itinerary planning for optimized corporate mobility.
  • A key trend driving boardroom decisions is the mandatory adherence to the corporate sustainability reporting directive, which necessitates carbon-transparent procurement and comprehensive scope 3 emissions tracking. This has elevated the importance of sustainable aviation fuel and modal shift policies that favor high-speed rail integration. Firms that implement AI-enhanced expense reconciliation have reported a reduction in processing times by over 40%.
  • The landscape is also defined by a focus on security, with multi-departmental risk ecosystems, robust duty of care 2.0 protocols, and geopolitical volatility monitoring becoming standard.
  • Innovations such as biometric security integration, contactless payment systems, and digital wallet integration are creating a frictionless traveler experience, while the adoption of new distribution capability and bleisure travel frameworks addresses both commercial and employee-centric objectives, ensuring a higher travel return on investment amidst structural cost inflation.

What are the Key Data Covered in this Business Travel Market Research and Growth Report?

  • What is the expected growth of the Business Travel Market between 2026 and 2030?

    • USD 6,812.94 billion, at a CAGR of 40.2%

  • What segmentation does the market report cover?

    • The report is segmented by Application (Marketing, Internal meeting, Trade show, and Product launch), End-user (Corporate, and Government), Service Type (Accommodation, Transportation, and Meetings and events) and Geography (APAC, Europe, North America, South America, Middle East and Africa)

  • Which regions are analyzed in the report?

    • APAC, Europe, North America, South America and Middle East and Africa

  • What are the key growth drivers and market challenges?

    • Agentic AI and industrialization of zero-touch travel management systems, Convergence of environmental accountability and operational rigor of green mandates

  • Who are the major players in the Business Travel Market?

    • Airbnb Inc., ATPI Group, BCD Travel, Booking Holdings Inc., Brex Payments LLC, Concur Technologies Inc., Corporate Travel Management Ltd, Coupa Software Inc., CWT, Direct Travel Inc., Emburse Inc., FCM Travel Solutions, FROSCH International Travel LLC, Gant Travel Ltd, Global Business Travel Group, Omega World Travel Inc., Ramp Business Corp., Travel Leaders Group Holdings, Travelator Inc. and World Travel Inc.

Market Research Insights

  • The dynamics of the business travel market are shaped by the convergence of technology, employee well-being, and fiscal discipline. While 68% of corporations observe a rise in blended business and leisure trips, nearly 60% of travel managers cite balancing cost controls with traveler satisfaction as their top challenge.
  • This tension drives the adoption of integrated travel and expense platforms that deliver seamless financial workflows and automated policy compliance. The implementation of predictive analytics for travel allows for optimized booking windows, reducing airfare costs by an average of 12% for compliant users. Furthermore, proactive disruption management systems are becoming critical, offering corporate mobility solutions that enhance operational resilience.
  • These platforms support employee wellness frameworks and provide the data for strategic, data-driven supplier negotiations, reflecting a shift toward a more holistic management approach.

We can help! Our analysts can customize this business travel market research report to meet your requirements.

Get in touch

1. Executive Summary

1.1 Market overview

Executive Summary - Chart on Market Overview
Executive Summary - Data Table on Market Overview
Executive Summary - Chart on Global Market Characteristics
Executive Summary - Chart on Market by Geography
Executive Summary - Chart on Market Segmentation by Application
Executive Summary - Chart on Market Segmentation by End-user
Executive Summary - Chart on Market Segmentation by Service Type
Executive Summary - Chart on Incremental Growth
Executive Summary - Data Table on Incremental Growth
Executive Summary - Chart on Company Market Positioning

2. Technavio Analysis

2.1 Analysis of price sensitivity, lifecycle, customer purchase basket, adoption rates, and purchase criteria

2.2 Criticality of inputs and Factors of differentiation

Chart on Overview on criticality of inputs and factors of differentiation

2.3 Factors of disruption

Chart on Overview on factors of disruption

2.4 Impact of drivers and challenges

Chart on Impact of drivers and challenges in 2025 and 2030

3. Market Landscape

3.1 Market ecosystem

Chart on Parent Market
Data Table on - Parent Market

3.2 Market characteristics

Chart on Market characteristics analysis

3.3 Value chain analysis

Chart on Value chain analysis

4. Market Sizing

4.1 Market definition

Data Table on Offerings of companies included in the market definition

4.2 Market segment analysis

Market segments

4.3 Market size 2025

4.4 Market outlook: Forecast for 2025-2030

Chart on Global - Market size and forecast 2025-2030 ($ million)
Data Table on Global - Market size and forecast 2025-2030 ($ million)
Chart on Global Market: Year-over-year growth 2025-2030 (%)
Data Table on Global Market: Year-over-year growth 2025-2030 (%)

5. Historic Market Size

5.1 Global Business Travel Market 2020 - 2024

Historic Market Size - Data Table on Global Business Travel Market 2020 - 2024 ($ million)

5.2 Application segment analysis 2020 - 2024

Historic Market Size - Application Segment 2020 - 2024 ($ million)

5.3 End-user segment analysis 2020 - 2024

Historic Market Size - End-user Segment 2020 - 2024 ($ million)

5.4 Service Type segment analysis 2020 - 2024

Historic Market Size - Service Type Segment 2020 - 2024 ($ million)

5.5 Geography segment analysis 2020 - 2024

Historic Market Size - Geography Segment 2020 - 2024 ($ million)

5.6 Country segment analysis 2020 - 2024

Historic Market Size - Country Segment 2020 - 2024 ($ million)

6. Qualitative Analysis

6.1 Impact of AI in global business travel market

7. Five Forces Analysis

7.1 Five forces summary

Five forces analysis - Comparison between 2025 and 2030

7.2 Bargaining power of buyers

Bargaining power of buyers - Impact of key factors 2025 and 2030

7.3 Bargaining power of suppliers

Bargaining power of suppliers - Impact of key factors in 2025 and 2030

7.4 Threat of new entrants

Threat of new entrants - Impact of key factors in 2025 and 2030

7.5 Threat of substitutes

Threat of substitutes - Impact of key factors in 2025 and 2030

7.6 Threat of rivalry

Threat of rivalry - Impact of key factors in 2025 and 2030

7.7 Market condition

Chart on Market condition - Five forces 2025 and 2030

8. Market Segmentation by Application

8.1 Market segments

Chart on Application - Market share 2025-2030 (%)
Data Table on Application - Market share 2025-2030 (%)

8.2 Comparison by Application

Chart on Comparison by Application
Data Table on Comparison by Application

8.3 Marketing - Market size and forecast 2025-2030

Chart on Marketing - Market size and forecast 2025-2030 ($ million)
Data Table on Marketing - Market size and forecast 2025-2030 ($ million)
Chart on Marketing - Year-over-year growth 2025-2030 (%)
Data Table on Marketing - Year-over-year growth 2025-2030 (%)

8.4 Internal meeting - Market size and forecast 2025-2030

Chart on Internal meeting - Market size and forecast 2025-2030 ($ million)
Data Table on Internal meeting - Market size and forecast 2025-2030 ($ million)
Chart on Internal meeting - Year-over-year growth 2025-2030 (%)
Data Table on Internal meeting - Year-over-year growth 2025-2030 (%)

8.5 Trade show - Market size and forecast 2025-2030

Chart on Trade show - Market size and forecast 2025-2030 ($ million)
Data Table on Trade show - Market size and forecast 2025-2030 ($ million)
Chart on Trade show - Year-over-year growth 2025-2030 (%)
Data Table on Trade show - Year-over-year growth 2025-2030 (%)

8.6 Product launch - Market size and forecast 2025-2030

Chart on Product launch - Market size and forecast 2025-2030 ($ million)
Data Table on Product launch - Market size and forecast 2025-2030 ($ million)
Chart on Product launch - Year-over-year growth 2025-2030 (%)
Data Table on Product launch - Year-over-year growth 2025-2030 (%)

8.7 Market opportunity by Application

Market opportunity by Application ($ million)
Data Table on Market opportunity by Application ($ million)

9. Market Segmentation by End-user

9.1 Market segments

Chart on End-user - Market share 2025-2030 (%)
Data Table on End-user - Market share 2025-2030 (%)

9.2 Comparison by End-user

Chart on Comparison by End-user
Data Table on Comparison by End-user

9.3 Corporate - Market size and forecast 2025-2030

Chart on Corporate - Market size and forecast 2025-2030 ($ million)
Data Table on Corporate - Market size and forecast 2025-2030 ($ million)
Chart on Corporate - Year-over-year growth 2025-2030 (%)
Data Table on Corporate - Year-over-year growth 2025-2030 (%)

9.4 Government - Market size and forecast 2025-2030

Chart on Government - Market size and forecast 2025-2030 ($ million)
Data Table on Government - Market size and forecast 2025-2030 ($ million)
Chart on Government - Year-over-year growth 2025-2030 (%)
Data Table on Government - Year-over-year growth 2025-2030 (%)

9.5 Market opportunity by End-user

Market opportunity by End-user ($ million)
Data Table on Market opportunity by End-user ($ million)

10. Market Segmentation by Service Type

10.1 Market segments

Chart on Service Type - Market share 2025-2030 (%)
Data Table on Service Type - Market share 2025-2030 (%)

10.2 Comparison by Service Type

Chart on Comparison by Service Type
Data Table on Comparison by Service Type

10.3 Accommodation - Market size and forecast 2025-2030

Chart on Accommodation - Market size and forecast 2025-2030 ($ million)
Data Table on Accommodation - Market size and forecast 2025-2030 ($ million)
Chart on Accommodation - Year-over-year growth 2025-2030 (%)
Data Table on Accommodation - Year-over-year growth 2025-2030 (%)

10.4 Transportation - Market size and forecast 2025-2030

Chart on Transportation - Market size and forecast 2025-2030 ($ million)
Data Table on Transportation - Market size and forecast 2025-2030 ($ million)
Chart on Transportation - Year-over-year growth 2025-2030 (%)
Data Table on Transportation - Year-over-year growth 2025-2030 (%)

10.5 Meetings and events - Market size and forecast 2025-2030

Chart on Meetings and events - Market size and forecast 2025-2030 ($ million)
Data Table on Meetings and events - Market size and forecast 2025-2030 ($ million)
Chart on Meetings and events - Year-over-year growth 2025-2030 (%)
Data Table on Meetings and events - Year-over-year growth 2025-2030 (%)

10.6 Market opportunity by Service Type

Market opportunity by Service Type ($ million)
Data Table on Market opportunity by Service Type ($ million)

11. Customer Landscape

11.1 Customer landscape overview

Analysis of price sensitivity, lifecycle, customer purchase basket, adoption rates, and purchase criteria

12. Geographic Landscape

12.1 Geographic segmentation

Chart on Market share by geography 2025-2030 (%)
Data Table on Market share by geography 2025-2030 (%)

12.2 Geographic comparison

Chart on Geographic comparison
Data Table on Geographic comparison

12.3 APAC - Market size and forecast 2025-2030

Chart on APAC - Market size and forecast 2025-2030 ($ million)
Data Table on APAC - Market size and forecast 2025-2030 ($ million)
Chart on APAC - Year-over-year growth 2025-2030 (%)
Data Table on APAC - Year-over-year growth 2025-2030 (%)
Chart on Regional Comparison - APAC
Data Table on Regional Comparison - APAC

12.3.1 China - Market size and forecast 2025-2030

Chart on China - Market size and forecast 2025-2030 ($ million)
Data Table on China - Market size and forecast 2025-2030 ($ million)
Chart on China - Year-over-year growth 2025-2030 (%)
Data Table on China - Year-over-year growth 2025-2030 (%)

12.3.2 Japan - Market size and forecast 2025-2030

Chart on Japan - Market size and forecast 2025-2030 ($ million)
Data Table on Japan - Market size and forecast 2025-2030 ($ million)
Chart on Japan - Year-over-year growth 2025-2030 (%)
Data Table on Japan - Year-over-year growth 2025-2030 (%)

12.3.3 India - Market size and forecast 2025-2030

Chart on India - Market size and forecast 2025-2030 ($ million)
Data Table on India - Market size and forecast 2025-2030 ($ million)
Chart on India - Year-over-year growth 2025-2030 (%)
Data Table on India - Year-over-year growth 2025-2030 (%)

12.3.4 South Korea - Market size and forecast 2025-2030

Chart on South Korea - Market size and forecast 2025-2030 ($ million)
Data Table on South Korea - Market size and forecast 2025-2030 ($ million)
Chart on South Korea - Year-over-year growth 2025-2030 (%)
Data Table on South Korea - Year-over-year growth 2025-2030 (%)

12.3.5 Australia - Market size and forecast 2025-2030

Chart on Australia - Market size and forecast 2025-2030 ($ million)
Data Table on Australia - Market size and forecast 2025-2030 ($ million)
Chart on Australia - Year-over-year growth 2025-2030 (%)
Data Table on Australia - Year-over-year growth 2025-2030 (%)

12.3.6 Indonesia - Market size and forecast 2025-2030

Chart on Indonesia - Market size and forecast 2025-2030 ($ million)
Data Table on Indonesia - Market size and forecast 2025-2030 ($ million)
Chart on Indonesia - Year-over-year growth 2025-2030 (%)
Data Table on Indonesia - Year-over-year growth 2025-2030 (%)

12.4 Europe - Market size and forecast 2025-2030

Chart on Europe - Market size and forecast 2025-2030 ($ million)
Data Table on Europe - Market size and forecast 2025-2030 ($ million)
Chart on Europe - Year-over-year growth 2025-2030 (%)
Data Table on Europe - Year-over-year growth 2025-2030 (%)
Chart on Regional Comparison - Europe
Data Table on Regional Comparison - Europe

12.4.1 Germany - Market size and forecast 2025-2030

Chart on Germany - Market size and forecast 2025-2030 ($ million)
Data Table on Germany - Market size and forecast 2025-2030 ($ million)
Chart on Germany - Year-over-year growth 2025-2030 (%)
Data Table on Germany - Year-over-year growth 2025-2030 (%)

12.4.2 UK - Market size and forecast 2025-2030

Chart on UK - Market size and forecast 2025-2030 ($ million)
Data Table on UK - Market size and forecast 2025-2030 ($ million)
Chart on UK - Year-over-year growth 2025-2030 (%)
Data Table on UK - Year-over-year growth 2025-2030 (%)

12.4.3 France - Market size and forecast 2025-2030

Chart on France - Market size and forecast 2025-2030 ($ million)
Data Table on France - Market size and forecast 2025-2030 ($ million)
Chart on France - Year-over-year growth 2025-2030 (%)
Data Table on France - Year-over-year growth 2025-2030 (%)

12.4.4 Italy - Market size and forecast 2025-2030

Chart on Italy - Market size and forecast 2025-2030 ($ million)
Data Table on Italy - Market size and forecast 2025-2030 ($ million)
Chart on Italy - Year-over-year growth 2025-2030 (%)
Data Table on Italy - Year-over-year growth 2025-2030 (%)

12.4.5 Spain - Market size and forecast 2025-2030

Chart on Spain - Market size and forecast 2025-2030 ($ million)
Data Table on Spain - Market size and forecast 2025-2030 ($ million)
Chart on Spain - Year-over-year growth 2025-2030 (%)
Data Table on Spain - Year-over-year growth 2025-2030 (%)

12.4.6 The Netherlands - Market size and forecast 2025-2030

Chart on The Netherlands - Market size and forecast 2025-2030 ($ million)
Data Table on The Netherlands - Market size and forecast 2025-2030 ($ million)
Chart on The Netherlands - Year-over-year growth 2025-2030 (%)
Data Table on The Netherlands - Year-over-year growth 2025-2030 (%)

12.5 North America - Market size and forecast 2025-2030

Chart on North America - Market size and forecast 2025-2030 ($ million)
Data Table on North America - Market size and forecast 2025-2030 ($ million)
Chart on North America - Year-over-year growth 2025-2030 (%)
Data Table on North America - Year-over-year growth 2025-2030 (%)
Chart on Regional Comparison - North America
Data Table on Regional Comparison - North America

12.5.1 US - Market size and forecast 2025-2030

Chart on US - Market size and forecast 2025-2030 ($ million)
Data Table on US - Market size and forecast 2025-2030 ($ million)
Chart on US - Year-over-year growth 2025-2030 (%)
Data Table on US - Year-over-year growth 2025-2030 (%)

12.5.2 Canada - Market size and forecast 2025-2030

Chart on Canada - Market size and forecast 2025-2030 ($ million)
Data Table on Canada - Market size and forecast 2025-2030 ($ million)
Chart on Canada - Year-over-year growth 2025-2030 (%)
Data Table on Canada - Year-over-year growth 2025-2030 (%)

12.5.3 Mexico - Market size and forecast 2025-2030

Chart on Mexico - Market size and forecast 2025-2030 ($ million)
Data Table on Mexico - Market size and forecast 2025-2030 ($ million)
Chart on Mexico - Year-over-year growth 2025-2030 (%)
Data Table on Mexico - Year-over-year growth 2025-2030 (%)

12.6 South America - Market size and forecast 2025-2030

Chart on South America - Market size and forecast 2025-2030 ($ million)
Data Table on South America - Market size and forecast 2025-2030 ($ million)
Chart on South America - Year-over-year growth 2025-2030 (%)
Data Table on South America - Year-over-year growth 2025-2030 (%)
Chart on Regional Comparison - South America
Data Table on Regional Comparison - South America

12.6.1 Brazil - Market size and forecast 2025-2030

Chart on Brazil - Market size and forecast 2025-2030 ($ million)
Data Table on Brazil - Market size and forecast 2025-2030 ($ million)
Chart on Brazil - Year-over-year growth 2025-2030 (%)
Data Table on Brazil - Year-over-year growth 2025-2030 (%)

12.6.2 Argentina - Market size and forecast 2025-2030

Chart on Argentina - Market size and forecast 2025-2030 ($ million)
Data Table on Argentina - Market size and forecast 2025-2030 ($ million)
Chart on Argentina - Year-over-year growth 2025-2030 (%)
Data Table on Argentina - Year-over-year growth 2025-2030 (%)

12.6.3 Chile - Market size and forecast 2025-2030

Chart on Chile - Market size and forecast 2025-2030 ($ million)
Data Table on Chile - Market size and forecast 2025-2030 ($ million)
Chart on Chile - Year-over-year growth 2025-2030 (%)
Data Table on Chile - Year-over-year growth 2025-2030 (%)

12.7 Middle East and Africa - Market size and forecast 2025-2030

Chart on Middle East and Africa - Market size and forecast 2025-2030 ($ million)
Data Table on Middle East and Africa - Market size and forecast 2025-2030 ($ million)
Chart on Middle East and Africa - Year-over-year growth 2025-2030 (%)
Data Table on Middle East and Africa - Year-over-year growth 2025-2030 (%)
Chart on Regional Comparison - Middle East and Africa
Data Table on Regional Comparison - Middle East and Africa

12.7.1 UAE - Market size and forecast 2025-2030

Chart on UAE - Market size and forecast 2025-2030 ($ million)
Data Table on UAE - Market size and forecast 2025-2030 ($ million)
Chart on UAE - Year-over-year growth 2025-2030 (%)
Data Table on UAE - Year-over-year growth 2025-2030 (%)

12.7.2 Saudi Arabia - Market size and forecast 2025-2030

Chart on Saudi Arabia - Market size and forecast 2025-2030 ($ million)
Data Table on Saudi Arabia - Market size and forecast 2025-2030 ($ million)
Chart on Saudi Arabia - Year-over-year growth 2025-2030 (%)
Data Table on Saudi Arabia - Year-over-year growth 2025-2030 (%)

12.7.3 South Africa - Market size and forecast 2025-2030

Chart on South Africa - Market size and forecast 2025-2030 ($ million)
Data Table on South Africa - Market size and forecast 2025-2030 ($ million)
Chart on South Africa - Year-over-year growth 2025-2030 (%)
Data Table on South Africa - Year-over-year growth 2025-2030 (%)

12.7.4 Turkey - Market size and forecast 2025-2030

Chart on Turkey - Market size and forecast 2025-2030 ($ million)
Data Table on Turkey - Market size and forecast 2025-2030 ($ million)
Chart on Turkey - Year-over-year growth 2025-2030 (%)
Data Table on Turkey - Year-over-year growth 2025-2030 (%)

12.7.5 Israel - Market size and forecast 2025-2030

Chart on Israel - Market size and forecast 2025-2030 ($ million)
Data Table on Israel - Market size and forecast 2025-2030 ($ million)
Chart on Israel - Year-over-year growth 2025-2030 (%)
Data Table on Israel - Year-over-year growth 2025-2030 (%)

12.8 Market opportunity by geography

Market opportunity by geography ($ million)
Data Tables on Market opportunity by geography ($ million)

13. Drivers, Challenges, and Opportunity

13.1 Market drivers

Agentic AI and industrialization of zero-touch travel management systems
Purposeful travel and strategic integration of bleisure and wellness frameworks
Environmental accountability and demand for carbon-transparent procurement architectures

13.2 Market challenges

Convergence of environmental accountability and operational rigor of green mandates
Proliferation of geopolitical volatility and complexity of duty of care obligations
Structural cost inflation and strategic re-evaluation of travel return on investment

13.3 Impact of drivers and challenges

Impact of drivers and challenges in 2025 and 2030

13.4 Market opportunities

Multi-departmental risk ecosystems and duty of care 2.0
AI-enhanced expense reconciliation and seamless financial workflows
Strategic expansion of high-speed rail integration and modal shift policies

14. Competitive Landscape

14.1 Overview

14.2

Overview on criticality of inputs and factors of differentiation

14.3 Landscape disruption

Overview on factors of disruption

14.4 Industry risks

Impact of key risks on business

15. Competitive Analysis

15.1 Companies profiled

Companies covered

15.2 Company ranking index

15.3 Market positioning of companies

Matrix on companies position and classification

15.4 Airbnb Inc.

Airbnb Inc. - Overview
Airbnb Inc. - Product / Service
Airbnb Inc. - Key offerings
SWOT

15.5 ATPI Group

ATPI Group - Overview
ATPI Group - Product / Service
ATPI Group - Key offerings
SWOT

15.6 BCD Travel

BCD Travel - Overview
BCD Travel - Product / Service
BCD Travel - Key offerings
SWOT

15.7 Booking Holdings Inc.

Booking Holdings Inc. - Overview
Booking Holdings Inc. - Product / Service
Booking Holdings Inc. - Key offerings
SWOT

15.8 Brex Payments LLC

Brex Payments LLC - Overview
Brex Payments LLC - Product / Service
Brex Payments LLC - Key offerings
SWOT

15.9 Corporate Travel Management Ltd

Corporate Travel Management Ltd - Overview
Corporate Travel Management Ltd - Product / Service
Corporate Travel Management Ltd - Key offerings
SWOT

15.10 Coupa Software Inc.

Coupa Software Inc. - Overview
Coupa Software Inc. - Product / Service
Coupa Software Inc. - Key offerings
SWOT

15.11 Direct Travel Inc.

Direct Travel Inc. - Overview
Direct Travel Inc. - Product / Service
Direct Travel Inc. - Key offerings
SWOT

15.12 Emburse Inc.

Emburse Inc. - Overview
Emburse Inc. - Product / Service
Emburse Inc. - Key offerings
SWOT

15.13 FCM Travel Solutions

FCM Travel Solutions - Overview
FCM Travel Solutions - Product / Service
FCM Travel Solutions - Key offerings
SWOT

15.14 Gant Travel Ltd

Gant Travel Ltd - Overview
Gant Travel Ltd - Product / Service
Gant Travel Ltd - Key offerings
SWOT

15.15 Global Business Travel Group

Global Business Travel Group - Overview
Global Business Travel Group - Business segments
Global Business Travel Group - Key offerings
Global Business Travel Group - Segment focus
SWOT

15.16 Omega World Travel Inc.

Omega World Travel Inc. - Overview
Omega World Travel Inc. - Product / Service
Omega World Travel Inc. - Key offerings
SWOT

15.17 Travel Leaders Group Holdings

Travel Leaders Group Holdings - Overview
Travel Leaders Group Holdings - Product / Service
Travel Leaders Group Holdings - Key offerings
SWOT

15.18 World Travel Inc.

World Travel Inc. - Overview
World Travel Inc. - Product / Service
World Travel Inc. - Key offerings
SWOT

16. Appendix

16.1 Scope of the report

Market definition
Objectives
Notes and caveats

16.2 Inclusions and exclusions checklist

Inclusions checklist
Exclusions checklist

16.3 Currency conversion rates for US$

16.4 Research methodology

16.5 Data procurement

Information sources

16.6 Data validation

16.7 Validation techniques employed for market sizing

16.8 Data synthesis

16.9 360 degree market analysis

16.10 List of abbreviations

Research Methodology

Technavio presents a detailed picture of the market by way of study, synthesis, and summation of data from multiple sources. The analysts have presented the various facets of the market with a particular focus on identifying the key industry influencers. The data thus presented is comprehensive, reliable, and the result of extensive research, both primary and secondary.

INFORMATION SOURCES

Primary sources

  • Manufacturers and suppliers
  • Channel partners
  • Industry experts
  • Strategic decision makers

Secondary sources

  • Industry journals and periodicals
  • Government data
  • Financial reports of key industry players
  • Historical data
  • Press releases

DATA ANALYSIS

Data Synthesis

  • Collation of data
  • Estimation of key figures
  • Analysis of derived insights

Data Validation

  • Triangulation with data models
  • Reference against proprietary databases
  • Corroboration with industry experts

REPORT WRITING

Qualitative

  • Market drivers
  • Market challenges
  • Market trends
  • Five forces analysis

Quantitative

  • Market size and forecast
  • Market segmentation
  • Geographical insights
  • Competitive landscape

Interested in this report?

Get your sample now to see our research methodology and insights!

Download Now

Frequently Asked Questions

Business Travel market growth will increase by USD 6812940.7 million during 2026-2030.

The Business Travel market is expected to grow at a CAGR of 40.2% during 2026-2030.

Business Travel market is segmented by Application (Marketing, Internal meeting, Trade show, Product launch) End-user (Corporate, Government) Service type (Accommodation, Transportation, Meetings and events)

Airbnb Inc., ATPI Group, BCD Travel, Booking Holdings Inc., Brex Payments LLC, Concur Technologies Inc., Corporate Travel Management Ltd, Coupa Software Inc., CWT, Direct Travel Inc., Emburse Inc., FCM Travel Solutions, FROSCH International Travel LLC, Gant Travel Ltd, Global Business Travel Group, Omega World Travel Inc., Ramp Business Corp., Travel Leaders Group Holdings, Travelator Inc., World Travel Inc. are a few of the key vendors in the Business Travel market.

APAC will register the highest growth rate of 42.2% among the other regions. Therefore, the Business Travel market in APAC is expected to garner significant business opportunities for the vendors during the forecast period.

China, Japan, India, South Korea, Australia, Indonesia, Germany, UK, France, Italy, Spain, The Netherlands, US, Canada, Mexico, Brazil, Argentina, Chile, UAE, Saudi Arabia, South Africa, Turkey, Israel

  • Agentic AI and industrialization of zero-touch travel management systems is the driving factor this market.

The Business Travel market vendors should focus on grabbing business opportunities from the Application segment as it accounted for the largest market share in the base year.
RIA - Research AI Assistant
Ask RIA