
Soft Skills Measurement Software Market Size and Growth Forecast 2026-2030
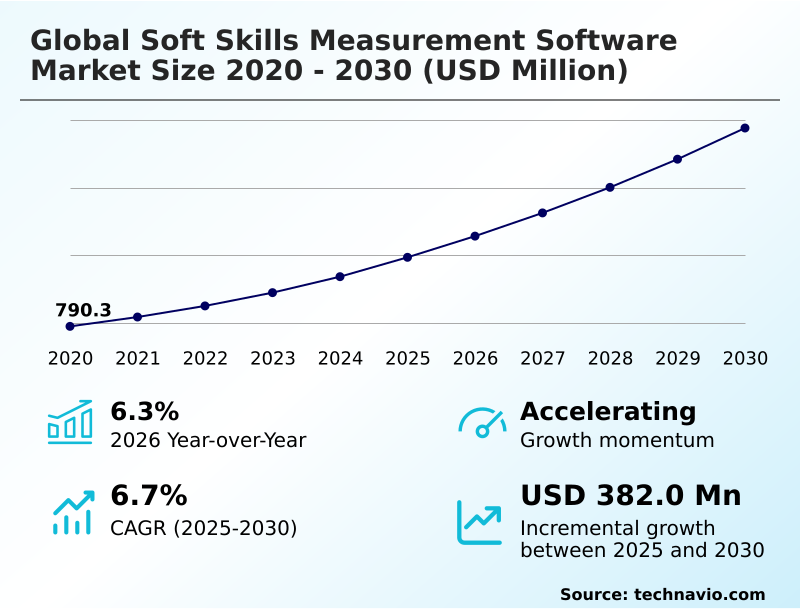
The Soft Skills Measurement Software Market size was valued at USD 994.3 million in 2025 growing at a CAGR of 6.7% during the forecast period 2026-2030.
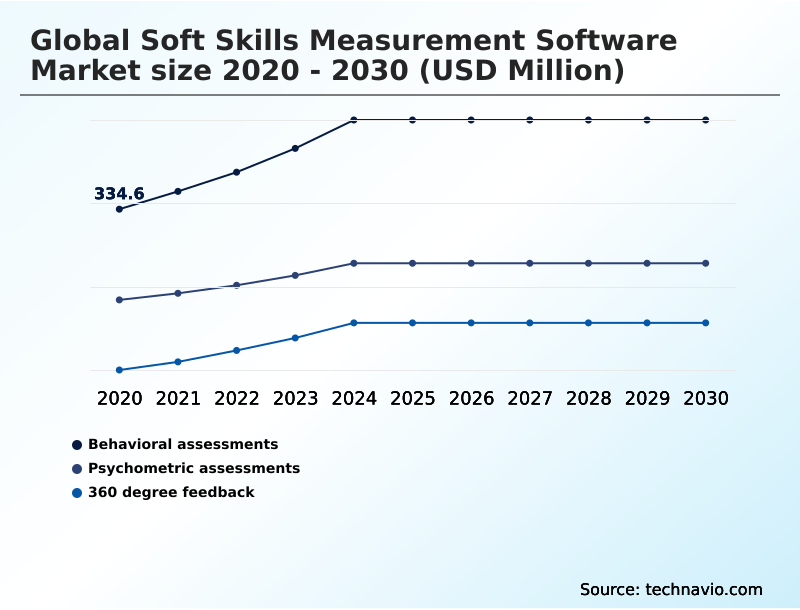
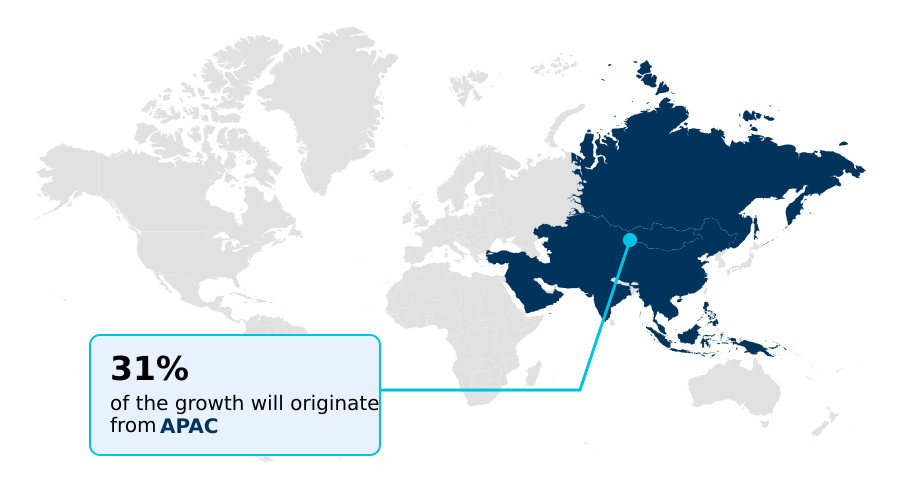
APAC accounts for 30.8% of incremental growth during the forecast period. The Behavioral assessments segment by Type was valued at USD 410.3 million in 2024, while the Corporate enterprises segment holds the largest revenue share by End-user.
The market is projected to grow by USD 586 million from 2020 to 2030, with USD 382 million of the growth expected during the forecast period of 2025 to 2030.
Get Key Insights on Market Forecast (PDF) Request Free Sample
Soft Skills Measurement Software Market Overview
The soft skills measurement software market is defined by a strategic transition toward data-centric human capital evaluation, where qualitative traits are transformed into objective metrics. Organizations are leveraging these platforms for workforce planning optimization, moving beyond traditional hiring criteria to build resilient teams. This is particularly evident in APAC, which shows the highest growth potential, contributing over 30% of the market's incremental growth. A key driver is the integration of AI-powered video interviewing and affective computing to provide a more nuanced analysis of human behavior, supporting diversity equity and inclusion (DEI) metrics. For instance, a multinational financial services firm implementing a new talent intelligence platform can use predictive hiring analytics to ensure equitable evaluation for leadership roles across its global offices. This approach, compliant with frameworks like the EEOC's guidelines on AI in hiring, allows for leadership potential analysis and the identification of high-potential employees by focusing on measurable competencies rather than subjective impressions, ultimately enhancing workforce upskilling and reskilling efforts.
Drivers, Trends, and Challenges in the Soft Skills Measurement Software Market
The trajectory of the soft skills measurement software market is increasingly tied to demonstrating a clear return on investment of soft skills training programs and ensuring compliance with evolving regulations like the GDPR. As organizations integrate these tools, measuring collaboration skills in project teams and using NLP to analyze communication skills have become standard practices.
For instance, a financial services company in the European Union uses behavioral assessment for sales roles to not only identify top performers but also to document fair and non-discriminatory hiring practices, a critical component of regulatory adherence. This process involves integrating soft skills data into HCM platforms to create a unified view of employee development.
The rise of skills-first hiring is pushing vendors toward validating soft skill credentials with blockchain, offering a portable and verifiable record of an individual's competencies. This is particularly relevant in higher education, where there is a growing focus on soft skills assessment in higher education to improve graduate employability.
The use of gamification in corporate skill assessment is also on the rise, with market growth in APAC outpacing North America, reflecting a broader global shift toward more engaging and effective talent management strategies that prioritize measuring adaptability and resilience in employees.
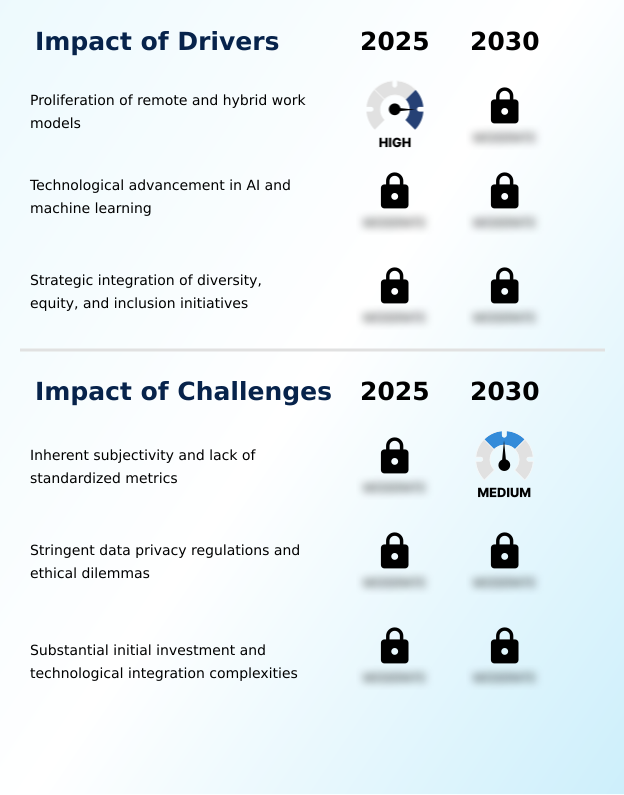
Primary Growth Driver: The proliferation of remote and hybrid work models is a primary driver, creating a critical need for objective, data-driven tools to quantify interpersonal skills in decentralized teams.
The adoption of soft skills measurement software is largely driven by the operational necessities of the modern workplace.
The proliferation of remote and hybrid work models has made it difficult to evaluate employee performance through direct observation, creating a need for objective, data-driven tools that can quantify abilities like communication and resilience.
A second major driver is the integration of AI and machine learning, including natural language processing and affective computing, which provide more nuanced and accurate behavioral analytics than traditional methods. These technologies automate assessments and reduce administrative burdens.
Finally, a strong corporate emphasis on diversity, equity, and inclusion initiatives, particularly in North America and Europe, fuels demand for platforms capable of unconscious bias mitigation in hiring and promotion processes, ensuring fair evaluation based on measurable skills.
Emerging Market Trend: The market is advancing with the emergence of gamification and immersive behavioral simulations, moving beyond traditional static questionnaires. This trend creates interactive environments that capture authentic behavioral data in real time.
The market is advancing through the adoption of gamified assessments and immersive simulations that provide a more authentic measure of an individual's abilities than static questionnaires. This trend leverages virtual reality (VR) training and augmented reality (AR) assessment to place users in realistic workplace scenarios, capturing objective data on their responses to stress and interpersonal challenges.
A significant development is the integration of these tools into the employee development lifecycle, supporting continuous performance management. This approach allows for ongoing feedback and personalized learning.
Furthermore, the rise of digital credentialing systems and portable certifications is creating a standardized framework for validating interpersonal competencies, a critical step as organizations globally adopt skills-first hiring strategies and focus on leadership development programs.
Key Industry Challenge: The market's growth is constrained by the inherent subjectivity and lack of standardized metrics in assessing human behavior, which complicates the development of universally applicable and credible tools.
A primary challenge constraining the market is the inherent subjectivity in assessing human behavior and the lack of a universal, standardized metric for soft skills like creativity or leadership. This complicates the development of tools that are credible across different cultures and industries.
A second significant hurdle involves data privacy and ethics, especially with the use of AI to analyze sensitive personal data, requiring strict compliance with regulations like the GDPR in Europe. Organizations that fail to navigate these rules risk substantial fines and a loss of employee trust.
Finally, the substantial initial investment and technological complexity of implementing these systems, including the need for applicant tracking system (ATS) integration, can be a major barrier, particularly for small and medium-sized enterprises.
Explore Full Market Dynamics Analysis Request Free Sample
Soft Skills Measurement Software Market Segmentation
The soft skills measurement software industry research report provides comprehensive data including region-wise segment analysis, with forecasts and analysis for the period 2026-2030, as well as historical data from 2020-2024 for the following segments.
Type Segment Analysis
The behavioral assessments segment is estimated to witness significant growth during the forecast period.
Behavioral assessments, which constituted a significant portion of the market in 2025, are shifting from static questionnaires to dynamic, immersive simulations.
These platforms utilize behavioral science to capture objective data on how individuals navigate complex, real-time scenarios, measuring traits like empathy and resilience. By embedding a competency mapping framework within a gamified interface, organizations can observe authentic behaviors.
This shift toward experiential measurement, often leveraging augmented reality (AR) assessment, ensures the evaluation process is engaging and provides a nuanced profile.
Such a behavioral competency model is critical for leadership development, as it identifies specific actions that correlate with successful management outcomes, moving beyond the limitations of traditional psychometric modeling.
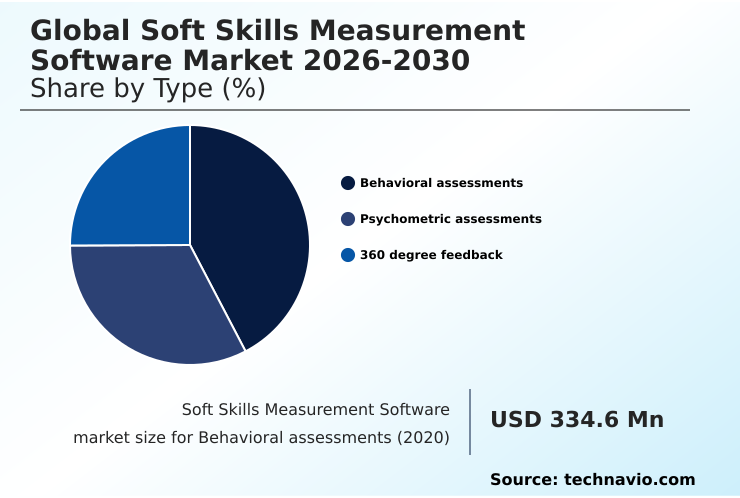
The Behavioral assessments segment was valued at USD 410.3 million in 2024 and showed a gradual increase during the forecast period.
Soft Skills Measurement Software Market by Region: APAC Leads with 30.8% Growth Share
APAC is estimated to contribute 30.8% to the growth of the global market during the forecast period.
The geographic landscape of the market is characterized by a contrast between mature and high-growth regions.
North America, contributing over 30% of the market, represents the most established market, driven by early adoption in the US and Canada for data-driven human capital decisions. Organizations here leverage these tools for candidate experience evaluation and succession planning tools.
Conversely, APAC is the fastest-growing region, with a CAGR of 8.2%, fueled by massive digital transformation in India and China.
Companies in this region are leapfrogging legacy HR methods, directly implementing mobile-first, cloud-based assessment tools that scale across large workforces and support employee retention strategies.
In Europe, adoption is strong but shaped by strict regulations like GDPR, emphasizing data privacy in any employee feedback mechanisms or leadership development programs.
Customer Landscape Analysis for the Soft Skills Measurement Software Market
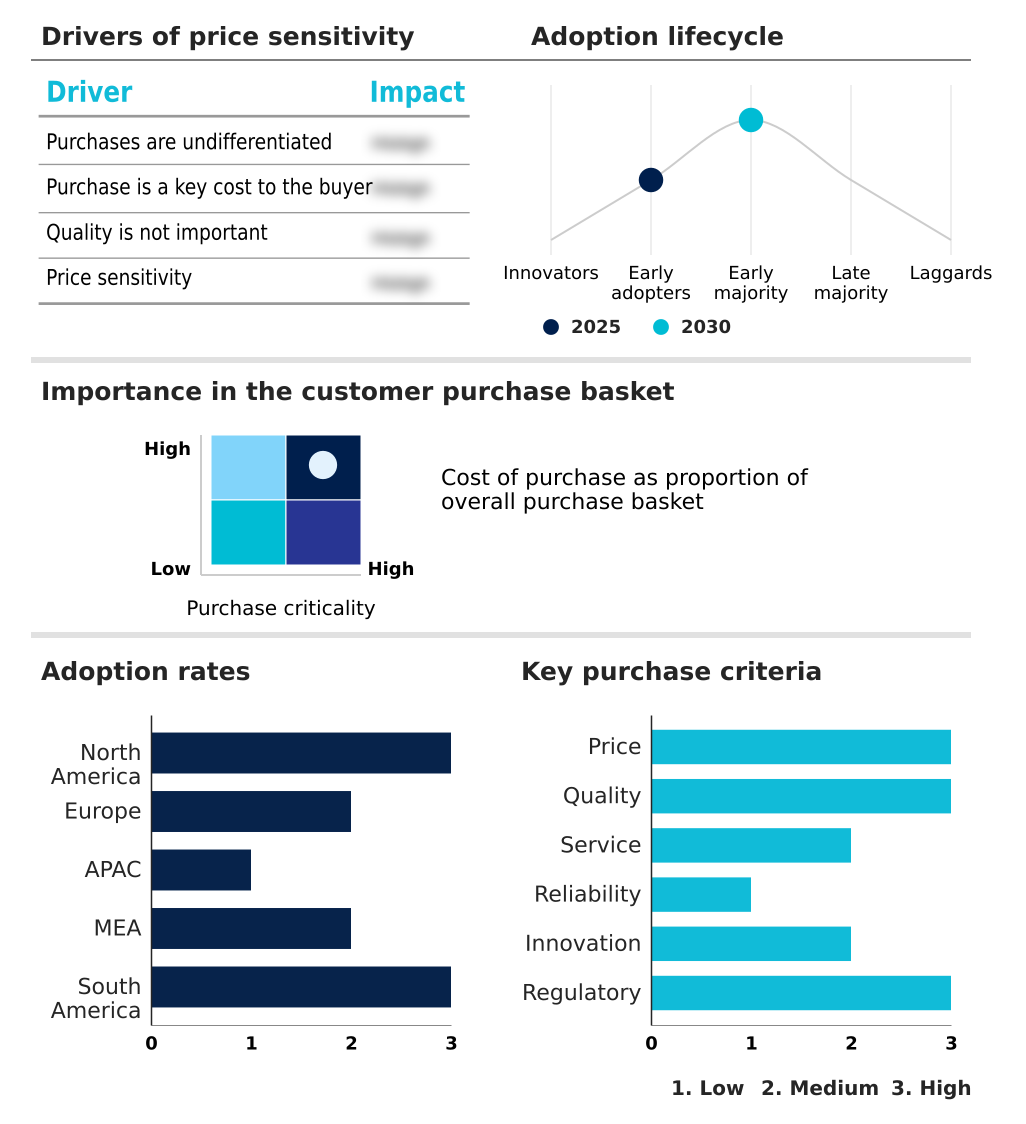
The soft skills measurement software market forecasting report includes the adoption lifecycle of the market, covering from the innovator’s stage to the laggard’s stage. It focuses on adoption rates in different regions based on penetration. Furthermore, the soft skills measurement software market report also includes key purchase criteria and drivers of price sensitivity to help companies evaluate and develop their market growth analysis strategies.
Competitive Landscape of the Soft Skills Measurement Software Market
Companies are implementing various strategies, such as strategic alliances, partnerships, mergers and acquisitions, geographical expansion, and product/service launches, to enhance their presence in the soft skills measurement software market industry.
Bodyswaps - AI-driven talent intelligence platforms are quantifying behavioral traits and predicting workplace performance to optimize recruitment and development.
The industry research and growth report includes detailed analyses of the competitive landscape of the market and information about key companies, including:
- Bodyswaps
- Cornerstone OnDemand Inc.
- Culture Amp Pty Ltd.
- Degreed Inc.
- Eightfold AI
- Harver B.V.
- HireVue Inc.
- Hogan Assessments
- Lepaya
- Mercer LLC
- Microsoft Corp.
- Paradox Inc
- Quantified Communications Inc.
- SAP SE
- SHL
- TestGorilla
- The Predictive Index
- Thomas International Ltd.
- Vervoe
- Workday Inc.
Qualitative and quantitative analysis of companies has been conducted to help clients understand the wider business environment as well as the strengths and weaknesses of key industry players. Data is qualitatively analyzed to categorize companies as pure play, category-focused, industry-focused, and diversified; it is quantitatively analyzed to categorize companies as dominant, leading, strong, tentative, and weak.
Recent Developments in the Soft Skills Measurement Software Market
- In May 2025, Udemy introduced its AI-Powered Role Play platform, a solution designed to let organizations and content creators efficiently deliver and customize interactive learning experiences for professional development in business and communication skills.
- In July 2025, PAR, a prominent provider of psychological assessment tools, announced the acquisition of Assessment Assist AI, a company specializing in AI solutions that support mental health professionals in their evaluation processes.
- In October 2025, Culture Amp, a global leader in employee engagement and performance management, announced the expansion of its science-based AI Coach across its entire platform to enhance employee development capabilities.
- In December 2025, IITM Pravartak Technologies Foundation partnered with the Union Education Ministry’s SWAYAM Plus initiative to launch an AI-enabled HR Analytics Programme, aimed at equipping learners with data-driven and AI-enhanced human resource skills.
Research Analyst Overview: Soft Skills Measurement Software Market
The market's evolution is marked by a definitive shift from subjective evaluation to data-driven talent management, compelling boardroom-level decisions on technology investment. Corporate enterprises, the dominant end-user segment, are adopting comprehensive talent management suites that integrate psychometric assessments and behavioral assessments.
A critical consideration for Chief Human Resources Officers is ensuring these platforms comply with data privacy regulations like the GDPR while delivering on the promise of unconscious bias mitigation. This has spurred the development of advanced psychometric modeling and behavioral analytics.
For example, deploying AI-powered video interviewing requires a rigorous validation process to satisfy both legal and ethical standards, directly impacting vendor qualification criteria. The focus is now on achieving a holistic view of talent through a competency mapping framework and continuous performance management, linking individual soft skills to organizational outcomes.
This strategic alignment is essential for justifying the total cost of ownership and maximizing the return on investment in workforce development.
Dive into Technavio’s robust research methodology, blending expert interviews, extensive data synthesis, and validated models for unparalleled Soft Skills Measurement Software Market insights. See full methodology.
| Market Scope | |
|---|---|
| Page number | 288 |
| Base year | 2025 |
| Historic period | 2020-2024 |
| Forecast period | 2026-2030 |
| Growth momentum & CAGR | Accelerate at a CAGR of 6.7% |
| Market growth 2026-2030 | USD 382.0 million |
| Market structure | Fragmented |
| YoY growth 2025-2026(%) | 6.3% |
| Key countries | US, Canada, Mexico, Germany, UK, France, Italy, The Netherlands, Spain, China, India, Japan, Australia, South Korea, Indonesia, Saudi Arabia, UAE, South Africa, Israel, Turkey, Brazil, Argentina and Colombia |
| Competitive landscape | Leading Companies, Market Positioning of Companies, Competitive Strategies, and Industry Risks |
Soft Skills Measurement Software Market: Key Questions Answered in This Report
-
What is the expected growth of the Soft Skills Measurement Software Market between 2026 and 2030?
-
The Soft Skills Measurement Software Market is expected to grow by USD 382 million during 2026-2030, registering a CAGR of 6.7%. Year-over-year growth in 2026 is estimated at 6.3%%. This acceleration is shaped by proliferation of remote and hybrid work models, which is intensifying demand across multiple end-use verticals covered in the report.
-
-
What segmentation does the market report cover?
-
The report is segmented by Type (Behavioral assessments, Psychometric assessments, and 360 degree feedback), End-user (Corporate enterprises, Educational institutions, and Government organizations), Deployment (Cloud, and On-premises) and Geography (North America, Europe, APAC, Middle East and Africa, South America). Among these, the Behavioral assessments segment is estimated to witness significant growth during the forecast period, driven by rising adoption across key application areas. Each segment includes detailed qualitative and quantitative analysis, along with historical data from 2020-2024 and forecasts through 2030 with year-over-year growth rates.
-
-
Which regions are analyzed in the report?
-
The report covers North America, Europe, APAC, Middle East and Africa and South America. APAC is estimated to contribute 30.8% to market growth during the forecast period. Country-level analysis includes US, Canada, Mexico, Germany, UK, France, Italy, The Netherlands, Spain, China, India, Japan, Australia, South Korea, Indonesia, Saudi Arabia, UAE, South Africa, Israel, Turkey, Brazil, Argentina and Colombia, with dedicated market size tables and year-over-year growth for each.
-
-
What are the key growth drivers and market challenges?
-
The primary driver is proliferation of remote and hybrid work models, which is accelerating investment and industry demand. The main challenge is inherent subjectivity and lack of standardized metrics, creating operational barriers for key market participants. The report quantifies the impact of each driver and challenge across 2026 and 2030 with comparative analysis.
-
-
Who are the major players in the Soft Skills Measurement Software Market?
-
Key vendors include Bodyswaps, Cornerstone OnDemand Inc., Culture Amp Pty Ltd., Degreed Inc., Eightfold AI, Harver B.V., HireVue Inc., Hogan Assessments, Lepaya, Mercer LLC, Microsoft Corp., Paradox Inc, Quantified Communications Inc., SAP SE, SHL, TestGorilla, The Predictive Index, Thomas International Ltd., Vervoe and Workday Inc.. The report provides qualitative and quantitative analysis categorizing companies as dominant, leading, strong, tentative, and weak based on their market positioning. Company profiles include business segment analysis, SWOT assessment, key offerings, and recent strategic developments.
-
Soft Skills Measurement Software Market Research Insights
Market dynamics are increasingly shaped by the need to balance detailed behavioral analytics with stringent data privacy mandates, such as the General Data Protection Regulation (GDPR). While corporate enterprises remain the largest end-user segment, the demand for unconscious bias mitigation tools is growing across all sectors. This has led to the adoption of predictive role-fit analysis and other advanced methods.
Procurement decisions now frequently hinge on a platform's ability to seamlessly perform applicant tracking system (ATS) integration while adhering to strict data governance protocols. The organizational culture assessment capabilities of these tools are also becoming a key differentiator, as companies seek to build more cohesive and engaged workforces. This focus on ethical and effective talent evaluation underscores the market's maturation.
We can help! Our analysts can customize this soft skills measurement software market research report to meet your requirements.
 RIA -
RIA - 
