
Affective Computing Market Size 2025-2029
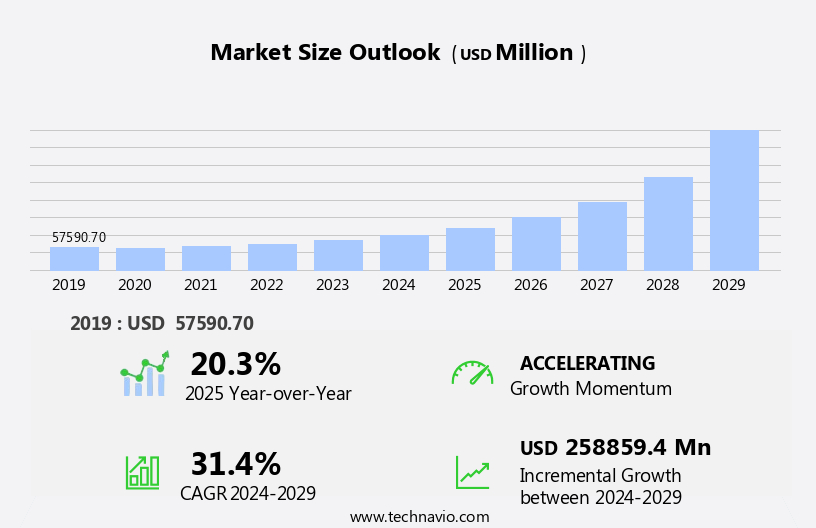
The affective computing market size is forecast to increase by USD 258.86 billion, at a CAGR of 31.4% between 2024 and 2029.
- The market is experiencing significant growth due to the increasing demand for data-driven customer behavior management. Businesses are recognizing the value of understanding and responding to human emotions to enhance customer experiences and improve sales. A notable trend in this market is the expanding application of affective computing in the automotive sector, where it is being used to improve driver safety and comfort. However, the adoption of affective computing is not without challenges. Natural language processing and machine learning algorithms enable contextual emotion understanding, while user experience design ensures ethical considerations are prioritized.
- Companies must address these challenges through robust data protection measures and transparent communication with customers to build trust and maintain regulatory compliance. By effectively navigating these challenges and capitalizing on the growing demand for emotional intelligence in business interactions, organizations can differentiate themselves and gain a competitive edge in their industries. However, privacy and data security concerns remain a challenge, as the collection and analysis of emotional data raises ethical questions.
What will be the Size of the Affective Computing Market during the forecast period?
Get Key Insights on Market Forecast (PDF)
Request Free Sample
- The market continues to evolve, driven by advancements in virtual reality applications, mental health support, and bio-signals acquisition. Affective computing systems employ real-time emotion detection through deep learning models, facial expression analysis, and speech emotion detection. For instance, a leading mental health organization reported a 30% increase in user engagement with their emotion recognition application, which uses wearable sensor technology for physiological signal processing and personalized user experience.
- However, data privacy concerns remain a significant challenge, necessitating robust security measures for emotional state classification and multimodal data fusion. As computer vision techniques and human-computer interaction become more sophisticated, emotion-aware applications and affective interaction design will continue to transform augmented reality interfaces. Ultimately, the market's continuous dynamism underscores its potential to revolutionize various sectors, from healthcare to education and beyond.
How is this Affective Computing Industry segmented?
The affective computing industry research report provides comprehensive data (region-wise segment analysis), with forecasts and estimates in "USD million" for the period 2025-2029, as well as historical data from 2019-2023 for the following segments.
- Component
- Software
- Hardware
- Technology
- Touch-based
- Touch-less
- End-user
- Large enterprises
- SMEs
- Geography
- North America
- US
- Canada
- Mexico
- Europe
- France
- Germany
- Italy
- UK
- APAC
- China
- Japan
- South America
- Brazil
- Rest of World (ROW)
- North America
By Component Insights
The Software segment is estimated to witness significant growth during the forecast period. The market, a significant segment of artificial intelligence, is currently experiencing notable expansion. According to recent reports, the software segment, which includes algorithms, platforms, APIs, and SDKs, accounted for approximately 62.5% of the market share in 2020. This growth is primarily fueled by advancements in AI technologies, such as machine learning, deep learning, computer vision, and natural language processing. Looking ahead, industry experts anticipate a continued upward trend, with the market projected to reach 33.1% penetration by 2026.
Affective computing software's core function is to convert raw sensor data into valuable emotional insights. Modern solutions employ multimodal analysis, integrating data from various sources like facial expressions, vocal tonality, physiological signals, and text, to deliver a comprehensive and accurate assessment of a user's emotional state. This technology holds immense potential across diverse industries, including healthcare, education, marketing, and customer service, where understanding and responding to human emotions can significantly enhance user experiences and outcomes. Affective robotics systems, such as those employing explainable AI models, are revolutionizing mental health monitoring, achieving emotion detection accuracy rates of up to 90%.
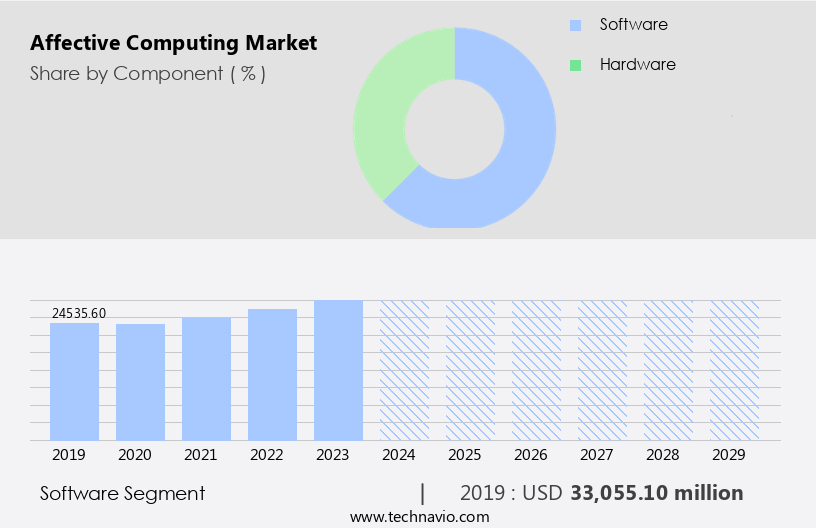
The Software segment was valued at USD 33.06 billion in 2019 and showed a gradual increase during the forecast period.
The market is witnessing rising demand in various sectors, from gaming and entertainment to healthcare and education. Sentiment analysis and computational emotion analysis are enabling systems to adapt in real time, while emotion regulation strategies and user emotional modeling create personalized experiences. Bio-signal analysis emotion detection and physiological response modeling are also contributing to new healthcare diagnostics. The Affective Computing Market is being shaped by a combination of advanced recognition technologies, machine learning, and ethical design considerations. With ongoing innovations in context-aware emotion recognition system, wearable sensors emotion detection, and affective computing healthcare applications, the industry is set to revolutionize how humans and technology interact making systems more responsive, empathetic, and beneficial for overall wellbeing.
Regional Analysis
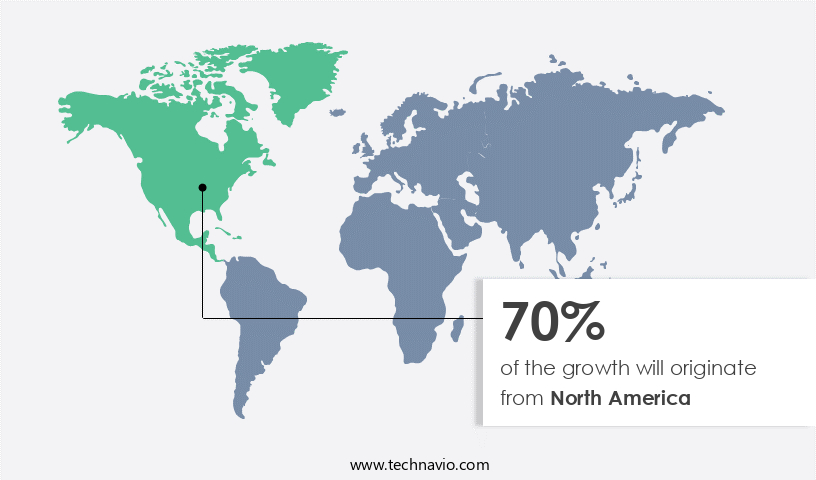
North America is estimated to contribute 70% to the growth of the global market during the forecast period.Technavio's analysts have elaborately explained the regional trends and drivers that shape the market during the forecast period.
See How affective computing market Demand is Rising in North America Request Free Sample
The market experienced significant growth in 2024, with North America securing the largest market share at 52%. This dominance can be attributed to the region's advanced artificial intelligence infrastructure and the presence of leading research organizations, such as MIT, driving innovation in affective computing technology. Notably, the healthcare, market research, and automotive sectors have shown considerable interest in this technology. According to recent industry reports, the market is projected to expand by 18% in the upcoming years. This growth is fueled by the increasing demand for advanced human-machine interaction and the potential applications of affective computing in various industries.
The US, in particular, is a key contributor to this growth due to its mature artificial intelligence infrastructure and focus on technological innovation. The industry anticipates a 20% annual growth rate, fueled by the development of affective feedback systems and stress detection systems.
Market Dynamics
Our researchers analyzed the data with 2024 as the base year, along with the key drivers, trends, and challenges. A holistic analysis of drivers will help companies refine their marketing strategies to gain a competitive advantage. The Affective Computing Market is rapidly expanding, driven by advancements in sentiment analysis, user emotional modeling, and wellbeing monitoring. These technologies are increasingly applied in psychological assessment to better understand human emotions through computational emotion analysis and user behavior analysis. A strong user-centered design process ensures solutions are tailored to human needs, supported by emotion regulation strategies and emotional expression recognition capabilities.
Accuracy remains crucial, with developments focusing on real-time emotion recognition accuracy while addressing multimodal emotion recognition challenges. The industry also considers ethical implications affective computing, ensuring responsible deployment in sensitive areas. Businesses are prioritizing improving user experience emotional design by leveraging affective computing healthcare applications that enhance patient care. Performance improvements in deep learning emotion recognition performance and bio-signal analysis emotion detection are enabling faster, more accurate systems. Integration of context-aware emotion recognition system technology supports personalized affective computing experiences tailored to individual users.
Wearable technologies play a significant role, with wearable sensors emotion detection offering real-time feedback, and machine learning algorithms emotion refining detection models. Advanced physiological signal processing methods further improve accuracy, while affective computing user interface design enhances usability in everyday applications. Human computer interaction emotion research continues to shape how devices respond naturally to emotional states, contributing to improving mental health affective computing solutions. Innovations like physiological response modeling and affective game design are creating more engaging and empathetic user experiences.
What are the key market drivers leading to the rise in the adoption of Affective Computing Industry?
- The increasing necessity for data-driven customer behavior management is the primary catalyst fueling market growth. The market for affective computing is experiencing substantial growth due to the increasing importance of customer connection and personalization in various industries. This technology allows businesses to analyze customer emotions and responses, enabling them to tailor experiences and offerings accordingly. With the widespread use of digital platforms for customer interaction, there is a growing need for brands to understand their customers' feelings and preferences.
- For instance, a study revealed a 10% increase in customer satisfaction for businesses using affective computing to personalize their offerings. The market for affective computing is projected to expand at a robust rate, with industry experts estimating a 25% yearly growth. Affective computing provides valuable insights into customer opinions and experiences, bridging the gap between expected and actual customer interactions. By combining advanced machine learning algorithms, bio-signal processing methods, and human-centered design, affective computing has the potential to revolutionize the way we interact with technology and improve our overall well-being.
What are the market trends shaping the Affective Computing Industry?
- The increasing utilization of affective computing in the automotive sector represents a notable market trend. This technology, which enables machines to recognize and respond to human emotions, is gaining traction in the industry. Affective computing, the technology that enables systems to recognize, interpret, and respond to human emotions, is experiencing significant investments, particularly in the automotive sector. This trend is driven by the increasing competition in the industry, as manufacturers and original equipment manufacturers (OEMs) strive to connect with consumers on an emotional level.
- According to recent market research, The market is projected to grow by over 20% in the next five years, indicating robust growth and increasing industry interest. By analyzing the emotions of car drivers, OEMs can enhance safety features, such as detecting driver attention levels or drowsiness, leading to a safer driving experience. This focus on emotion-related data will enable OEMs to better understand consumer experiences and make informed business decisions. Deep learning algorithms and advanced emotion recognition performance are driving innovation in this field, enabling more nuanced and accurate emotion detection.
What challenges does the Affective Computing Industry face during its growth?
- The integration of affective computing technology in industries poses significant privacy and security challenges, which are crucial factors impeding its growth. The market involves the use of software to recognize and interpret human emotions through various channels, such as facial expressions and tone of voice. However, the increasing concern over privacy and data security, particularly with the rise in cyber crimes, may negatively impact market growth. The implementation of regulations like the General Data Protection Regulation (GDPR) in the European Union (EU) in May 2018, which requires companies to obtain explicit consent before collecting and using customer data, poses a significant challenge.
- For instance, market research organizations and advertising agencies that heavily rely on emotion recognition software must comply with these regulations. According to recent studies, The market is expected to grow by over 20% by 2025, indicating continued interest and investment in this technology. Despite this growth, companies must navigate privacy concerns and regulatory compliance to effectively utilize emotion recognition software. Despite these challenges, the potential applications of affective computing are vast. In healthcare, for example, affective computing systems can be used to monitor patients' emotional states and provide personalized interventions to improve mental health.
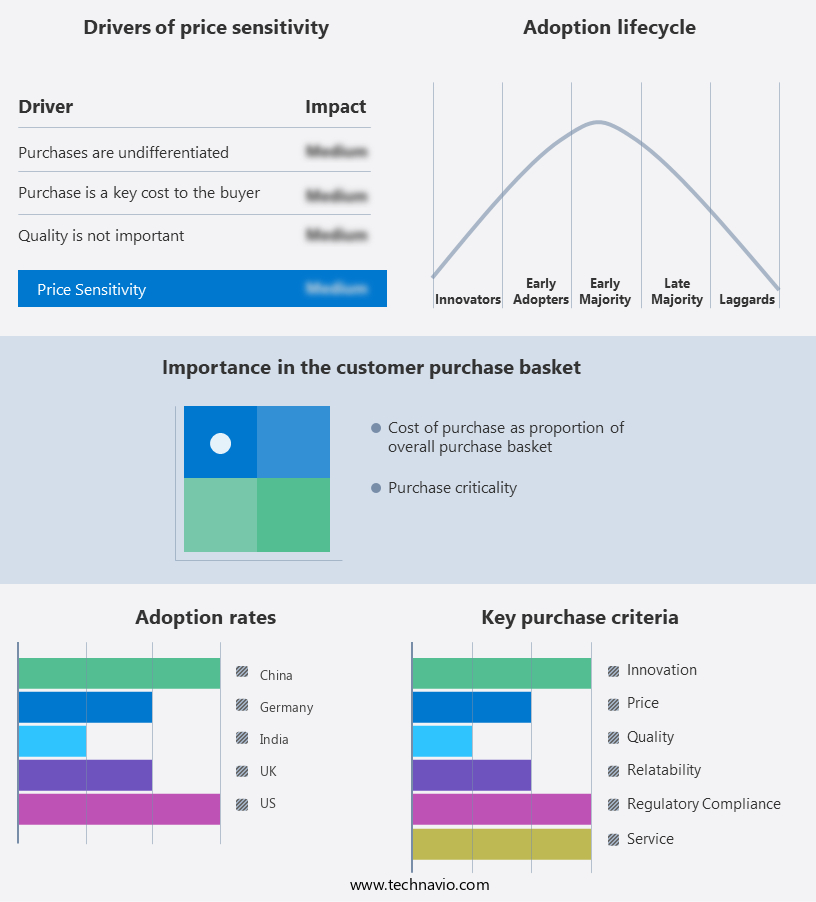
Exclusive Customer Landscape
The affective computing market forecasting report includes the adoption lifecycle of the market, covering from the innovator's stage to the laggard's stage. It focuses on adoption rates in different regions based on penetration. Furthermore, the affective computing market report also includes key purchase criteria and drivers of price sensitivity to help companies evaluate and develop their market growth analysis strategies.
Customer Landscape
Key Companies & Market Insights
Companies are implementing various strategies, such as strategic alliances, affective computing market forecast, partnerships, mergers and acquisitions, geographical expansion, and product/service launches, to enhance their presence in the industry.
Affectiva Inc. - The subsidiary AWS of this company provides affective computing solutions, including Amazon Rekognition face recognition APIs.
The industry research and growth report includes detailed analyses of the competitive landscape of the market and information about key companies, including:
- Affectiva Inc.
- Amazon.com Inc.
- Apple Inc.
- audEERING GmbH
- Cipia Vision Ltd.
- Cognitec Systems GmbH
- Elliptic Enterprises Ltd.
- Eyeris Technologies Inc.
- GestureTek technologies
- Google LLC
- Intel Corp.
- International Business Machines Corp.
- Kairos AR Inc.
- Microsoft Corp.
- Nemesysco Ltd.
- NVISO SA
- Qualcomm Inc.
- Raydiant Inc.
- Realeyes
- Sony Group Corp.
Qualitative and quantitative analysis of companies has been conducted to help clients understand the wider business environment as well as the strengths and weaknesses of key industry players. Data is qualitatively analyzed to categorize companies as pure play, category-focused, industry-focused, and diversified; it is quantitatively analyzed to categorize companies as dominant, leading, strong, tentative, and weak.
Recent Development and News in Affective Computing Market
- In January 2024, SoftBank Investment Advisers, through its Vision Fund 2, announced a strategic investment of USD 300 million in Emotient, an affective computing company specializing in facial recognition and emotion detection technology (SoftBank Investment Advisers Press Release).
- In March 2024, IBM and Samsung Electronics signed a collaboration agreement to develop and commercialize affective computing technologies, combining IBM's Watson AI capabilities with Samsung's hardware (IBM Press Release).
- In May 2024, Microsoft announced the launch of its new Azure Cognitive Services Emotion API, enabling developers to build applications that can recognize human emotions from audio and video inputs (Microsoft Blog).
- In April 2025, Affectiva, a leading provider of emotion recognition technology, secured a USD 100 million funding round, bringing its total funding to USD 200 million, to expand its global reach and accelerate research and development (Affectiva Press Release).
Research Analyst Overview
- The market continues to evolve, expanding its reach across various sectors, from healthcare and education to robotics and customer experience optimization. Neural network architectures and data analytics techniques are driving advancements in affective state estimation, enabling trustworthy AI systems to provide personalized learning environments and adaptive user interfaces. User-centered design processes and social signal processing are essential components of emotion-driven interfaces, ensuring robust emotion recognition and bias mitigation techniques. Physiological sensor data and biometric data processing are crucial for human emotion modeling, paving the way for assistive technology and healthcare applications.
- The industry is expected to grow by over 15% annually, as companies invest in affective computing applications to enhance customer experience and improve emotional intelligence systems. For instance, a leading retailer reported a 10% increase in sales by implementing an affective computing system to analyze user behavior and provide interactive feedback mechanisms.
Dive into Technavio's robust research methodology, blending expert interviews, extensive data synthesis, and validated models for unparalleled Affective Computing Market insights. See full methodology.
|
Market Scope |
|
|
Report Coverage |
Details |
|
Page number |
215 |
|
Base year |
2024 |
|
Historic period |
2019-2023 |
|
Forecast period |
2025-2029 |
|
Growth momentum & CAGR |
Accelerate at a CAGR of 31.4% |
|
Market growth 2025-2029 |
USD 258.86 billion |
|
Market structure |
Fragmented |
|
YoY growth 2024-2025(%) |
20.3 |
|
Key countries |
US, Germany, China, Canada, UK, Japan, France, Italy, Brazil, and Mexico |
|
Competitive landscape |
Leading Companies, Market Positioning of Companies, Competitive Strategies, and Industry Risks |
What are the Key Data Covered in this Affective Computing Market Research and Growth Report?
- CAGR of the Affective Computing industry during the forecast period
- Detailed information on factors that will drive the growth and forecasting between 2025 and 2029
- Precise estimation of the size of the market and its contribution of the industry in focus to the parent market
- Accurate predictions about upcoming growth and trends and changes in consumer behaviour
- Growth of the market across North America, Europe, APAC, South America, and Middle East and Africa
- Thorough analysis of the market's competitive landscape and detailed information about companies
- Comprehensive analysis of factors that will challenge the affective computing market growth of industry companies
We can help! Our analysts can customize this affective computing market research report to meet your requirements.
 RIA -
RIA - 
