Solar Home Systems Market Analysis, Size, and Forecast 2025-2029: Middle East and Africa (Egypt, South Africa, UAE), APAC (China, India, Japan, South Korea), South America , North America (US), and Europe

Solar Home Systems Market Analysis, Size, and Forecast 2025-2029:
Middle East and Africa (Egypt, South Africa, UAE), APAC (China, India, Japan, South Korea), South America , North America (US), and Europe

Published: Mar 2025 217 Pages SKU: IRTNTR73753

Market Overview at a Glance

$4.29 B
Market Opportunity
24.5%
CAGR
21.0
YoY growth 2024-2025(%)

Solar Home Systems Market Size 2025-2029

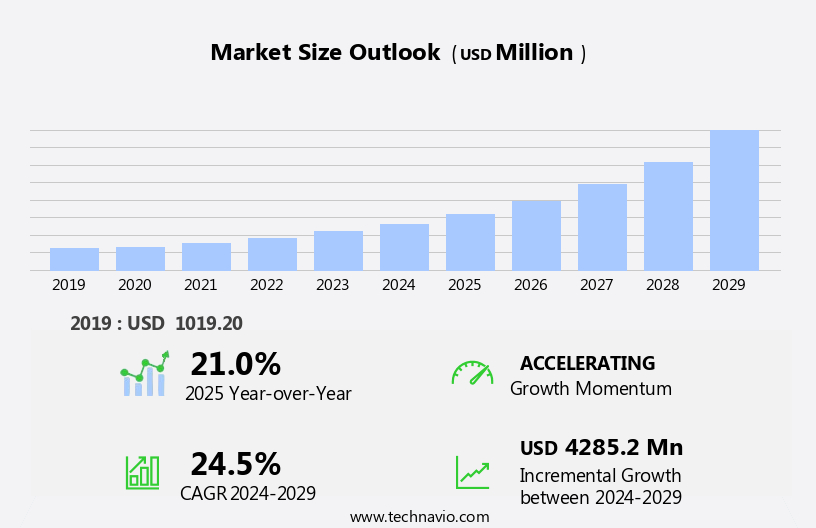
The solar home systems market size is forecast to increase by USD 4.29 billion, at a CAGR of 24.5% between 2024 and 2029.

  • The market exhibits robust growth, driven by the increasing availability of favorable financing options for consumers. This financing accessibility enables more households to invest in solar systems, expanding the market's reach and customer base. Another significant driver is the growing support from non-governmental organizations (NGOs), which are actively promoting the adoption of solar home systems in developing countries. However, the market faces challenges from alternative sources of energy, such as biomass and grid-connected power. These competitors put pressure on solar home system providers to offer competitive pricing and superior value propositions to maintain market share.
  • Companies in this market must navigate these challenges by continuously innovating, improving efficiency, and collaborating with NGOs and financial institutions to expand their customer base and strengthen their market position.

What will be the Size of the Solar Home Systems Market during the forecast period?

Solar Home Systems Market Size

Explore in-depth regional segment analysis with market size data - historical 2019-2023 and forecasts 2025-2029 - in the full report.  
Request Free Sample

The market continues to evolve, driven by advancements in technology and increasing demand for clean, sustainable energy solutions. Solar home systems encompass a range of applications, from stand-alone systems for remote locations to on-grid systems for residential and commercial use. These systems integrate various components, including solar panels, mounting systems, charge controllers, power optimizers, wiring harnesses, and energy management systems. Applications of solar home systems extend beyond electricity generation for home appliances. They also provide emergency power during grid outages, contribute to grid stability, and offer energy consumption monitoring. Solar water heaters and hybrid systems further expand the market's reach.

Off-grid systems, particularly in rural areas, play a crucial role in rural electrification. Market dynamics are influenced by factors such as solar irradiance, capacity factor, peak sun hours, and system efficiency. The integration of smart meters and energy yield monitoring enhances the overall performance and cost-effectiveness of these systems. Lithium-ion batteries and dc-ac converters facilitate energy storage and ensure consistent power supply. The ongoing development of solar regulators, power optimizers, and other components continues to improve system performance and reduce maintenance costs. The integration of led lighting and demand-side management further enhances energy efficiency and carbon footprint reduction. The payback period for solar home systems is becoming increasingly attractive, making them a viable and cost-effective alternative to traditional energy sources.

The market is characterized by continuous innovation and growth, driven by the increasing importance of clean, sustainable energy solutions. This dynamism is reflected in the integration of various components, such as solar panels, wiring harnesses, charge controllers, and energy management systems, into complete solar home systems. The market's evolution is shaped by factors such as solar irradiance, capacity factor, and peak sun hours, as well as advancements in technology and changing consumer demands.

How is this Solar Home Systems Industry segmented?

The solar home systems industry research report provides comprehensive data (region-wise segment analysis), with forecasts and estimates in "USD million" for the period 2025-2029, as well as historical data from 2019-2023 for the following segments.

  • Type
    • PAYG products
    • Cash products
  • Distribution Channel
    • Offline
    • Online
  • Product Type
    • Off-grid
    • On-grid
  • Geography
    • North America
      • US
    • Middle East and Africa
      • Egypt
      • South Africa
      • UAE
    • APAC
      • China
      • India
      • Japan
      • South Korea
    • Rest of World (ROW)

    By Type Insights

    The payg products segment is estimated to witness significant growth during the forecast period.

    The market is experiencing significant growth, driven by the adoption of innovative Pay-As-You-Go (PAYG) models. These systems, popular in underserved regions, eliminate the need for upfront payments, enabling customers to purchase solar solutions through manageable installments. Solar panels and lithium-ion batteries are installed at homes, while payments are made on a daily, weekly, or monthly basis. Mobile money services and other convenient payment methods facilitate transactions. PAYG systems utilize remote monitoring technology to track payment status and usage, allowing providers to deactivate systems if necessary. Solar pumps, electricity generation, and grid connection are integral components, with demand-side management and energy management systems optimizing power consumption.

    Capacity factor, carbon footprint reduction, and community solar projects contribute to the market's sustainability. Solar panels, solar irradiance, and dc-ac converters ensure efficient energy conversion. Maintenance costs, home appliances, and energy consumption monitoring are essential considerations. Off-grid and on-grid systems cater to various energy needs, with smart meters and emergency power ensuring grid stability. Peak sun hours, hybrid systems, wiring harnesses, charge controllers, power optimizers, and payback period are other essential factors. Solar water heaters and energy yield further expand the market's scope. Rural electrification and ground-mounted installations are key areas of expansion. Sustainable energy and lead-acid batteries are alternative solutions.

    Installation costs and energy audits influence market trends. String inverters and solar farms are key technologies driving innovation.

    Solar Home Systems Market Size

    Request Free Sample

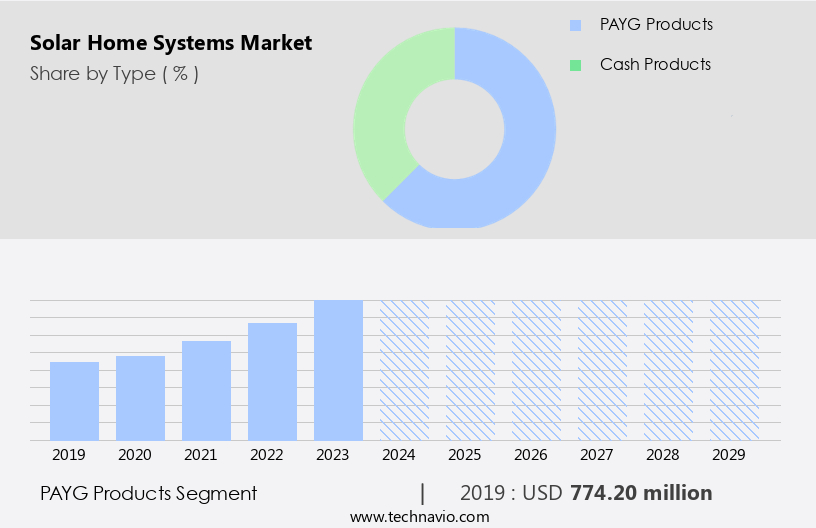
    The PAYG products segment was valued at USD 774.20 billion in 2019 and showed a gradual increase during the forecast period.

    Regional Analysis

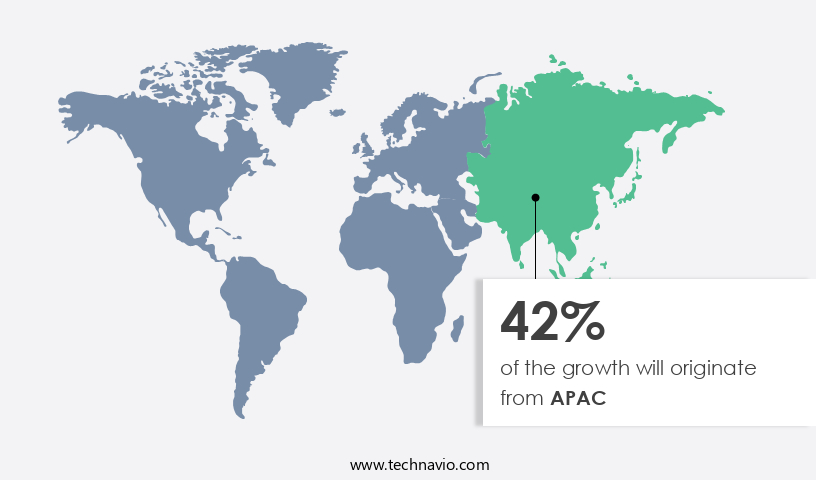
    APAC is estimated to contribute 42% to the growth of the global market during the forecast period.Technavio’s analysts have elaborately explained the regional trends and drivers that shape the market during the forecast period.

    Solar Home Systems Market Share by Geography

     Request Free Sample

    Off-grid solar power is a swift and economical solution to expand energy access worldwide, enhancing living standards. Solar home systems, a key component, have gained widespread acceptance. For instance, Malawi aims to reach a 30% grid access rate by 2030, necessitating off-grid energy solutions to bridge the 70% access gap. Governments and private firms are spearheading numerous initiatives in various countries. The surge in solar home system adoption is fueled by the growing number of commercial enterprises providing these systems, meeting customers' electricity and lighting demands. Lithium-ion batteries, solar panels, and charge controllers are integral components of these systems.

    Solar pumps and water heaters expand their applications. Grid connection, demand-side management, and smart meters ensure system efficiency. Capacity factor, peak sun hours, and energy yield optimize power generation. Solar irradiance and maintenance costs influence system performance. Hybrid systems, wiring harnesses, and power optimizers enhance system reliability. Carbon footprint reduction, energy consumption monitoring, and emergency power are added benefits. Solar farms and rural electrification expand the market scope. Energy audits and installation costs guide customer decision-making. String inverters and mounting systems ensure system stability and ease of installation. In conclusion, the off-grid the market is dynamic, driven by the need for clean, reliable, and affordable energy solutions.

    Market Dynamics

    Our researchers analyzed the data with 2024 as the base year, along with the key drivers, trends, and challenges. A holistic analysis of drivers will help companies refine their marketing strategies to gain a competitive advantage.

    The market continues to gain momentum as homeowners seek sustainable and cost-effective energy solutions. Solar photovoltaic (PV) systems, solar thermal systems, and energy storage solutions are at the forefront of this burgeoning industry. Renewable energy incentives, government subsidies, and advancements in technology are driving demand. Solar PV systems convert sunlight into electricity, while solar thermal systems harness solar energy for water heating and space heating. Energy storage systems, such as batteries, ensure a consistent power supply. Solar panels, inverters, mounting systems, and charge controllers are essential components. Installation, maintenance, and financing options are also crucial considerations. The market offers numerous benefits, including energy independence, reduced utility bills, and a smaller carbon footprint.

    What are the key market drivers leading to the rise in the adoption of Solar Home Systems Industry?

    • The market's growth is significantly influenced by the accessibility of advantageous financing opportunities. 

    • Solar home systems with fee-for-service or Pay-As-You-Go (PAYG) models have been gaining traction in various markets, particularly in regions such as Africa and Asia. Off-grid energy companies or distributed energy service providers offer these PAYG solar home systems, which include solar lighting systems and appliances like TVs, refrigerators, and solar-based power supply mechanisms. Customers pay for these products in installments or for the use of the service. The integration of information technology in these systems enables companies to minimize transaction costs, remotely activate services, and automate payments. The capacity factor and system efficiency of solar panels are crucial factors in the performance of solar home systems.
    • Solar irradiance significantly impacts the power generation capacity. DC-AC converters convert the solar energy into usable electricity for home appliances. Maintenance costs are a concern for consumers, and system efficiency and power consumption are essential considerations. Power outages can be mitigated by on-grid solar systems, which can store excess energy generated during peak sunlight hours for use during power outages. Community solar projects enable multiple households to share the benefits of solar energy generation, reducing carbon footprint and promoting sustainability. In conclusion, the market is driven by factors such as the need for clean energy, reducing carbon footprint, and the increasing affordability of solar technology.
    • The integration of information technology and the adoption of PAYG models have made solar home systems more accessible and cost-effective for consumers.

    What are the market trends shaping the Solar Home Systems Industry?

    • NGOs' rising support is an emerging market trend. This growing endorsement from non-governmental organizations signifies a significant shift in consumer preferences towards socially responsible businesses.

    • Solar home systems are gaining significant traction in African and Asian countries, driven by the efforts of various NGOs. These organizations play a pivotal role in promoting solar energy adoption by developing economies, supporting clean energy technologies, and providing access to reliable power supplies. NGOs collect and disseminate solar opportunities' information, offer training to SMEs and technicians, and bridge gaps between communities, businesses, and international financing institutions. One such region with renewed focus on solar power initiatives is Tanzania. NGOs are actively involved in implementing solar projects in this country. Solar home systems offer stand-alone power solutions, making them an attractive option for off-grid communities.
    • These systems can be integrated with smart meters for energy yield monitoring, energy consumption tracking, and emergency power backup. Solar water heaters are another popular application, providing hot water while reducing energy consumption. Hybrid solar systems, combining solar panels with battery storage and grid connection, offer the benefits of both renewable energy and grid stability. Wiring harnesses and charge controllers ensure efficient power transfer and system safety. Peak sun hours maximize energy generation, making solar home systems a cost-effective and sustainable energy solution.

    What challenges does the Solar Home Systems Industry face during its growth?

    • The expansion of the renewable energy sector poses a significant challenge to the growth of the traditional energy industry, requiring continuous adaptation and innovation to remain competitive. 

    • Renewable energy sources, including solar home systems, have gained significant traction in the global electricity market, although fossil fuels continue to dominate. According to the International Energy Agency (IEA), fossil fuels accounted for 64% of the global electricity mix in 2024, while renewable energy sources accounted for only 26%. Solar power, in particular, faces competition from other renewable energy sources, such as wind and hydropower. Despite this competition, solar home systems offer several advantages. For instance, they can be installed in various settings, including rural areas for electrification and ground-mounted installations. Solar power systems also use power optimizers to maximize energy production and string inverters to convert direct current (DC) power from solar panels to alternating current (AC) for use in homes and businesses.
    • Lead-acid batteries are commonly used to store excess solar energy for use during peak demand or when the sun is not available. The cost of installation for solar home systems has decreased significantly in recent years, making them more affordable for consumers. Energy audits are also important to determine the energy needs of a building and the size of the solar system required. Solar farms, large-scale solar installations, have also gained popularity in recent years as a sustainable energy solution. The payback period for solar home systems, which is the time it takes for the savings from the system to equal the initial investment, has decreased significantly, making solar power an increasingly attractive option for businesses and homeowners.

    Exclusive Customer Landscape

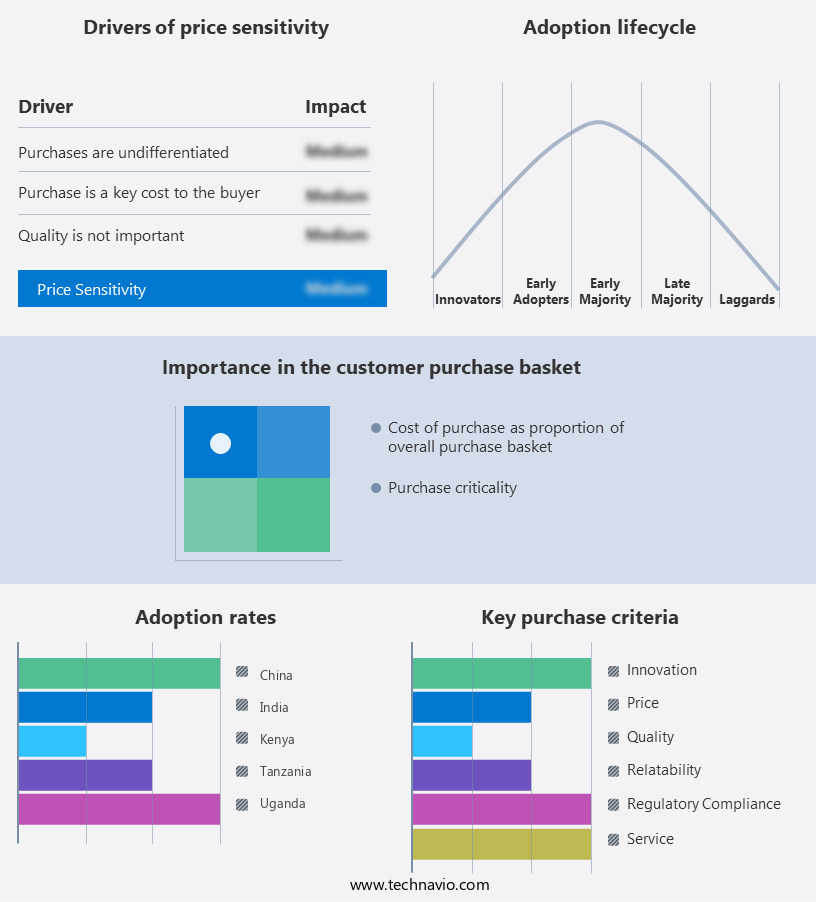
    The solar home systems market forecasting report includes the adoption lifecycle of the market, covering from the innovator’s stage to the laggard’s stage. It focuses on adoption rates in different regions based on penetration. Furthermore, the solar home systems market report also includes key purchase criteria and drivers of price sensitivity to help companies evaluate and develop their market growth analysis strategies.

    Solar Home Systems Market Share by Geography

     Customer Landscape

    Key Companies & Market Insights

    Companies are implementing various strategies, such as strategic alliances, solar home systems market forecast, partnerships, mergers and acquisitions, geographical expansion, and product/service launches, to enhance their presence in the industry.

    ABB Ltd. - This company specializes in solar home solutions, integrating string inverters, low-voltage technologies, and energy storage systems for optimal energy management and sustainability. Our offerings prioritize originality to enhance search engine visibility and deliver clear, informative insights from a research analyst's perspective.

    The industry research and growth report includes detailed analyses of the competitive landscape of the market and information about key companies, including:

    • ABB Ltd.
    • Array Technologies Inc.
    • Canadian Solar Inc.
    • Enphase Energy Inc.
    • Greenlight Planet
    • JinkoSolar Holding Co. Ltd.
    • LG Corp.
    • Lumos Global BV
    • Panasonic Holdings Corp.
    • Phocos AG
    • REC Solar Holdings AS
    • Schneider Electric SE
    • Shell plc
    • SMA Solar Technology AG
    • SolarEdge Technologies Inc.
    • SunPower Corp.
    • Tata Power Co. Ltd.
    • Tesla Inc.
    • Trina Solar Co. Ltd.
    • Yingli Solar

    Qualitative and quantitative analysis of companies has been conducted to help clients understand the wider business environment as well as the strengths and weaknesses of key industry players. Data is qualitatively analyzed to categorize companies as pure play, category-focused, industry-focused, and diversified; it is quantitatively analyzed to categorize companies as dominant, leading, strong, tentative, and weak.

    Recent Development and News in Solar Home Systems Market

    • In January 2024, SunPower Corporation, a leading solar technology company, announced the launch of its Maxeon 4 Series solar panels, boasting record-breaking efficiency levels and a 25-year power production guarantee (SunPower Press Release, 2024). This innovation underscores SunPower's commitment to delivering high-performance solar solutions.
    • In March 2024, Tesla, the electric vehicle and clean energy company, entered into a strategic partnership with SolarCity, a leading solar panel installer, to offer integrated solar, storage, and energy services under one roof (Tesla Investor Relations, 2024). This collaboration aims to streamline the customer experience and promote the adoption of renewable energy solutions.
    • In May 2024, Trina Solar, a leading global solar panel manufacturer, secured a strategic investment of USD500 million from a consortium led by the Abu Dhabi National Oil Company (ADNOC) (Trina Solar Press Release, 2024). This funding will support Trina Solar's expansion into new markets and the development of advanced solar technologies.
    • In February 2025, India's Ministry of New and Renewable Energy launched the National Solar Mission 4.0, aiming to install 120 GW of solar capacity by 2030 (Ministry of New and Renewable Energy, 2025). This initiative signifies a significant commitment to solar energy and represents a major growth opportunity for solar home system providers.

    Research Analyst Overview

    • The decentralized energy market, driven by consumer preferences for renewable and sustainable power sources, is experiencing significant growth. Solar tracking systems are becoming increasingly popular for maximizing energy efficiency improvements. Investment strategies and financial models are evolving to accommodate the unique needs of this sector. Supply chain optimization and material sourcing are critical for ensuring quality control and regulatory compliance. Education and training programs are essential for fostering consumer adoption of solar home systems. Renewable energy integration and power electronics are key areas of focus for utility companies. Feed-in tariffs and government subsidies continue to influence market dynamics, while net metering policies facilitate the transition to distributed generation.
    • Environmental regulations and climate change mitigation efforts are driving demand for safe and reliable solar home systems. Safety standards and product lifecycle management are crucial for maintaining consumer trust and economic development. Cost reduction through technology advancements and economies of scale are key trends shaping the market. Community engagement and waste management are emerging concerns for industry players. Policy changes and regulatory compliance are ongoing challenges for market participants, requiring a proactive approach to remain competitive. Distributed generation and economic development are interconnected, with solar home systems playing a pivotal role in reducing reliance on traditional energy sources.

    Dive into Technavio’s robust research methodology, blending expert interviews, extensive data synthesis, and validated models for unparalleled Solar Home Systems Market insights. See full methodology.

    Market Scope

    Report Coverage

    Details

    Page number

    217

    Base year

    2024

    Historic period

    2019-2023

    Forecast period

    2025-2029

    Growth momentum & CAGR

    Accelerate at a CAGR of 24.5%

    Market growth 2025-2029

    USD 4285.2 million

    Market structure

    Fragmented

    YoY growth 2024-2025(%)

    21.0

    Key countries

    UAE, Saudi Arabia, US, Egypt, South Africa, China, Nigeria, South Korea, India, and Japan

    Competitive landscape

    Leading Companies, Market Positioning of Companies, Competitive Strategies, and Industry Risks

    Request Free Sample

    What are the Key Data Covered in this Solar Home Systems Market Research and Growth Report?

    • CAGR of the Solar Home Systems industry during the forecast period
    • Detailed information on factors that will drive the growth and forecasting between 2025 and 2029
    • Precise estimation of the size of the market and its contribution of the industry in focus to the parent market
    • Accurate predictions about upcoming growth and trends and changes in consumer behaviour
    • Growth of the market across Middle East and Africa, APAC, South America, North America, and Europe
    • Thorough analysis of the market’s competitive landscape and detailed information about companies
    • Comprehensive analysis of factors that will challenge the solar home systems market growth of industry companies

    We can help! Our analysts can customize this solar home systems market research report to meet your requirements.

    Get in touch


    1 Executive Summary

    • 1.1 Market overview
      • Executive Summary - Chart on Market Overview
      • Executive Summary - Data Table on Market Overview
      • Executive Summary - Chart on Global Market Characteristics
      • Executive Summary - Chart on Market by Geography
      • Executive Summary - Chart on Market Segmentation by Type
      • Executive Summary - Chart on Market Segmentation by Distribution Channel
      • Executive Summary - Chart on Market Segmentation by Product Type
      • Executive Summary - Chart on Incremental Growth
      • Executive Summary - Data Table on Incremental Growth
      • Executive Summary - Chart on Company Market Positioning

    2 Technavio Analysis

    • 2.1 Analysis of price sensitivity, lifecycle, customer purchase basket, adoption rates, and purchase criteria
      • Analysis of price sensitivity, lifecycle, customer purchase basket, adoption rates, and purchase criteria
    • 2.2 Criticality of inputs and Factors of differentiation
      • Overview on criticality of inputs and factors of differentiation
    • 2.3 Factors of disruption
      • Overview on factors of disruption
    • 2.4 Impact of drivers and challenges
      • Impact of drivers and challenges in 2024 and 2029

    3 Market Landscape

    • 3.1 Market ecosystem
      • Parent Market
      • Data Table on - Parent Market
    • 3.2 Market characteristics
      • Market characteristics analysis
    • 3.3 Value chain analysis
      • Value chain analysis

    4 Market Sizing

    • 4.1 Market definition
      • Offerings of companies included in the market definition
    • 4.2 Market segment analysis
      • Market segments
    • 4.3 Market size 2024
      • 4.4 Market outlook: Forecast for 2024-2029
        • Chart on Global - Market size and forecast 2024-2029 ($ million)
        • Data Table on Global - Market size and forecast 2024-2029 ($ million)
        • Chart on Global Market: Year-over-year growth 2024-2029 (%)
        • Data Table on Global Market: Year-over-year growth 2024-2029 (%)

      5 Historic Market Size

      • 5.1 Global Solar Home Systems Market 2019 - 2023
        • Historic Market Size - Data Table on Global Solar Home Systems Market 2019 - 2023 ($ million)
      • 5.2 Type segment analysis 2019 - 2023
        • Historic Market Size - Type Segment 2019 - 2023 ($ million)
      • 5.3 Distribution Channel segment analysis 2019 - 2023
        • Historic Market Size - Distribution Channel Segment 2019 - 2023 ($ million)
      • 5.4 Product Type segment analysis 2019 - 2023
        • Historic Market Size - Product Type Segment 2019 - 2023 ($ million)
      • 5.5 Geography segment analysis 2019 - 2023
        • Historic Market Size - Geography Segment 2019 - 2023 ($ million)
      • 5.6 Country segment analysis 2019 - 2023
        • Historic Market Size - Country Segment 2019 - 2023 ($ million)

      6 Qualitative Analysis

      • 6.1 The AI impact on Global Solar Home Systems Market

        7 Five Forces Analysis

        • 7.1 Five forces summary
          • Five forces analysis - Comparison between 2024 and 2029
        • 7.2 Bargaining power of buyers
          • Bargaining power of buyers - Impact of key factors 2024 and 2029
        • 7.3 Bargaining power of suppliers
          • Bargaining power of suppliers - Impact of key factors in 2024 and 2029
        • 7.4 Threat of new entrants
          • Threat of new entrants - Impact of key factors in 2024 and 2029
        • 7.5 Threat of substitutes
          • Threat of substitutes - Impact of key factors in 2024 and 2029
        • 7.6 Threat of rivalry
          • Threat of rivalry - Impact of key factors in 2024 and 2029
        • 7.7 Market condition
          • Chart on Market condition - Five forces 2024 and 2029

        8 Market Segmentation by Type

        • 8.1 Market segments
          • Chart on Type - Market share 2024-2029 (%)
          • Data Table on Type - Market share 2024-2029 (%)
        • 8.2 Comparison by Type
          • Chart on Comparison by Type
          • Data Table on Comparison by Type
        • 8.3 PAYG products - Market size and forecast 2024-2029
          • Chart on PAYG products - Market size and forecast 2024-2029 ($ million)
          • Data Table on PAYG products - Market size and forecast 2024-2029 ($ million)
          • Chart on PAYG products - Year-over-year growth 2024-2029 (%)
          • Data Table on PAYG products - Year-over-year growth 2024-2029 (%)
        • 8.4 Cash products - Market size and forecast 2024-2029
          • Chart on Cash products - Market size and forecast 2024-2029 ($ million)
          • Data Table on Cash products - Market size and forecast 2024-2029 ($ million)
          • Chart on Cash products - Year-over-year growth 2024-2029 (%)
          • Data Table on Cash products - Year-over-year growth 2024-2029 (%)
        • 8.5 Market opportunity by Type
          • Market opportunity by Type ($ million)
          • Data Table on Market opportunity by Type ($ million)

        9 Market Segmentation by Distribution Channel

        • 9.1 Market segments
          • Chart on Distribution Channel - Market share 2024-2029 (%)
          • Data Table on Distribution Channel - Market share 2024-2029 (%)
        • 9.2 Comparison by Distribution Channel
          • Chart on Comparison by Distribution Channel
          • Data Table on Comparison by Distribution Channel
        • 9.3 Offline - Market size and forecast 2024-2029
          • Chart on Offline - Market size and forecast 2024-2029 ($ million)
          • Data Table on Offline - Market size and forecast 2024-2029 ($ million)
          • Chart on Offline - Year-over-year growth 2024-2029 (%)
          • Data Table on Offline - Year-over-year growth 2024-2029 (%)
        • 9.4 Online - Market size and forecast 2024-2029
          • Chart on Online - Market size and forecast 2024-2029 ($ million)
          • Data Table on Online - Market size and forecast 2024-2029 ($ million)
          • Chart on Online - Year-over-year growth 2024-2029 (%)
          • Data Table on Online - Year-over-year growth 2024-2029 (%)
        • 9.5 Market opportunity by Distribution Channel
          • Market opportunity by Distribution Channel ($ million)
          • Data Table on Market opportunity by Distribution Channel ($ million)

        10 Market Segmentation by Product Type

        • 10.1 Market segments
          • Chart on Product Type - Market share 2024-2029 (%)
          • Data Table on Product Type - Market share 2024-2029 (%)
        • 10.2 Comparison by Product Type
          • Chart on Comparison by Product Type
          • Data Table on Comparison by Product Type
        • 10.3 Off-grid - Market size and forecast 2024-2029
          • Chart on Off-grid - Market size and forecast 2024-2029 ($ million)
          • Data Table on Off-grid - Market size and forecast 2024-2029 ($ million)
          • Chart on Off-grid - Year-over-year growth 2024-2029 (%)
          • Data Table on Off-grid - Year-over-year growth 2024-2029 (%)
        • 10.4 On-grid - Market size and forecast 2024-2029
          • Chart on On-grid - Market size and forecast 2024-2029 ($ million)
          • Data Table on On-grid - Market size and forecast 2024-2029 ($ million)
          • Chart on On-grid - Year-over-year growth 2024-2029 (%)
          • Data Table on On-grid - Year-over-year growth 2024-2029 (%)
        • 10.5 Market opportunity by Product Type
          • Market opportunity by Product Type ($ million)
          • Data Table on Market opportunity by Product Type ($ million)

        11 Customer Landscape

        • 11.1 Customer landscape overview
          • Analysis of price sensitivity, lifecycle, customer purchase basket, adoption rates, and purchase criteria

        12 Geographic Landscape

        • 12.1 Geographic segmentation
          • Chart on Market share by geography 2024-2029 (%)
          • Data Table on Market share by geography 2024-2029 (%)
        • 12.2 Geographic comparison
          • Chart on Geographic comparison
          • Data Table on Geographic comparison
        • 12.3 Middle East and Africa - Market size and forecast 2024-2029
          • Chart on Middle East and Africa - Market size and forecast 2024-2029 ($ million)
          • Data Table on Middle East and Africa - Market size and forecast 2024-2029 ($ million)
          • Chart on Middle East and Africa - Year-over-year growth 2024-2029 (%)
          • Data Table on Middle East and Africa - Year-over-year growth 2024-2029 (%)
        • 12.4 APAC - Market size and forecast 2024-2029
          • Chart on APAC - Market size and forecast 2024-2029 ($ million)
          • Data Table on APAC - Market size and forecast 2024-2029 ($ million)
          • Chart on APAC - Year-over-year growth 2024-2029 (%)
          • Data Table on APAC - Year-over-year growth 2024-2029 (%)
        • 12.5 South America - Market size and forecast 2024-2029
          • Chart on South America - Market size and forecast 2024-2029 ($ million)
          • Data Table on South America - Market size and forecast 2024-2029 ($ million)
          • Chart on South America - Year-over-year growth 2024-2029 (%)
          • Data Table on South America - Year-over-year growth 2024-2029 (%)
        • 12.6 North America - Market size and forecast 2024-2029
          • Chart on North America - Market size and forecast 2024-2029 ($ million)
          • Data Table on North America - Market size and forecast 2024-2029 ($ million)
          • Chart on North America - Year-over-year growth 2024-2029 (%)
          • Data Table on North America - Year-over-year growth 2024-2029 (%)
        • 12.7 Europe - Market size and forecast 2024-2029
          • Chart on Europe - Market size and forecast 2024-2029 ($ million)
          • Data Table on Europe - Market size and forecast 2024-2029 ($ million)
          • Chart on Europe - Year-over-year growth 2024-2029 (%)
          • Data Table on Europe - Year-over-year growth 2024-2029 (%)
        • 12.8 Saudi Arabia - Market size and forecast 2024-2029
          • Chart on Saudi Arabia - Market size and forecast 2024-2029 ($ million)
          • Data Table on Saudi Arabia - Market size and forecast 2024-2029 ($ million)
          • Chart on Saudi Arabia - Year-over-year growth 2024-2029 (%)
          • Data Table on Saudi Arabia - Year-over-year growth 2024-2029 (%)
        • 12.9 UAE - Market size and forecast 2024-2029
          • Chart on UAE - Market size and forecast 2024-2029 ($ million)
          • Data Table on UAE - Market size and forecast 2024-2029 ($ million)
          • Chart on UAE - Year-over-year growth 2024-2029 (%)
          • Data Table on UAE - Year-over-year growth 2024-2029 (%)
        • 12.10 Japan - Market size and forecast 2024-2029
          • Chart on Japan - Market size and forecast 2024-2029 ($ million)
          • Data Table on Japan - Market size and forecast 2024-2029 ($ million)
          • Chart on Japan - Year-over-year growth 2024-2029 (%)
          • Data Table on Japan - Year-over-year growth 2024-2029 (%)
        • 12.11 India - Market size and forecast 2024-2029
          • Chart on India - Market size and forecast 2024-2029 ($ million)
          • Data Table on India - Market size and forecast 2024-2029 ($ million)
          • Chart on India - Year-over-year growth 2024-2029 (%)
          • Data Table on India - Year-over-year growth 2024-2029 (%)
        • 12.12 South Africa - Market size and forecast 2024-2029
          • Chart on South Africa - Market size and forecast 2024-2029 ($ million)
          • Data Table on South Africa - Market size and forecast 2024-2029 ($ million)
          • Chart on South Africa - Year-over-year growth 2024-2029 (%)
          • Data Table on South Africa - Year-over-year growth 2024-2029 (%)
        • 12.13 Egypt - Market size and forecast 2024-2029
          • Chart on Egypt - Market size and forecast 2024-2029 ($ million)
          • Data Table on Egypt - Market size and forecast 2024-2029 ($ million)
          • Chart on Egypt - Year-over-year growth 2024-2029 (%)
          • Data Table on Egypt - Year-over-year growth 2024-2029 (%)
        • 12.14 South Korea - Market size and forecast 2024-2029
          • Chart on South Korea - Market size and forecast 2024-2029 ($ million)
          • Data Table on South Korea - Market size and forecast 2024-2029 ($ million)
          • Chart on South Korea - Year-over-year growth 2024-2029 (%)
          • Data Table on South Korea - Year-over-year growth 2024-2029 (%)
        • 12.15 US - Market size and forecast 2024-2029
          • Chart on US - Market size and forecast 2024-2029 ($ million)
          • Data Table on US - Market size and forecast 2024-2029 ($ million)
          • Chart on US - Year-over-year growth 2024-2029 (%)
          • Data Table on US - Year-over-year growth 2024-2029 (%)
        • 12.16 Nigeria - Market size and forecast 2024-2029
          • Chart on Nigeria - Market size and forecast 2024-2029 ($ million)
          • Data Table on Nigeria - Market size and forecast 2024-2029 ($ million)
          • Chart on Nigeria - Year-over-year growth 2024-2029 (%)
          • Data Table on Nigeria - Year-over-year growth 2024-2029 (%)
        • 12.17 China - Market size and forecast 2024-2029
          • Chart on China - Market size and forecast 2024-2029 ($ million)
          • Data Table on China - Market size and forecast 2024-2029 ($ million)
          • Chart on China - Year-over-year growth 2024-2029 (%)
          • Data Table on China - Year-over-year growth 2024-2029 (%)
        • 12.18 Market opportunity by geography
          • Market opportunity by geography ($ million)
          • Data Tables on Market opportunity by geography ($ million)

        13 Drivers, Challenges, and Opportunity/Restraints

        • 13.1 Market drivers
          • 13.2 Market challenges
            • 13.3 Impact of drivers and challenges
              • Impact of drivers and challenges in 2024 and 2029
            • 13.4 Market opportunities/restraints

              14 Competitive Landscape

              • 14.1 Overview
                • 14.2 Competitive Landscape
                  • Overview on criticality of inputs and factors of differentiation
                • 14.3 Landscape disruption
                  • Overview on factors of disruption
                • 14.4 Industry risks
                  • Impact of key risks on business

                15 Competitive Analysis

                • 15.1 Companies profiled
                  • Companies covered
                • 15.2 Company ranking index
                  • Company ranking index
                • 15.3 Market positioning of companies
                  • Matrix on companies position and classification
                • 15.4 ABB Ltd.
                  • ABB Ltd. - Overview
                  • ABB Ltd. - Business segments
                  • ABB Ltd. - Key news
                  • ABB Ltd. - Key offerings
                  • ABB Ltd. - Segment focus
                  • SWOT
                • 15.5 Canadian Solar Inc.
                  • Canadian Solar Inc. - Overview
                  • Canadian Solar Inc. - Business segments
                  • Canadian Solar Inc. - Key news
                  • Canadian Solar Inc. - Key offerings
                  • Canadian Solar Inc. - Segment focus
                  • SWOT
                • 15.6 Enphase Energy Inc.
                  • Enphase Energy Inc. - Overview
                  • Enphase Energy Inc. - Product / Service
                  • Enphase Energy Inc. - Key news
                  • Enphase Energy Inc. - Key offerings
                  • SWOT
                • 15.7 JinkoSolar Holding Co. Ltd.
                  • JinkoSolar Holding Co. Ltd. - Overview
                  • JinkoSolar Holding Co. Ltd. - Product / Service
                  • JinkoSolar Holding Co. Ltd. - Key news
                  • JinkoSolar Holding Co. Ltd. - Key offerings
                  • SWOT
                • 15.8 LG Corp.
                  • LG Corp. - Overview
                  • LG Corp. - Product / Service
                  • LG Corp. - Key offerings
                  • SWOT
                • 15.9 Lumos Global BV
                  • Lumos Global BV - Overview
                  • Lumos Global BV - Product / Service
                  • Lumos Global BV - Key offerings
                  • SWOT
                • 15.10 Panasonic Holdings Corp.
                  • Panasonic Holdings Corp. - Overview
                  • Panasonic Holdings Corp. - Business segments
                  • Panasonic Holdings Corp. - Key news
                  • Panasonic Holdings Corp. - Key offerings
                  • Panasonic Holdings Corp. - Segment focus
                  • SWOT
                • 15.11 REC Solar Holdings AS
                  • REC Solar Holdings AS - Overview
                  • REC Solar Holdings AS - Product / Service
                  • REC Solar Holdings AS - Key offerings
                  • SWOT
                • 15.12 Schneider Electric SE
                  • Schneider Electric SE - Overview
                  • Schneider Electric SE - Business segments
                  • Schneider Electric SE - Key news
                  • Schneider Electric SE - Key offerings
                  • Schneider Electric SE - Segment focus
                  • SWOT
                • 15.13 SMA Solar Technology AG
                  • SMA Solar Technology AG - Overview
                  • SMA Solar Technology AG - Business segments
                  • SMA Solar Technology AG - Key offerings
                  • SMA Solar Technology AG - Segment focus
                  • SWOT
                • 15.14 SunPower Corp.
                  • SunPower Corp. - Overview
                  • SunPower Corp. - Product / Service
                  • SunPower Corp. - Key news
                  • SunPower Corp. - Key offerings
                  • SWOT
                • 15.15 Tata Power Co. Ltd.
                  • Tata Power Co. Ltd. - Overview
                  • Tata Power Co. Ltd. - Business segments
                  • Tata Power Co. Ltd. - Key offerings
                  • Tata Power Co. Ltd. - Segment focus
                  • SWOT
                • 15.16 Tesla Inc.
                  • Tesla Inc. - Overview
                  • Tesla Inc. - Business segments
                  • Tesla Inc. - Key news
                  • Tesla Inc. - Key offerings
                  • Tesla Inc. - Segment focus
                  • SWOT
                • 15.17 Trina Solar Co. Ltd.
                  • Trina Solar Co. Ltd. - Overview
                  • Trina Solar Co. Ltd. - Product / Service
                  • Trina Solar Co. Ltd. - Key news
                  • Trina Solar Co. Ltd. - Key offerings
                  • SWOT
                • 15.18 Yingli Solar
                  • Yingli Solar - Overview
                  • Yingli Solar - Product / Service
                  • Yingli Solar - Key news
                  • Yingli Solar - Key offerings
                  • SWOT

                16 Appendix

                • 16.1 Scope of the report
                  • 16.2 Inclusions and exclusions checklist
                    • Inclusions checklist
                    • Exclusions checklist
                  • 16.3 Currency conversion rates for US$
                    • Currency conversion rates for US$
                  • 16.4 Research methodology
                    • Research methodology
                  • 16.5 Data procurement
                    • Information sources
                  • 16.6 Data validation
                    • Data validation
                  • 16.7 Validation techniques employed for market sizing
                    • Validation techniques employed for market sizing
                  • 16.8 Data synthesis
                    • Data synthesis
                  • 16.9 360 degree market analysis
                    • 360 degree market analysis
                  • 16.10 List of abbreviations
                    • List of abbreviations

                  Research Methodology

                  Technavio presents a detailed picture of the market by way of study, synthesis, and summation of data from multiple sources. The analysts have presented the various facets of the market with a particular focus on identifying the key industry influencers. The data thus presented is comprehensive, reliable, and the result of extensive research, both primary and secondary.

                  INFORMATION SOURCES

                  Primary sources

                  • Manufacturers and suppliers
                  • Channel partners
                  • Industry experts
                  • Strategic decision makers

                  Secondary sources

                  • Industry journals and periodicals
                  • Government data
                  • Financial reports of key industry players
                  • Historical data
                  • Press releases

                  DATA ANALYSIS

                  Data Synthesis

                  • Collation of data
                  • Estimation of key figures
                  • Analysis of derived insights

                  Data Validation

                  • Triangulation with data models
                  • Reference against proprietary databases
                  • Corroboration with industry experts

                  REPORT WRITING

                  Qualitative

                  • Market drivers
                  • Market challenges
                  • Market trends
                  • Five forces analysis

                  Quantitative

                  • Market size and forecast
                  • Market segmentation
                  • Geographical insights
                  • Competitive landscape

                  Interested in this report?

                  Get your sample now to see our research methodology and insights!

                  Download Now

                  Frequently Asked Questions

                  Solar Home Systems market growth will increase by $ 4285.2 mn during 2025-2029 .

                  The Solar Home Systems market is expected to grow at a CAGR of 24.5% during 2025-2029 .

                  Solar Home Systems market is segmented by Type( PAYG products, Cash products) Distribution Channel( Offline, Online, South America, North America, Europe) Product Type( Off-grid, On-grid, South America, North America, Europe)

                  ABB Ltd., Array Technologies Inc., Canadian Solar Inc., Enphase Energy Inc., Greenlight Planet, JinkoSolar Holding Co. Ltd., LG Corp., Lumos Global BV, Panasonic Holdings Corp., Phocos AG, REC Solar Holdings AS, Schneider Electric SE, Shell plc, SMA Solar Technology AG, SolarEdge Technologies Inc., SunPower Corp., Tata Power Co. Ltd., Tesla Inc., Trina Solar Co. Ltd., Yingli Solar are a few of the key vendors in the Solar Home Systems market.

                  APAC will register the highest growth rate of 42% among the other regions. Therefore, the Solar Home Systems market in APAC is expected to garner significant business opportunities for the vendors during the forecast period.

                  UAE, Saudi Arabia, US, Egypt, South Africa, China, Nigeria, South Korea, India, Japan

                  • Availability of favorable financing optionsFee-for-service or PAYG concepts for solar home systems have been gaining popularity in regions such as Africa and Asia. The companies that are actively involved in the PAYG solar home systems business are known as off-grid energy companies or distributed energy service companies. For PAYG products is the driving factor this market.
                  • companies rent out solar lighting systems is the driving factor this market.
                  • which constitute home products such as lights is the driving factor this market.
                  • TVs is the driving factor this market.
                  • and refrigerators is the driving factor this market.
                  • along with solar-based power supply mechanisms is the driving factor this market.
                  • to consumers. The customers then pay for the product in installments or for the use of the product as a service. As this system is based on information technology is the driving factor this market.
                  • it allows companies to minimize transaction costs is the driving factor this market.
                  • remotely activate services is the driving factor this market.
                  • and automate payments. Also is the driving factor this market.
                  • consumers receive immediate access to clean and ready-to-use solar home systems without the need for any kind of loan. Under this model is the driving factor this market.
                  • customers can opt to either take over the ownership of the systems or just purchase solar home systems as a service. For instance is the driving factor this market.
                  • in India is the driving factor this market.
                  • Sun Kings EasyBuy solution leverages the PAYG model to promote the adoption of solar lamps and home lighting systems. On the other hand is the driving factor this market.
                  • Pollinate Energy Ltd. is the driving factor this market.
                  • which is a social enterprise is the driving factor this market.
                  • uses a distribution network that employs the PAYG concept to make quality solar lighting products affordable and accessible to underprivileged consumers. These factors will boost the growth of the global solar home systems market during the forecast period. is the driving factor this market.

                  The Solar Home Systems market vendors should focus on grabbing business opportunities from the PAYG products segment as it accounted for the largest market share in the base year.