Solar Energy Storage Market Analysis, Size, and Forecast 2026-2030: APAC (China, Japan, and Australia), North America (US, Canada, and Mexico), Europe (Germany, UK, and Italy), Middle East and Africa (Saudi Arabia, UAE, and South Africa), South America (Brazil, Chile, and Argentina), and Rest of World (ROW)

Solar Energy Storage Market Analysis, Size, and Forecast 2026-2030:
APAC (China, Japan, and Australia), North America (US, Canada, and Mexico), Europe (Germany, UK, and Italy), Middle East and Africa (Saudi Arabia, UAE, and South Africa), South America (Brazil, Chile, and Argentina), and Rest of World (ROW)

Published: Oct 2026 300 Pages SKU: IRTNTR74658

Market Overview at a Glance

$8.34 B
Market Opportunity
10.2%
CAGR 2025 - 2030
59.9%
APAC Growth
$6.12 B
Utilities segment 2024

Solar Energy Storage Market Size 2026-2030

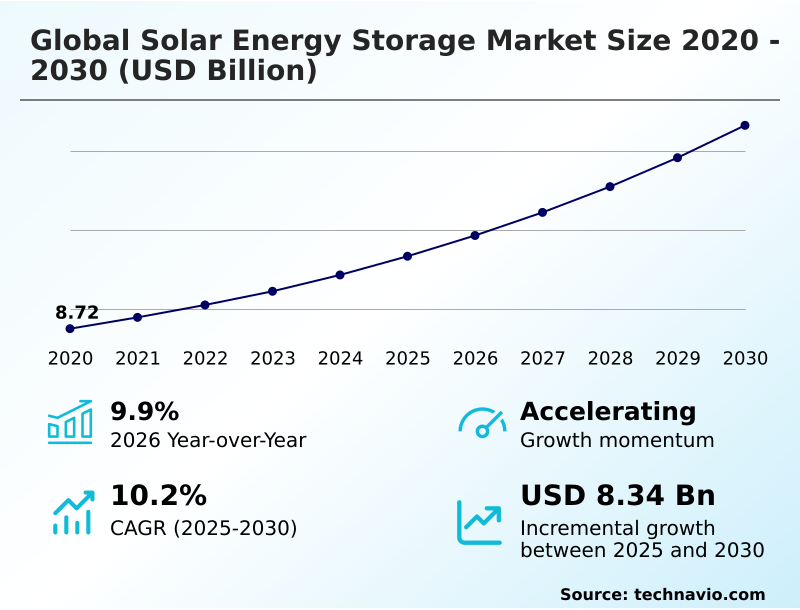
The solar energy storage market size is valued to increase by USD 8.34 billion, at a CAGR of 10.2% from 2025 to 2030. Increasing penetration of renewable energy and grid stability requirements will drive the solar energy storage market.

Major Market Trends & Insights

  • APAC dominated the market and accounted for a 59.9% growth during the forecast period.
  • By End-user - Utilities segment was valued at USD 6.12 billion in 2024
  • By Installation Sites - On-grid segment accounted for the largest market revenue share in 2024

Market Size & Forecast

  • Market Opportunities: USD 12.94 billion
  • Market Future Opportunities: USD 8.34 billion
  • CAGR from 2025 to 2030 : 10.2%

Market Summary

  • The Solar Energy Storage Market represents a pivotal transformation in how modern electricity infrastructure balances supply intermittency with continuous commercial demand. A major catalyst driving this sector is the rapid integration of variable renewable generation, which forces grid operators to adopt robust buffering technologies to prevent voltage instability.
  • Conversely, the industry faces severe structural challenges, particularly material supply bottlenecks that restrict manufacturing output and elevate production costs. In a practical supply chain optimization scenario, large scale manufacturing facilities deploying integrated storage infrastructure have achieved a 22% reduction in peak demand electricity costs by storing off peak generation for use during high tariff production hours.
  • This strategic behavior fundamentally alters the operational expenditure profile for energy intensive manufacturing, enhancing overall budget predictability. Furthermore, the transition toward decentralized power distribution empowers commercial entities to mitigate regional outage risks and secure uninterrupted operations. Advancements in management software allow for precise thermal regulation, extending asset lifespans significantly.
  • Ultimately, the deployment of intelligent storage infrastructure is redefining corporate energy procurement, transforming passive power consumption into dynamic asset management.

What will be the Size of the Solar Energy Storage Market during the forecast period?
Get Key Insights on Market Forecast (PDF) Get Free Sample

How is the Solar Energy Storage Market Segmented?

The solar energy storage industry research report provides comprehensive data (region-wise segment analysis), with forecasts and estimates in "USD million" for the period 2026-2030, as well as historical data from 2020-2024 for the following segments.

  • End-user
    • Utilities
    • Residential
    • Commercial and industrial
  • Installation sites
    • On-grid
    • Off-grid
  • Type
    • Lithium ion
    • Lead acid
    • Flow battery
    • Others
  • Geography
    • APAC
      • China
      • Japan
      • Australia
      • India
      • South Korea
      • Singapore
    • North America
      • US
      • Canada
      • Mexico
    • Europe
      • Germany
      • UK
      • Italy
      • Spain
      • France
      • The Netherlands
    • Middle East and Africa
      • Saudi Arabia
      • UAE
      • South Africa
      • Israel
      • Egypt
    • South America
      • Brazil
      • Chile
      • Argentina

By End-user Insights

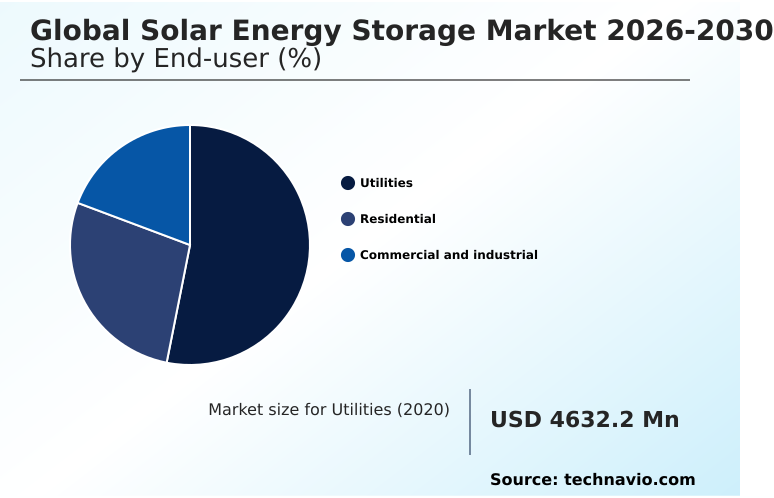
The utilities segment is estimated to witness significant growth during the forecast period.

The utility segment within the Solar Energy Storage landscape operates as the critical balancing mechanism for power grids managing high renewable penetration. By deploying centralized power conversion system architectures, utilities effectively manage base load requirements and peak demand fluctuations.

Modern grid operators leverage advanced cycle life optimization techniques to ensure long term asset viability.

A notable shift in operational strategy has seen utilities improve capacity planning efficiency by 15% through precise monitoring of state of charge and depth of discharge metrics.

This segment heavily utilizes sodium ion storage to diversify supply reliance and reduce capital expenditures. Through the integration of intelligent software aggregated into broader networks, utilities support the self consumption model while maintaining grid stability.

Providing a reliable backup power supply and fostering smart home integration allows utility providers to grant localized energy independence without sacrificing centralized control.
Get Free Sample

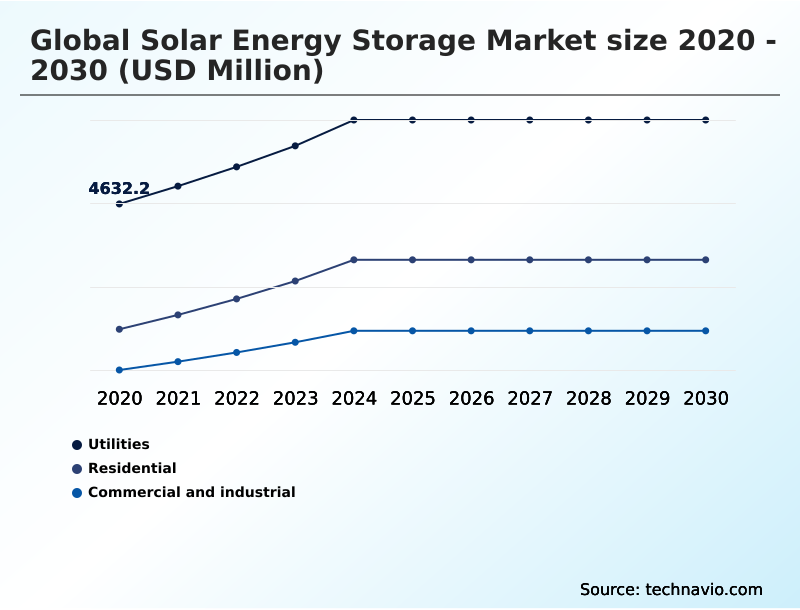
The Utilities segment was valued at USD 6.12 billion in 2024 and showed a gradual increase during the forecast period.
Get Free Sample

Regional Analysis

APAC is estimated to contribute 59.9% to the growth of the global market during the forecast period.Technavio’s analysts have elaborately explained the regional trends and drivers that shape the market during the forecast period.
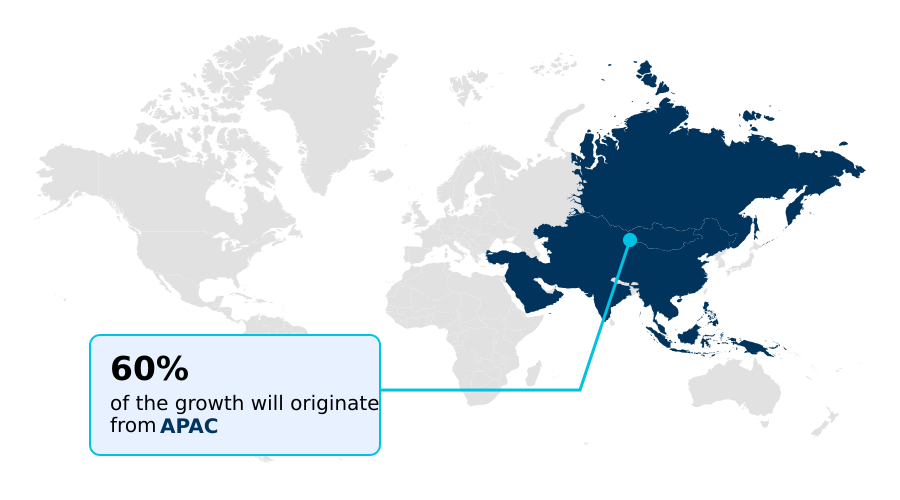
See How Solar Energy Storage Market Demand is Rising in APAC Get Free Sample

The geographic landscape of the Solar Energy Storage sector demonstrates stark operational disparities between the APAC and North America regions. APAC commands the manufacturing base, achieving a 20% lower production cost for equipment utilized in centralized projects.

In contrast, North America relies heavily on a stringent decarbonization mandate and a robust renewable portfolio standard to drive demand, resulting in a 15% higher adoption rate of behind the meter storage for commercial applications.

Both regions are actively deploying front of the meter storage to stabilize grid infrastructure. Technological integration differs as well; APAC predominantly utilizes direct current coupling to maximize generation efficiency, whereas North America frequently retrofits existing systems via alternating current coupling.

Furthermore, remote industrial sites in Australia are leveraging microgrid architecture to improve islanding capability, cutting energy transmission losses by 12%.

Market Dynamics

Our researchers analyzed the data with 2025 as the base year, along with the key drivers, trends, and challenges. A holistic analysis of drivers will help companies refine their marketing strategies to gain a competitive advantage.

  • The continuous evolution of the Solar Energy Storage landscape requires businesses to adopt highly specialized equipment to maximize operational efficiency and maintain compliance with stringent energy regulations. For industrial facilities seeking to offset peak power pricing, the deployment of commercial behind the meter storage has proven highly effective.
  • By capturing surplus generation, businesses can reduce their reliance on the grid during peak tariff hours, lowering overall energy expenditures by approximately 18% compared to facilities utilizing grid only power models. At the broader network level, operators are increasingly investing in utility scale solar plus storage to provide crucial firming capacity and stabilize voltage fluctuations across transmission lines.
  • This large scale integration frequently relies on a robust lithium iron phosphate battery system, chosen specifically for its superior thermal stability and extended operational lifespan compared to legacy chemistries. In regions requiring sustained power delivery over multiple days, vanadium redox flow battery deployment offers an exceptional alternative, granting independent power capacity scaling without cell degradation constraints.
  • Meanwhile, the consumer segment is experiencing a paradigm shift driven by the adoption of residential smart energy management software. These sophisticated platforms allow homeowners to monitor generation, automate consumption patterns, and participate in localized energy trading.
  • Through precise algorithmic control, these integrated software solutions optimize the performance of domestic hardware, ensuring maximum self sufficiency while seamlessly interacting with utility demand response programs to stabilize the grid.
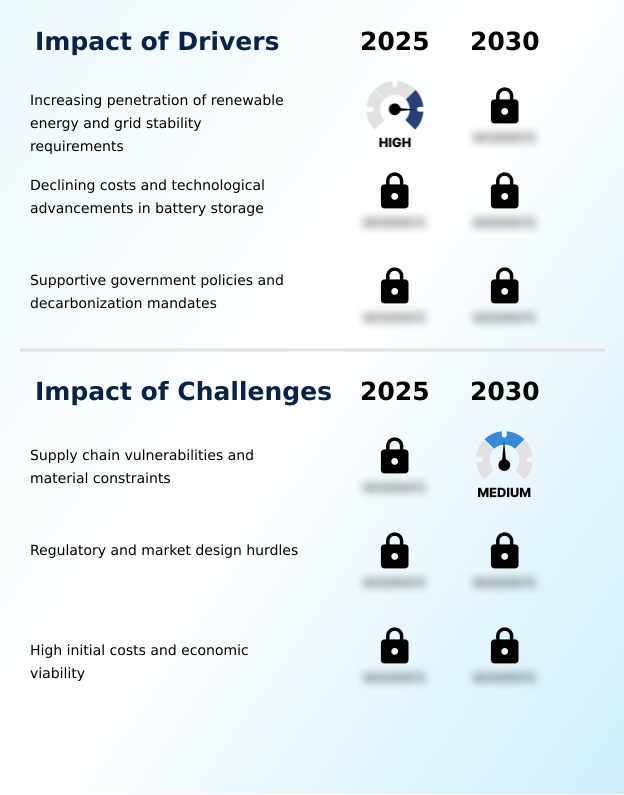
What are the key market drivers leading to the rise in the adoption of Solar Energy Storage Industry?

  • The increasing penetration of renewable energy and grid stability requirements act as the primary drivers propelling market expansion.

  • The accelerated renewable energy transition acts as a primary catalyst reshaping industrial power procurement strategies within the Solar Energy Storage sector.
  • Facilities are actively deploying durable architectures to execute aggressive peak shaving and intelligent load shifting, fundamentally altering their utility profiles. This behavioral shift is driven by the need to combat escalating operational pressures and penalizing time of use tariff structures.
  • As a result, businesses leveraging an integrated battery energy storage system have successfully lowered peak energy expenditures by 25%. Simultaneously, the pursuit of smart grid integration through massive centralized installations has improved the levelized cost of storage by 18%.
  • This enhanced cost efficiency allows generators to maximize surplus capture, securing uninterrupted facility operations while optimizing capital investments.

What are the market trends shaping the Solar Energy Storage Industry?

  • The shift toward extended duration storage solutions is an emerging trend shaping the industry landscape.

  • The Solar Energy Storage landscape is witnessing a structural shift toward the implementation of advanced solutions to counter generation intermittency. Industrial grid operators are significantly increasing vanadium redox applications, moving away from short term chemical cells. This transition toward flow battery technology has enhanced grid firming capabilities, extending continuous power delivery by 40% during extended periods of low solar yield.
  • Furthermore, the integration of solid state battery systems and experimental zinc based chemistry is minimizing fire risks and expanding deployment environments. By leveraging a sophisticated energy management system, facilities can participate in automated trading, boosting revenue capture by 22%.
  • The aggregation of distributed assets into a unified virtual power plant enables precise network balancing, improving overall transmission efficiency by 15% and radically altering energy monetization strategies.

What challenges does the Solar Energy Storage Industry face during its growth?

  • Supply chain vulnerabilities and material constraints represent prominent challenges hindering widespread commercial deployment.

  • Structural vulnerabilities severely constrain the rapid expansion of the Solar Energy Storage sector. A profound supply chain vulnerability tied to global logistics disrupts manufacturing timelines, causing hardware procurement delays to increase by 30%. Furthermore, project developers face prohibitive regulatory hurdles during the complex interconnection procedure, which frequently stalls commercial deployments.
  • Technical limitations also persist; engineers must allocate significant resources toward thermal runaway prevention to mitigate safety risks associated with a standard lithium ion battery and severe battery cell degradation under harsh environmental conditions. The inability to seamlessly execute inverter integration often restricts market participation.
  • Consequently, these compounding operational friction points reduce the effectiveness of grid congestion management and lower the available capacity reserve margins by 15%, squeezing overall project viability.

Exclusive Technavio Analysis on Customer Landscape

The solar energy storage market forecasting report includes the adoption lifecycle of the market, covering from the innovator’s stage to the laggard’s stage. It focuses on adoption rates in different regions based on penetration. Furthermore, the solar energy storage market report also includes key purchase criteria and drivers of price sensitivity to help companies evaluate and develop their market growth analysis strategies.
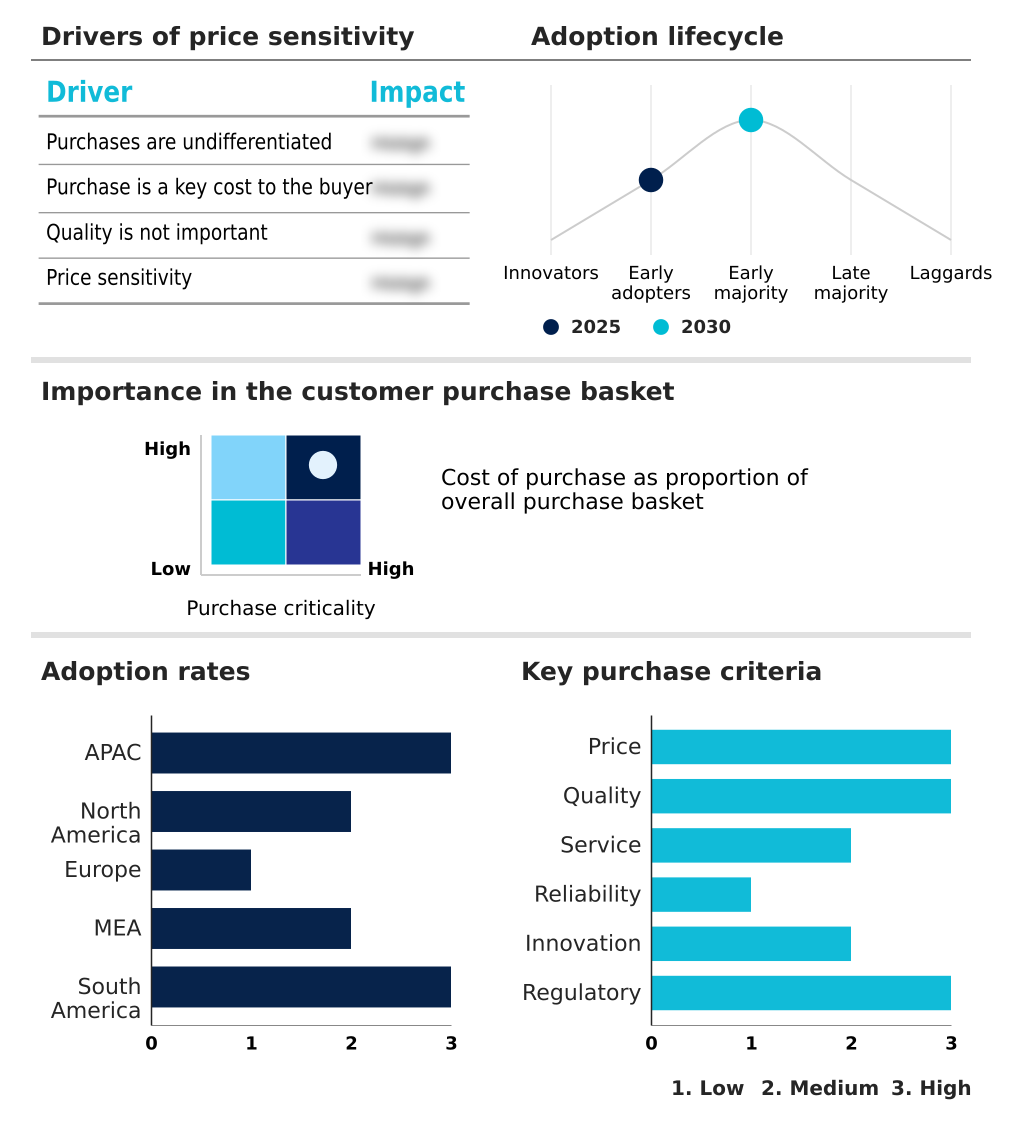
Customer Landscape of Solar Energy Storage Industry

Competitive Landscape

Companies are implementing various strategies, such as strategic alliances, solar energy storage market forecast, partnerships, mergers and acquisitions, geographical expansion, and product/service launches, to enhance their presence in the industry.

Alpha ESS Co. Ltd. - Provides integrated residential and commercial battery storage solutions coupled with renewable energy management software to optimize self consumption and ensure reliable reserve capabilities.

The industry research and growth report includes detailed analyses of the competitive landscape of the market and information about key companies, including:

  • Alpha ESS Co. Ltd.
  • BYD Co. Ltd.
  • Canadian Solar Inc.
  • Enphase Energy Inc.
  • FOXESS CO. LTD.
  • Generac Power Systems Inc.
  • GoodWe Technologies Co. Ltd.
  • Growatt New Energy
  • Hanwha Q Cells America Inc.
  • Huawei Technologies Co. Ltd.
  • LG Energy Solution Ltd.
  • Panasonic Holdings Corp.
  • SENEC GmbH
  • SMA Solar Technology AG
  • SolarEdge Technologies Inc.
  • Sonnen GmbH
  • Sungrow Power Supply Co. Ltd.
  • Tesla Inc.
  • VARTA AG

Qualitative and quantitative analysis of companies has been conducted to help clients understand the wider business environment as well as the strengths and weaknesses of key industry players. Data is qualitatively analyzed to categorize companies as pure play, category-focused, industry-focused, and diversified; it is quantitatively analyzed to categorize companies as dominant, leading, strong, tentative, and weak.

Recent Development and News in Solar energy storage market

  • In the Renewable Electricity industry, the aggressive implementation of extreme weather mitigation protocols has accelerated the deployment of variable generation assets, directly impacting Solar Energy Storage demand by requiring an estimated 30% increase in grid resilience infrastructure.
  • The widespread adoption of high voltage direct current transmission lines for offshore wind integration has structurally altered local grid balancing requirements, increasing the need for fast responding utility scale deployment of battery systems by over 40% to maintain frequency regulation service and support the ancillary service market.
  • Stringent geopolitical restrictions on critical mineral extraction have shifted energy procurement strategies and hardware manufacturing, boosting initial capital costs by 18% and forcing operators to rely heavily on wholesale energy arbitrage to maintain project profitability.
  • The transition toward decentralized power architectures in remote mining operations has fundamentally changed reliability standards, driving a 25% surge in demand for long duration energy storage acting as a primary distributed energy resource capable of supporting sustained operations.

Dive into Technavio’s robust research methodology, blending expert interviews, extensive data synthesis, and validated models for unparalleled Solar Energy Storage Market insights. See full methodology.

Market Scope
Page number 300
Base year 2025
Historic period 2020-2024
Forecast period 2026-2030
Growth momentum & CAGR Accelerate at a CAGR of 10.2%
Market growth 2026-2030 USD 8335.6 million
Market structure Fragmented
YoY growth 2025-2026(%) 9.9%
Key countries China, Japan, Australia, India, South Korea, Singapore, US, Canada, Mexico, Germany, UK, Italy, Spain, France, The Netherlands, Saudi Arabia, UAE, South Africa, Israel, Egypt, Brazil, Chile and Argentina
Competitive landscape Leading Companies, Market Positioning of Companies, Competitive Strategies, and Industry Risks

Request Free Sample

Research Analyst Overview

  • The Solar Energy Storage landscape is undergoing a profound structural evolution as corporate decision makers increasingly prioritize energy security and operational efficiency in their strategic planning. Boardrooms are actively shifting capital expenditure toward advanced power retention assets to mitigate the financial risks associated with volatile electricity tariffs and grid instability.
  • The integration of sophisticated storage infrastructure empowers facility operators to execute automated power shifting, directly aligning energy procurement with sustainability compliance mandates. In a measurable demonstration of this strategic shift, manufacturing plants utilizing modern storage configurations have achieved a 28% improvement in localized power reliability compared to traditional operational models.
  • This enhancement radically alters production continuity and minimizes downtime related revenue losses. To counteract safety hazards and hardware degradation, engineers are prioritizing highly scalable chemistries that deliver extended lifecycles. By embedding resilient architectures into their core infrastructure, heavy industries are fundamentally transforming how they approach long term asset risk mitigation, ensuring robust operational continuity in an increasingly decentralized energy ecosystem.

What are the Key Data Covered in this Solar Energy Storage Market Research and Growth Report?

  • What is the expected growth of the Solar Energy Storage Market between 2026 and 2030?

    • USD 8.34 billion, at a CAGR of 10.2%

  • What segmentation does the market report cover?

    • The report is segmented by End-user (Utilities, Residential, and Commercial and industrial), Installation Sites (On-grid, and Off-grid), Type (Lithium ion, Lead acid, Flow battery, and Others) and Geography (APAC, North America, Europe, Middle East and Africa, South America)

  • Which regions are analyzed in the report?

    • APAC, North America, Europe, Middle East and Africa and South America

  • What are the key growth drivers and market challenges?

    • Increasing penetration of renewable energy and grid stability requirements, Supply chain vulnerabilities and material constraints

  • Who are the major players in the Solar Energy Storage Market?

    • Alpha ESS Co. Ltd., BYD Co. Ltd., Canadian Solar Inc., Enphase Energy Inc., FOXESS CO. LTD., Generac Power Systems Inc., GoodWe Technologies Co. Ltd., Growatt New Energy, Hanwha Q Cells America Inc., Huawei Technologies Co. Ltd., LG Energy Solution Ltd., Panasonic Holdings Corp., SENEC GmbH, SMA Solar Technology AG, SolarEdge Technologies Inc., Sonnen GmbH, Sungrow Power Supply Co. Ltd., Tesla Inc. and VARTA AG

Market Research Insights

  • The Solar Energy Storage Market is fundamentally restructuring industrial power procurement through the accelerated deployment of integrated capacity solutions. By incorporating advanced storage systems, manufacturing facilities have enhanced operational resilience, experiencing a 25% improvement in continuous uptime during regional outages.
  • Furthermore, the strategic application of energy trading algorithms has allowed independent power producers to increase revenue capture by 18% during peak pricing intervals. The implementation of stringent environmental policies requires utilities to offset fossil fuel generation, driving a 30% rise in the adoption of extended duration storage technologies.
  • This transition empowers grid operators to optimize grid frequencies and minimize transmission constraints, permanently altering the economics of renewable power integration.

We can help! Our analysts can customize this solar energy storage market research report to meet your requirements.

Get in touch

1. Executive Summary

1.1 Market overview

Executive Summary - Chart on Market Overview
Executive Summary - Data Table on Market Overview
Executive Summary - Chart on Global Market Characteristics
Executive Summary - Chart on Market by Geography
Executive Summary - Chart on Market Segmentation by End-user
Executive Summary - Chart on Market Segmentation by Installation Sites
Executive Summary - Chart on Market Segmentation by Type
Executive Summary - Chart on Incremental Growth
Executive Summary - Data Table on Incremental Growth
Executive Summary - Chart on Company Market Positioning

2. Technavio Analysis

2.1 Analysis of price sensitivity, lifecycle, customer purchase basket, adoption rates, and purchase criteria

2.2 Criticality of inputs and Factors of differentiation

Chart on Overview on criticality of inputs and factors of differentiation

2.3 Factors of disruption

Chart on Overview on factors of disruption

2.4 Impact of drivers and challenges

Chart on Impact of drivers and challenges in 2025 and 2030

3. Market Landscape

3.1 Market ecosystem

Chart on Parent Market
Data Table on - Parent Market

3.2 Market characteristics

Chart on Market characteristics analysis

3.3 Value chain analysis

Chart on Value chain analysis

4. Market Sizing

4.1 Market definition

Data Table on Offerings of companies included in the market definition

4.2 Market segment analysis

Market segments

4.3 Market size 2025

4.4 Market outlook: Forecast for 2025-2030

Chart on Global - Market size and forecast 2025-2030 ($ million)
Data Table on Global - Market size and forecast 2025-2030 ($ million)
Chart on Global Market: Year-over-year growth 2025-2030 (%)
Data Table on Global Market: Year-over-year growth 2025-2030 (%)

5. Historic Market Size

5.1 Global Solar Energy Storage Market 2020 - 2024

Historic Market Size - Data Table on Global Solar Energy Storage Market 2020 - 2024 ($ million)

5.2 End-user segment analysis 2020 - 2024

Historic Market Size - End-user Segment 2020 - 2024 ($ million)

5.3 Installation Sites segment analysis 2020 - 2024

Historic Market Size - Installation Sites Segment 2020 - 2024 ($ million)

5.4 Type segment analysis 2020 - 2024

Historic Market Size - Type Segment 2020 - 2024 ($ million)

5.5 Geography segment analysis 2020 - 2024

Historic Market Size - Geography Segment 2020 - 2024 ($ million)

5.6 Country segment analysis 2020 - 2024

Historic Market Size - Country Segment 2020 - 2024 ($ million)

6. Qualitative Analysis

6.1 Impact of AI on Global Solar Energy Storage Market

6.2 Impact of Geopolitical Conflicts on Global Solar Energy Storage Market

7. Five Forces Analysis

7.1 Five forces summary

Five forces analysis - Comparison between 2025 and 2030

7.2 Bargaining power of buyers

Bargaining power of buyers - Impact of key factors 2025 and 2030

7.3 Bargaining power of suppliers

Bargaining power of suppliers - Impact of key factors in 2025 and 2030

7.4 Threat of new entrants

Threat of new entrants - Impact of key factors in 2025 and 2030

7.5 Threat of substitutes

Threat of substitutes - Impact of key factors in 2025 and 2030

7.6 Threat of rivalry

Threat of rivalry - Impact of key factors in 2025 and 2030

7.7 Market condition

Chart on Market condition - Five forces 2025 and 2030

8. Market Segmentation by End-user

8.1 Market segments

Chart on End-user - Market share 2025-2030 (%)
Data Table on End-user - Market share 2025-2030 (%)

8.2 Comparison by End-user

Chart on Comparison by End-user
Data Table on Comparison by End-user

8.3 Utilities - Market size and forecast 2025-2030

Chart on Utilities - Market size and forecast 2025-2030 ($ million)
Data Table on Utilities - Market size and forecast 2025-2030 ($ million)
Chart on Utilities - Year-over-year growth 2025-2030 (%)
Data Table on Utilities - Year-over-year growth 2025-2030 (%)

8.4 Residential - Market size and forecast 2025-2030

Chart on Residential - Market size and forecast 2025-2030 ($ million)
Data Table on Residential - Market size and forecast 2025-2030 ($ million)
Chart on Residential - Year-over-year growth 2025-2030 (%)
Data Table on Residential - Year-over-year growth 2025-2030 (%)

8.5 Commercial and industrial - Market size and forecast 2025-2030

Chart on Commercial and industrial - Market size and forecast 2025-2030 ($ million)
Data Table on Commercial and industrial - Market size and forecast 2025-2030 ($ million)
Chart on Commercial and industrial - Year-over-year growth 2025-2030 (%)
Data Table on Commercial and industrial - Year-over-year growth 2025-2030 (%)

8.6 Market opportunity by End-user

Market opportunity by End-user ($ million)
Data Table on Market opportunity by End-user ($ million)

9. Market Segmentation by Installation Sites

9.1 Market segments

Chart on Installation Sites - Market share 2025-2030 (%)
Data Table on Installation Sites - Market share 2025-2030 (%)

9.2 Comparison by Installation Sites

Chart on Comparison by Installation Sites
Data Table on Comparison by Installation Sites

9.3 On-grid - Market size and forecast 2025-2030

Chart on On-grid - Market size and forecast 2025-2030 ($ million)
Data Table on On-grid - Market size and forecast 2025-2030 ($ million)
Chart on On-grid - Year-over-year growth 2025-2030 (%)
Data Table on On-grid - Year-over-year growth 2025-2030 (%)

9.4 Off-grid - Market size and forecast 2025-2030

Chart on Off-grid - Market size and forecast 2025-2030 ($ million)
Data Table on Off-grid - Market size and forecast 2025-2030 ($ million)
Chart on Off-grid - Year-over-year growth 2025-2030 (%)
Data Table on Off-grid - Year-over-year growth 2025-2030 (%)

9.5 Market opportunity by Installation Sites

Market opportunity by Installation Sites ($ million)
Data Table on Market opportunity by Installation Sites ($ million)

10. Market Segmentation by Type

10.1 Market segments

Chart on Type - Market share 2025-2030 (%)
Data Table on Type - Market share 2025-2030 (%)

10.2 Comparison by Type

Chart on Comparison by Type
Data Table on Comparison by Type

10.3 Lithium ion - Market size and forecast 2025-2030

Chart on Lithium ion - Market size and forecast 2025-2030 ($ million)
Data Table on Lithium ion - Market size and forecast 2025-2030 ($ million)
Chart on Lithium ion - Year-over-year growth 2025-2030 (%)
Data Table on Lithium ion - Year-over-year growth 2025-2030 (%)

10.4 Lead acid - Market size and forecast 2025-2030

Chart on Lead acid - Market size and forecast 2025-2030 ($ million)
Data Table on Lead acid - Market size and forecast 2025-2030 ($ million)
Chart on Lead acid - Year-over-year growth 2025-2030 (%)
Data Table on Lead acid - Year-over-year growth 2025-2030 (%)

10.5 Flow battery - Market size and forecast 2025-2030

Chart on Flow battery - Market size and forecast 2025-2030 ($ million)
Data Table on Flow battery - Market size and forecast 2025-2030 ($ million)
Chart on Flow battery - Year-over-year growth 2025-2030 (%)
Data Table on Flow battery - Year-over-year growth 2025-2030 (%)

10.6 Others - Market size and forecast 2025-2030

Chart on Others - Market size and forecast 2025-2030 ($ million)
Data Table on Others - Market size and forecast 2025-2030 ($ million)
Chart on Others - Year-over-year growth 2025-2030 (%)
Data Table on Others - Year-over-year growth 2025-2030 (%)

10.7 Market opportunity by Type

Market opportunity by Type ($ million)
Data Table on Market opportunity by Type ($ million)

11. Customer Landscape

11.1 Customer landscape overview

Analysis of price sensitivity, lifecycle, customer purchase basket, adoption rates, and purchase criteria

12. Geographic Landscape

12.1 Geographic segmentation

Chart on Market share by geography 2025-2030 (%)
Data Table on Market share by geography 2025-2030 (%)

12.2 Geographic comparison

Chart on Geographic comparison
Data Table on Geographic comparison

12.3 APAC - Market size and forecast 2025-2030

Chart on APAC - Market size and forecast 2025-2030 ($ million)
Data Table on APAC - Market size and forecast 2025-2030 ($ million)
Chart on APAC - Year-over-year growth 2025-2030 (%)
Data Table on APAC - Year-over-year growth 2025-2030 (%)
Chart on Regional Comparison - APAC
Data Table on Regional Comparison - APAC

12.3.1 China - Market size and forecast 2025-2030

Chart on China - Market size and forecast 2025-2030 ($ million)
Data Table on China - Market size and forecast 2025-2030 ($ million)
Chart on China - Year-over-year growth 2025-2030 (%)
Data Table on China - Year-over-year growth 2025-2030 (%)

12.3.2 Japan - Market size and forecast 2025-2030

Chart on Japan - Market size and forecast 2025-2030 ($ million)
Data Table on Japan - Market size and forecast 2025-2030 ($ million)
Chart on Japan - Year-over-year growth 2025-2030 (%)
Data Table on Japan - Year-over-year growth 2025-2030 (%)

12.3.3 Australia - Market size and forecast 2025-2030

Chart on Australia - Market size and forecast 2025-2030 ($ million)
Data Table on Australia - Market size and forecast 2025-2030 ($ million)
Chart on Australia - Year-over-year growth 2025-2030 (%)
Data Table on Australia - Year-over-year growth 2025-2030 (%)

12.3.4 India - Market size and forecast 2025-2030

Chart on India - Market size and forecast 2025-2030 ($ million)
Data Table on India - Market size and forecast 2025-2030 ($ million)
Chart on India - Year-over-year growth 2025-2030 (%)
Data Table on India - Year-over-year growth 2025-2030 (%)

12.3.5 South Korea - Market size and forecast 2025-2030

Chart on South Korea - Market size and forecast 2025-2030 ($ million)
Data Table on South Korea - Market size and forecast 2025-2030 ($ million)
Chart on South Korea - Year-over-year growth 2025-2030 (%)
Data Table on South Korea - Year-over-year growth 2025-2030 (%)

12.3.6 Singapore - Market size and forecast 2025-2030

Chart on Singapore - Market size and forecast 2025-2030 ($ million)
Data Table on Singapore - Market size and forecast 2025-2030 ($ million)
Chart on Singapore - Year-over-year growth 2025-2030 (%)
Data Table on Singapore - Year-over-year growth 2025-2030 (%)

12.4 North America - Market size and forecast 2025-2030

Chart on North America - Market size and forecast 2025-2030 ($ million)
Data Table on North America - Market size and forecast 2025-2030 ($ million)
Chart on North America - Year-over-year growth 2025-2030 (%)
Data Table on North America - Year-over-year growth 2025-2030 (%)
Chart on Regional Comparison - North America
Data Table on Regional Comparison - North America

12.4.1 US - Market size and forecast 2025-2030

Chart on US - Market size and forecast 2025-2030 ($ million)
Data Table on US - Market size and forecast 2025-2030 ($ million)
Chart on US - Year-over-year growth 2025-2030 (%)
Data Table on US - Year-over-year growth 2025-2030 (%)

12.4.2 Canada - Market size and forecast 2025-2030

Chart on Canada - Market size and forecast 2025-2030 ($ million)
Data Table on Canada - Market size and forecast 2025-2030 ($ million)
Chart on Canada - Year-over-year growth 2025-2030 (%)
Data Table on Canada - Year-over-year growth 2025-2030 (%)

12.4.3 Mexico - Market size and forecast 2025-2030

Chart on Mexico - Market size and forecast 2025-2030 ($ million)
Data Table on Mexico - Market size and forecast 2025-2030 ($ million)
Chart on Mexico - Year-over-year growth 2025-2030 (%)
Data Table on Mexico - Year-over-year growth 2025-2030 (%)

12.5 Europe - Market size and forecast 2025-2030

Chart on Europe - Market size and forecast 2025-2030 ($ million)
Data Table on Europe - Market size and forecast 2025-2030 ($ million)
Chart on Europe - Year-over-year growth 2025-2030 (%)
Data Table on Europe - Year-over-year growth 2025-2030 (%)
Chart on Regional Comparison - Europe
Data Table on Regional Comparison - Europe

12.5.1 Germany - Market size and forecast 2025-2030

Chart on Germany - Market size and forecast 2025-2030 ($ million)
Data Table on Germany - Market size and forecast 2025-2030 ($ million)
Chart on Germany - Year-over-year growth 2025-2030 (%)
Data Table on Germany - Year-over-year growth 2025-2030 (%)

12.5.2 UK - Market size and forecast 2025-2030

Chart on UK - Market size and forecast 2025-2030 ($ million)
Data Table on UK - Market size and forecast 2025-2030 ($ million)
Chart on UK - Year-over-year growth 2025-2030 (%)
Data Table on UK - Year-over-year growth 2025-2030 (%)

12.5.3 Italy - Market size and forecast 2025-2030

Chart on Italy - Market size and forecast 2025-2030 ($ million)
Data Table on Italy - Market size and forecast 2025-2030 ($ million)
Chart on Italy - Year-over-year growth 2025-2030 (%)
Data Table on Italy - Year-over-year growth 2025-2030 (%)

12.5.4 Spain - Market size and forecast 2025-2030

Chart on Spain - Market size and forecast 2025-2030 ($ million)
Data Table on Spain - Market size and forecast 2025-2030 ($ million)
Chart on Spain - Year-over-year growth 2025-2030 (%)
Data Table on Spain - Year-over-year growth 2025-2030 (%)

12.5.5 France - Market size and forecast 2025-2030

Chart on France - Market size and forecast 2025-2030 ($ million)
Data Table on France - Market size and forecast 2025-2030 ($ million)
Chart on France - Year-over-year growth 2025-2030 (%)
Data Table on France - Year-over-year growth 2025-2030 (%)

12.5.6 The Netherlands - Market size and forecast 2025-2030

Chart on The Netherlands - Market size and forecast 2025-2030 ($ million)
Data Table on The Netherlands - Market size and forecast 2025-2030 ($ million)
Chart on The Netherlands - Year-over-year growth 2025-2030 (%)
Data Table on The Netherlands - Year-over-year growth 2025-2030 (%)

12.6 Middle East and Africa - Market size and forecast 2025-2030

Chart on Middle East and Africa - Market size and forecast 2025-2030 ($ million)
Data Table on Middle East and Africa - Market size and forecast 2025-2030 ($ million)
Chart on Middle East and Africa - Year-over-year growth 2025-2030 (%)
Data Table on Middle East and Africa - Year-over-year growth 2025-2030 (%)
Chart on Regional Comparison - Middle East and Africa
Data Table on Regional Comparison - Middle East and Africa

12.6.1 Saudi Arabia - Market size and forecast 2025-2030

Chart on Saudi Arabia - Market size and forecast 2025-2030 ($ million)
Data Table on Saudi Arabia - Market size and forecast 2025-2030 ($ million)
Chart on Saudi Arabia - Year-over-year growth 2025-2030 (%)
Data Table on Saudi Arabia - Year-over-year growth 2025-2030 (%)

12.6.2 UAE - Market size and forecast 2025-2030

Chart on UAE - Market size and forecast 2025-2030 ($ million)
Data Table on UAE - Market size and forecast 2025-2030 ($ million)
Chart on UAE - Year-over-year growth 2025-2030 (%)
Data Table on UAE - Year-over-year growth 2025-2030 (%)

12.6.3 South Africa - Market size and forecast 2025-2030

Chart on South Africa - Market size and forecast 2025-2030 ($ million)
Data Table on South Africa - Market size and forecast 2025-2030 ($ million)
Chart on South Africa - Year-over-year growth 2025-2030 (%)
Data Table on South Africa - Year-over-year growth 2025-2030 (%)

12.6.4 Israel - Market size and forecast 2025-2030

Chart on Israel - Market size and forecast 2025-2030 ($ million)
Data Table on Israel - Market size and forecast 2025-2030 ($ million)
Chart on Israel - Year-over-year growth 2025-2030 (%)
Data Table on Israel - Year-over-year growth 2025-2030 (%)

12.6.5 Egypt - Market size and forecast 2025-2030

Chart on Egypt - Market size and forecast 2025-2030 ($ million)
Data Table on Egypt - Market size and forecast 2025-2030 ($ million)
Chart on Egypt - Year-over-year growth 2025-2030 (%)
Data Table on Egypt - Year-over-year growth 2025-2030 (%)

12.7 South America - Market size and forecast 2025-2030

Chart on South America - Market size and forecast 2025-2030 ($ million)
Data Table on South America - Market size and forecast 2025-2030 ($ million)
Chart on South America - Year-over-year growth 2025-2030 (%)
Data Table on South America - Year-over-year growth 2025-2030 (%)
Chart on Regional Comparison - South America
Data Table on Regional Comparison - South America

12.7.1 Brazil - Market size and forecast 2025-2030

Chart on Brazil - Market size and forecast 2025-2030 ($ million)
Data Table on Brazil - Market size and forecast 2025-2030 ($ million)
Chart on Brazil - Year-over-year growth 2025-2030 (%)
Data Table on Brazil - Year-over-year growth 2025-2030 (%)

12.7.2 Chile - Market size and forecast 2025-2030

Chart on Chile - Market size and forecast 2025-2030 ($ million)
Data Table on Chile - Market size and forecast 2025-2030 ($ million)
Chart on Chile - Year-over-year growth 2025-2030 (%)
Data Table on Chile - Year-over-year growth 2025-2030 (%)

12.7.3 Argentina - Market size and forecast 2025-2030

Chart on Argentina - Market size and forecast 2025-2030 ($ million)
Data Table on Argentina - Market size and forecast 2025-2030 ($ million)
Chart on Argentina - Year-over-year growth 2025-2030 (%)
Data Table on Argentina - Year-over-year growth 2025-2030 (%)

12.8 Market opportunity by geography

Market opportunity by geography ($ million)
Data Tables on Market opportunity by geography ($ million)

13. Drivers, Challenges, and Opportunity

13.1 Market drivers

Increasing penetration of renewable energy and grid stability requirements
Declining costs and technological advancements in battery storage
Supportive government policies and decarbonization mandates

13.2 Market challenges

Supply chain vulnerabilities and material constraints
Regulatory and market design hurdles
High initial costs and economic viability

13.3 Impact of drivers and challenges

Impact of drivers and challenges in 2025 and 2030

13.4 Market opportunities

Shift toward long-duration storage solutions
Integration of AI and advanced energy management
Diversification of battery chemistries beyond lithium-ion

14. Competitive Landscape

14.1 Overview

14.2

Overview on criticality of inputs and factors of differentiation

14.3 Landscape disruption

Overview on factors of disruption

14.4 Industry risks

Impact of key risks on business

15. Competitive Analysis

15.1 Companies profiled

Companies covered

15.2 Company ranking index

15.3 Market positioning of companies

Matrix on companies position and classification

15.4 Alpha ESS Co. Ltd.

Alpha ESS Co. Ltd. - Overview
Alpha ESS Co. Ltd. - Product / Service
Alpha ESS Co. Ltd. - Key offerings
SWOT

15.5 BYD Co. Ltd.

BYD Co. Ltd. - Overview
BYD Co. Ltd. - Business segments
BYD Co. Ltd. - Key news
BYD Co. Ltd. - Key offerings
BYD Co. Ltd. - Segment focus
SWOT

15.6 Canadian Solar Inc.

Canadian Solar Inc. - Overview
Canadian Solar Inc. - Business segments
Canadian Solar Inc. - Key offerings
Canadian Solar Inc. - Segment focus
SWOT

15.7 Enphase Energy Inc.

Enphase Energy Inc. - Overview
Enphase Energy Inc. - Product / Service
Enphase Energy Inc. - Key news
Enphase Energy Inc. - Key offerings
SWOT

15.8 Generac Power Systems Inc.

Generac Power Systems Inc. - Overview
Generac Power Systems Inc. - Business segments
Generac Power Systems Inc. - Key news
Generac Power Systems Inc. - Key offerings
Generac Power Systems Inc. - Segment focus
SWOT

15.9 GoodWe Technologies Co. Ltd.

GoodWe Technologies Co. Ltd. - Overview
GoodWe Technologies Co. Ltd. - Product / Service
GoodWe Technologies Co. Ltd. - Key offerings
SWOT

15.10 Growatt New Energy

Growatt New Energy - Overview
Growatt New Energy - Product / Service
Growatt New Energy - Key offerings
SWOT

15.11 Hanwha Q Cells America Inc.

Hanwha Q Cells America Inc. - Overview
Hanwha Q Cells America Inc. - Product / Service
Hanwha Q Cells America Inc. - Key offerings
SWOT

15.12 LG Energy Solution Ltd.

LG Energy Solution Ltd. - Overview
LG Energy Solution Ltd. - Product / Service
LG Energy Solution Ltd. - Key news
LG Energy Solution Ltd. - Key offerings
SWOT

15.13 Panasonic Holdings Corp.

Panasonic Holdings Corp. - Overview
Panasonic Holdings Corp. - Business segments
Panasonic Holdings Corp. - Key news
Panasonic Holdings Corp. - Key offerings
Panasonic Holdings Corp. - Segment focus
SWOT

15.14 SMA Solar Technology AG

SMA Solar Technology AG - Overview
SMA Solar Technology AG - Business segments
SMA Solar Technology AG - Key offerings
SMA Solar Technology AG - Segment focus
SWOT

15.15 SolarEdge Technologies Inc.

SolarEdge Technologies Inc. - Overview
SolarEdge Technologies Inc. - Product / Service
SolarEdge Technologies Inc. - Key offerings
SWOT

15.16 Sungrow Power Supply Co. Ltd.

Sungrow Power Supply Co. Ltd. - Overview
Sungrow Power Supply Co. Ltd. - Product / Service
Sungrow Power Supply Co. Ltd. - Key offerings
SWOT

15.17 Tesla Inc.

Tesla Inc. - Overview
Tesla Inc. - Business segments
Tesla Inc. - Key offerings
Tesla Inc. - Segment focus
SWOT

15.18 VARTA AG

VARTA AG - Overview
VARTA AG - Business segments
VARTA AG - Key news
VARTA AG - Key offerings
VARTA AG - Segment focus
SWOT

16. Appendix

16.1 Scope of the report

Market definition
Objectives
Notes and caveats

16.2 Inclusions and exclusions checklist

Inclusions checklist
Exclusions checklist

16.3 Currency conversion rates for US$

16.4 Research methodology

16.5 Data procurement

Information sources

16.6 Data validation

16.7 Validation techniques employed for market sizing

16.8 Data synthesis

16.9 360 degree market analysis

16.10 List of abbreviations

Research Methodology

Technavio presents a detailed picture of the market by way of study, synthesis, and summation of data from multiple sources. The analysts have presented the various facets of the market with a particular focus on identifying the key industry influencers. The data thus presented is comprehensive, reliable, and the result of extensive research, both primary and secondary.

INFORMATION SOURCES

Primary sources

  • Manufacturers and suppliers
  • Channel partners
  • Industry experts
  • Strategic decision makers

Secondary sources

  • Industry journals and periodicals
  • Government data
  • Financial reports of key industry players
  • Historical data
  • Press releases

DATA ANALYSIS

Data Synthesis

  • Collation of data
  • Estimation of key figures
  • Analysis of derived insights

Data Validation

  • Triangulation with data models
  • Reference against proprietary databases
  • Corroboration with industry experts

REPORT WRITING

Qualitative

  • Market drivers
  • Market challenges
  • Market trends
  • Five forces analysis

Quantitative

  • Market size and forecast
  • Market segmentation
  • Geographical insights
  • Competitive landscape

Interested in this report?

Get your sample now to see our research methodology and insights!

Download Now

Frequently Asked Questions

Solar Energy Storage market growth will increase by USD 8335.6 million during 2026-2030.

The Solar Energy Storage market is expected to grow at a CAGR of 10.2% during 2026-2030.

Solar Energy Storage market is segmented by End-user (Utilities, Residential, Commercial and industrial) Installation sites (On-grid, Off-grid) Type (Lithium ion, Lead acid, Flow battery, Others)

Alpha ESS Co. Ltd., BYD Co. Ltd., Canadian Solar Inc., Enphase Energy Inc., FOXESS CO. LTD., Generac Power Systems Inc., GoodWe Technologies Co. Ltd., Growatt New Energy, Hanwha Q Cells America Inc., Huawei Technologies Co. Ltd., LG Energy Solution Ltd., Panasonic Holdings Corp., SENEC GmbH, SMA Solar Technology AG, SolarEdge Technologies Inc., Sonnen GmbH, Sungrow Power Supply Co. Ltd., Tesla Inc., VARTA AG are a few of the key vendors in the Solar Energy Storage market.

APAC will register the highest growth rate of 59.9% among the other regions. Therefore, the Solar Energy Storage market in APAC is expected to garner significant business opportunities for the vendors during the forecast period.

China, Japan, Australia, India, South Korea, Singapore, US, Canada, Mexico, Germany, UK, Italy, Spain, France, The Netherlands, Saudi Arabia, UAE, South Africa, Israel, Egypt, Brazil, Chile, Argentina

  • Increasing penetration of renewable energy and grid stability requirements is the driving factor this market.

The Solar Energy Storage market vendors should focus on grabbing business opportunities from the End-user segment as it accounted for the largest market share in the base year.
RIA - Research AI Assistant
Ask RIA
