Solar Photovoltaic (PV) Market Analysis, Size, and Forecast 2026-2030: APAC (China, India, and Japan), Europe (Germany, Spain, and Italy), North America (US, Canada, and Mexico), Middle East and Africa (Saudi Arabia, UAE, and South Africa), South America (Brazil and Argentina), and Rest of World (ROW)

Solar Photovoltaic (PV) Market Analysis, Size, and Forecast 2026-2030:
APAC (China, India, and Japan), Europe (Germany, Spain, and Italy), North America (US, Canada, and Mexico), Middle East and Africa (Saudi Arabia, UAE, and South Africa), South America (Brazil and Argentina), and Rest of World (ROW)

Published: Apr 2026 285 Pages SKU: IRTNTR75509

Market Overview at a Glance

$65.98 B
Market Opportunity
9.2%
CAGR 2025 - 2030
45.2%
APAC Growth
$60.31 B
Ground-mounted segment 2024

Solar Photovoltaic (PV) Market Size 2026-2030

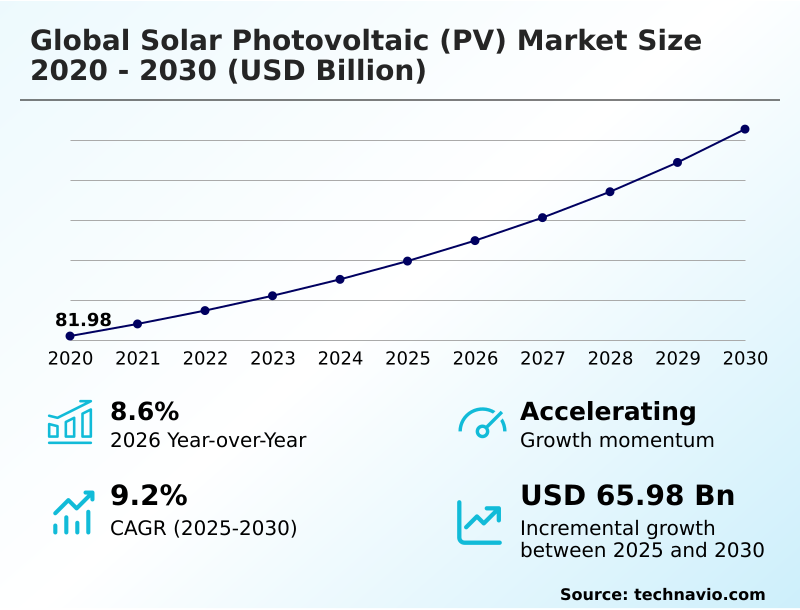
The solar photovoltaic (pv) market size is valued to increase by USD 65.98 billion, at a CAGR of 9.2% from 2025 to 2030. Technological innovation and commercialization of high efficiency cell architectures will drive the solar photovoltaic (pv) market.

Major Market Trends & Insights

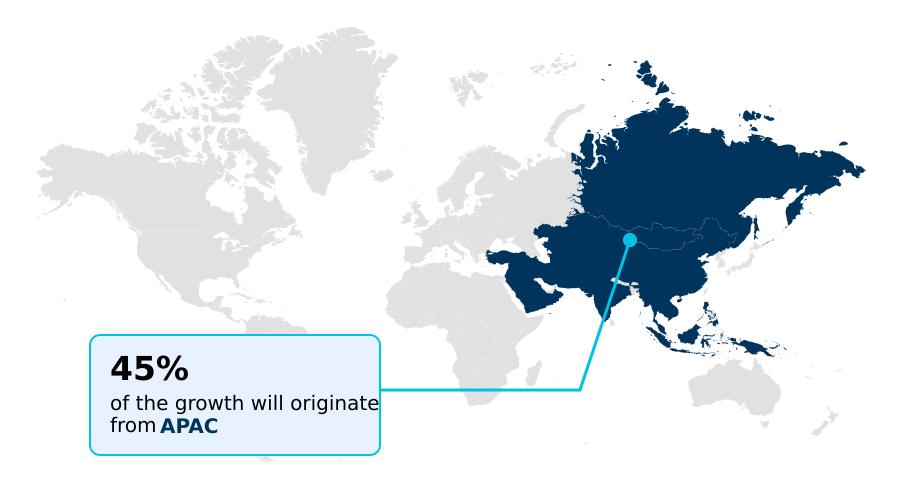
  • APAC dominated the market and accounted for a 45.2% growth during the forecast period.
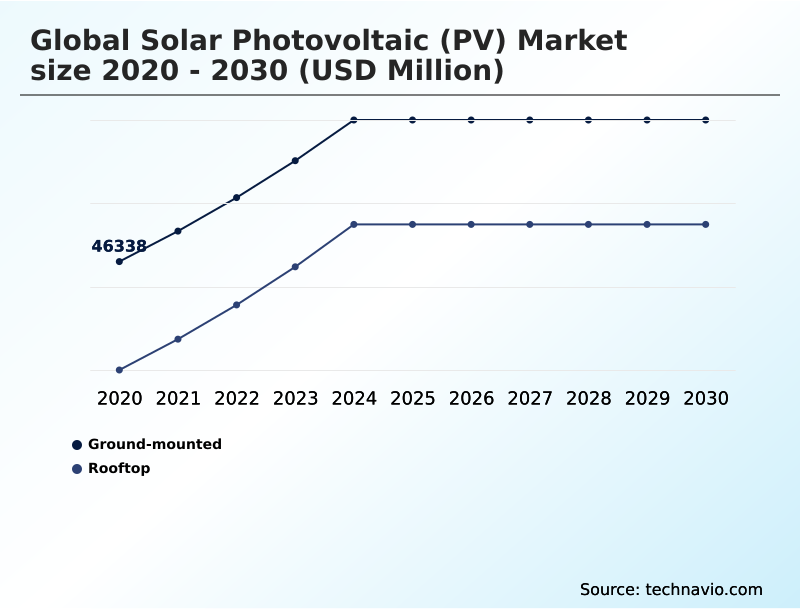
  • By Deployment - Ground-mounted segment was valued at USD 60.31 billion in 2024
  • By End-user - Commercial segment accounted for the largest market revenue share in 2024

Market Size & Forecast

  • Market Opportunities: USD 103.46 billion
  • Market Future Opportunities: USD 65.98 billion
  • CAGR from 2025 to 2030 : 9.2%

Market Summary

  • The Solar Photovoltaic (PV) Market is undergoing a strategic evolution, moving beyond simple capacity expansion to focus on technological sophistication and lifecycle value. This shift is driven by the rapid commercialization of advanced module architecture, such as tunnel oxide passivated contact (TOPCon) and heterojunction technology, which significantly boosts energy yields.
  • A dominant trend is the integration of solar plus storage systems to provide grid stability solutions and ensure energy independence for commercial and industrial users. For instance, a manufacturing facility can deploy an on-site solar array with batteries to mitigate production losses during grid outages and reduce electricity costs through peak shaving.
  • However, the market contends with significant challenges, including supply chain resilience for materials like high-purity polysilicon and geopolitical tensions influencing domestic content mandates. Success now depends on navigating these complexities while leveraging innovations like building-integrated photovoltaics and automated manufacturing to maintain a competitive edge and support decarbonization pathways.

What will be the Size of the Solar Photovoltaic (PV) Market during the forecast period?

Get Key Insights on Market Forecast (PDF) Request Free Sample

How is the Solar Photovoltaic (PV) Market Segmented?

The solar photovoltaic (pv) industry research report provides comprehensive data (region-wise segment analysis), with forecasts and estimates in "USD million" for the period 2026-2030, as well as historical data from 2020-2024 for the following segments.

  • Deployment
    • Ground-mounted
    • Rooftop
  • End-user
    • Commercial
    • Residential
    • Utility
  • Technology
    • Monocrystalline silicon
    • Polycrystalline silicon
    • Thin-film
    • Bifacial solar panels
    • Others
  • Geography
    • APAC
      • China
      • India
      • Japan
    • Europe
      • Germany
      • Spain
      • Italy
    • North America
      • US
      • Canada
      • Mexico
    • Middle East and Africa
      • Saudi Arabia
      • UAE
      • South Africa
    • South America
      • Brazil
      • Argentina
    • Rest of World (ROW)

By Deployment Insights

The ground-mounted segment is estimated to witness significant growth during the forecast period.

The ground-mounted segment is foundational to utility-scale energy strategies, defined by large solar farms utilizing sophisticated solar trackers to optimize sunlight capture. This segment is increasingly adopting bifacial modules, which improve energy production by up to 15% in high-albedo environments.

A key development is the rise of agrivoltaics, a dual-use approach that integrates solar power generation with agriculture, addressing land-use conflicts. These large installations are critical for providing dispatchable power, often paired with battery storage to enhance grid stability solutions.

The focus remains on maximizing energy yield through advanced module architecture and bifacial solar panels, ensuring these systems serve as the backbone for national renewable energy portfolios and contribute to grid-edge intelligence.

Request Free Sample

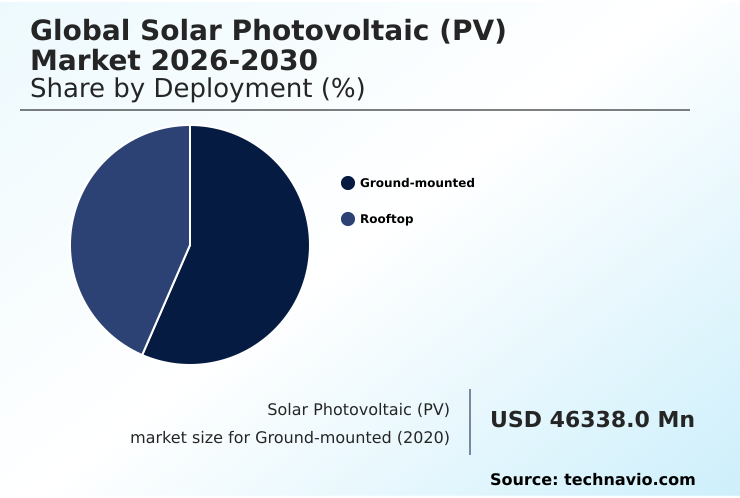
The Ground-mounted segment was valued at USD 60.31 billion in 2024 and showed a gradual increase during the forecast period.

Request Free Sample

Regional Analysis

APAC is estimated to contribute 45.2% to the growth of the global market during the forecast period.Technavio’s analysts have elaborately explained the regional trends and drivers that shape the market during the forecast period.

See How Solar Photovoltaic (PV) Market Demand is Rising in APAC Request Free Sample

The global geographic landscape is diversifying, though APAC remains the market's center of gravity, projected to account for 45.2% of incremental growth.

In this region, nations are focused on achieving energy sovereignty through aggressive domestic content mandates and scaling technologies like floating solar projects. Europe is concentrating on building-integrated photovoltaics and repowering older assets to meet stringent decarbonization pathways.

In North America, the focus is on strengthening domestic manufacturing to improve energy security mandates and reduce reliance on complex global supply chains.

Across all regions, the development of green hydrogen production facilities powered by solar is emerging as a critical application, promising to further expand the utility of photovoltaic technology and drive the next wave of investment in the energy transition.

Market Dynamics

Our researchers analyzed the data with 2025 as the base year, along with the key drivers, trends, and challenges. A holistic analysis of drivers will help companies refine their marketing strategies to gain a competitive advantage.

  • Strategic decision-making in the current market requires a deep understanding of evolving technologies and their economic implications. A key consideration is the n-type vs p-type silicon wafer performance, as n-type offers superior longevity and output. Firms are focused on optimizing energy yield with bifacial modules, especially in utility-scale deployments.
  • The impact of silver prices on solar cell manufacturing is forcing innovation in metallization to control costs. Simultaneously, grid integration challenges for utility-scale solar necessitate sophisticated power electronics and smart inverters for grid support functions. A detailed cost-benefit analysis of perovskite tandem cells reveals their potential to disrupt efficiency benchmarks.
  • The role of AI in solar plant predictive maintenance is now standard for reducing operational expenditures, with some operators reporting a 15% reduction in unplanned downtime. Exploring agrivoltaics for dual-use land efficiency is gaining traction in land-scarce regions. Adopting large wafer formats to reduce BOS costs is a critical lever for project economics.
  • Similarly, floating solar projects on man-made reservoirs open new deployment frontiers. The advantages of heterojunction technology for enhanced bifaciality and TOPCon in high-temperature climates guide technology selection.
  • Other critical long-term strategies include deploying solar plus storage for firm power generation, reducing light-induced degradation in PV modules, ensuring supply chain diversification for polysilicon, and navigating residential solar ROI with net metering changes.
  • Furthermore, commercial solar adoption for ESG reporting, developing new utility-scale solar project financing models, establishing robust PV module recycling and lifecycle management, utilizing cadmium telluride thin-film for hot climates, and leveraging smart inverters for grid support functions are all vital for sustained success.

What are the key market drivers leading to the rise in the adoption of Solar Photovoltaic (PV) Industry?

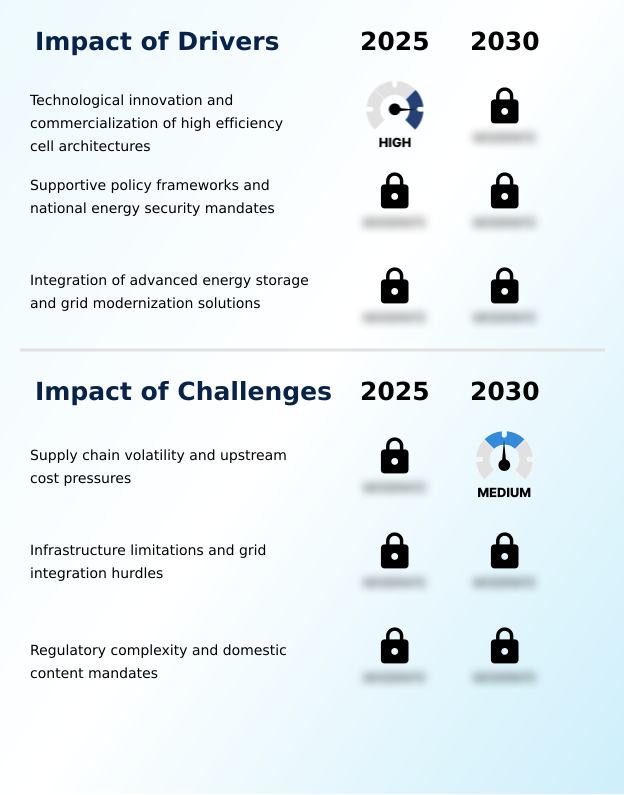
  • Technological innovation and the commercialization of high-efficiency cell architectures are key drivers of market growth.

  • The market's primary driver is the rapid technological evolution from conventional passivated emitter and rear cell designs to superior architectures like tunnel oxide passivated contact.
  • This innovation fundamentally improves the economics of solar, with some systems achieving a 5% higher energy yield in high-temperature conditions.
  • Manufacturers are prioritizing innovations that reduce balance of system costs, such as the adoption of the larger M10 and G12 wafer formats.
  • The integration of artificial intelligence into automated manufacturing facilities allows for real-time quality control, reducing material waste by up to 3%.
  • This focus on efficiency and quality in the production of high-purity polysilicon and silicon ingots provides a robust technical foundation that supports broader adoption across all segments and underpins the bankability of modules for institutional investors.

What are the market trends shaping the Solar Photovoltaic (PV) Industry?

  • A key market trend is the acceleration of high-efficiency n-type cell architectures. This includes the increasing integration of perovskite technology to enhance performance.

  • A dominant trend is the definitive shift toward high-efficiency n-type silicon wafers, which form the basis for next-generation cell designs like heterojunction technology. This transition is delivering higher lifetime energy yields, with modern module architecture reducing performance degradation rates by over 10% compared to older p-type technologies.
  • The market is also seeing early commercialization of perovskite silicon tandem cells, which are designed to surpass the efficiency limits of conventional single-junction silicon cells. This innovation is critical for the energy transition, particularly in space-constrained applications.
  • Further, the adoption of advanced cell stringing processes and automated manufacturing has improved production throughput by 15%, lowering the overall levelized cost of electricity and accelerating the displacement of conventional power sources.

What challenges does the Solar Photovoltaic (PV) Industry face during its growth?

  • Supply chain volatility and upstream cost pressures represent a key challenge affecting the industry's growth trajectory.

  • The market is navigating significant structural imbalances, where systemic supply chain volatility presents a greater challenge than technology adoption. Despite advancements, acute overcapacity in polysilicon production contrasts sharply with rising upstream cost pressures for critical materials like silver conductive paste.
  • Geopolitical friction, evidenced by countervailing duty actions, disrupts procurement and can increase project costs by over 20% if developers are forced to source from higher-cost domestic suppliers. This inability to secure long-term pricing for raw materials creates a high-risk environment and threatens the pace of deployment required to meet decarbonization pathways.
  • Consequently, the industry focus has shifted toward disciplined inventory management and enhancing supply chain resilience to ensure financial stability.

Exclusive Technavio Analysis on Customer Landscape

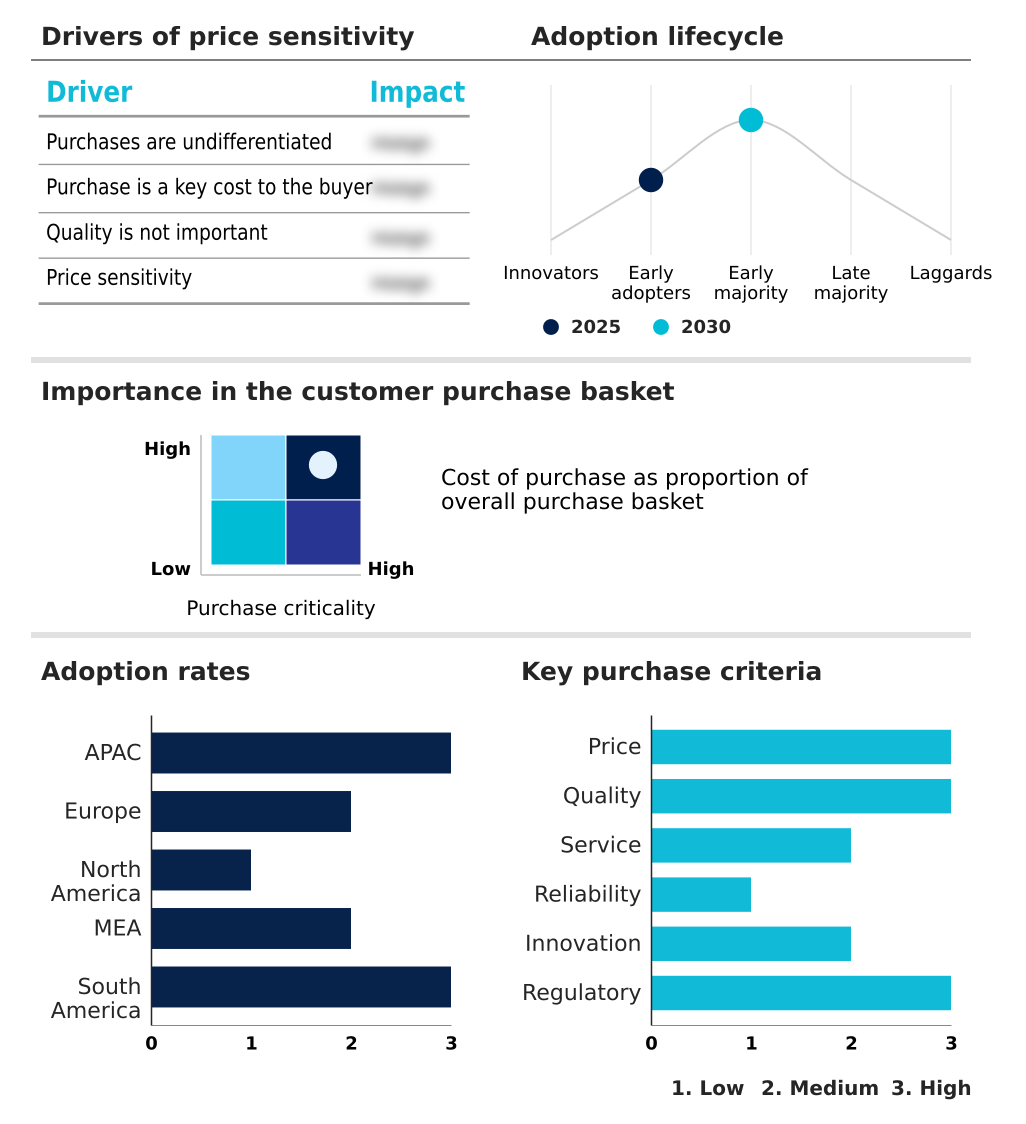
The solar photovoltaic (pv) market forecasting report includes the adoption lifecycle of the market, covering from the innovator’s stage to the laggard’s stage. It focuses on adoption rates in different regions based on penetration. Furthermore, the solar photovoltaic (pv) market report also includes key purchase criteria and drivers of price sensitivity to help companies evaluate and develop their market growth analysis strategies.

Customer Landscape of Solar Photovoltaic (PV) Industry

Competitive Landscape

Companies are implementing various strategies, such as strategic alliances, solar photovoltaic (pv) market forecast, partnerships, mergers and acquisitions, geographical expansion, and product/service launches, to enhance their presence in the industry.

Adani Solar - Delivers integrated solar solutions, from high-efficiency modules to full EPC services, addressing complex energy infrastructure requirements.

The industry research and growth report includes detailed analyses of the competitive landscape of the market and information about key companies, including:

  • Adani Solar
  • AE Solar GmbH
  • Astronergy Co Ltd
  • Bauer Solar GmbH
  • Canadian Solar Inc.
  • First Solar Inc.
  • GAF Materials LLC
  • HELIENE Inc.
  • Huasun Energy Co Ltd
  • JA Solar Technology Co. Ltd.
  • JinkoSolar Holding Co. Ltd.
  • LONGi Green Energy Co. Ltd.
  • Maxeon Solar Technologies Ltd.
  • Shanghai AIKO Energy Co Ltd.
  • Talesun Solar Technologies
  • Trina Solar Co. Ltd.
  • Yingli Solar

Qualitative and quantitative analysis of companies has been conducted to help clients understand the wider business environment as well as the strengths and weaknesses of key industry players. Data is qualitatively analyzed to categorize companies as pure play, category-focused, industry-focused, and diversified; it is quantitatively analyzed to categorize companies as dominant, leading, strong, tentative, and weak.

Recent Development and News in Solar photovoltaic (pv) market

  • In March 2025, RenewSys operationalized a 3 GW fully automated solar module manufacturing facility in Maharashtra, India, leveraging artificial intelligence for real-time quality control and production optimization.
  • In February 2025, the United States Department of Commerce established a preliminary countervailing duty of 125.87% on solar cell and module imports from India, highlighting intensifying trade protectionism in the sector.
  • In November 2024, HoloSolis secured over $255.2 million in funding to construct one of Europe's largest solar panel factories in France, aiming to bolster regional energy sovereignty.
  • In January 2025, Cosmic PV Power commenced operations at its 1.6 GW solar module production line in Surat, India, utilizing advanced G12R cell technology to enhance module power output and meet rising domestic demand.

Dive into Technavio’s robust research methodology, blending expert interviews, extensive data synthesis, and validated models for unparalleled Solar Photovoltaic (PV) Market insights. See full methodology.

Market Scope
Page number 285
Base year 2025
Historic period 2020-2024
Forecast period 2026-2030
Growth momentum & CAGR Accelerate at a CAGR of 9.2%
Market growth 2026-2030 USD 65978.5 million
Market structure Fragmented
YoY growth 2025-2026(%) 8.6%
Key countries China, India, Japan, Australia, South Korea, Indonesia, Germany, Spain, Italy, France, The Netherlands, UK, US, Canada, Mexico, Saudi Arabia, UAE, South Africa, Egypt, Morocco, Brazil, Chile and Argentina
Competitive landscape Leading Companies, Market Positioning of Companies, Competitive Strategies, and Industry Risks

Request Free Sample

Research Analyst Overview

  • The Solar Photovoltaic (PV) Market is defined by a rapid technological race away from traditional p-type silicon wafers toward advanced n-type silicon wafers, which significantly reduce light-induced degradation. The manufacturing of monocrystalline silicon via the Czochralski process is enabling complex module architecture. This includes passivated emitter and rear cell (PERC), advanced tunnel oxide passivated contact (TOPCon), and high-performance heterojunction technology.
  • These innovations, alongside developments in polycrystalline silicon and cadmium telluride thin-film, are pushing the boundaries of single-junction silicon cells. The industry is also seeing wider adoption of bifacial solar panels and bifacial modules, which can increase energy yield by over 20% in optimal conditions.
  • This shift is critical for boardroom decisions related to capital investment in new production lines for M10 wafer format and G12 wafer format systems, which are becoming standard. Key components like solar PV inverters and solar trackers are being integrated with grid-edge intelligence, supporting virtual power plants.
  • Strategic investments are also flowing into agrivoltaics, floating solar projects, and building-integrated photovoltaics, diversifying applications. The entire value chain, from high-purity polysilicon, silicon ingots, and wafer manufacturing equipment to the cell stringing process using silver conductive paste, PV backsheets, and PV ribbon material on specialized solar glass, is being optimized.
  • This intense innovation is crucial for competing with advanced geothermal energy and supporting green hydrogen production.

What are the Key Data Covered in this Solar Photovoltaic (PV) Market Research and Growth Report?

  • What is the expected growth of the Solar Photovoltaic (PV) Market between 2026 and 2030?

    • USD 65.98 billion, at a CAGR of 9.2%

  • What segmentation does the market report cover?

    • The report is segmented by Deployment (Ground-mounted, and Rooftop), End-user (Commercial, Residential, and Utility), Technology (Monocrystalline silicon, Polycrystalline silicon, Thin-film, Bifacial solar panels, and Others) and Geography (APAC, Europe, North America, Middle East and Africa, South America)

  • Which regions are analyzed in the report?

    • APAC, Europe, North America, Middle East and Africa and South America

  • What are the key growth drivers and market challenges?

    • Technological innovation and commercialization of high efficiency cell architectures , Supply chain volatility and upstream cost pressures

  • Who are the major players in the Solar Photovoltaic (PV) Market?

    • Adani Solar, AE Solar GmbH, Astronergy Co Ltd, Bauer Solar GmbH, Canadian Solar Inc., First Solar Inc., GAF Materials LLC, HELIENE Inc., Huasun Energy Co Ltd, JA Solar Technology Co. Ltd., JinkoSolar Holding Co. Ltd., LONGi Green Energy Co. Ltd., Maxeon Solar Technologies Ltd., Shanghai AIKO Energy Co Ltd., Talesun Solar Technologies, Trina Solar Co. Ltd. and Yingli Solar

Market Research Insights

  • The market's momentum is defined by a strategic pivot toward enhancing energy security mandates and achieving carbon neutrality. This transition is supported by favorable policies like production-linked incentive schemes, which encourage domestic manufacturing and bolster supply chain resilience.
  • Innovations in solar plus storage are creating dispatchable power assets, crucial for grid stability solutions, while corporate power purchase agreements enable large-scale decarbonization pathways. The adoption of advanced power electronics has improved efficiency by over 5%, directly lowering the levelized cost of electricity.
  • This focus on efficiency and industrial self-consumption is reshaping energy procurement, with an emphasis on the long-term bankability of modules and alignment with environmental, social, and governance (ESG) criteria, reducing reliance on volatile energy markets.

We can help! Our analysts can customize this solar photovoltaic (pv) market research report to meet your requirements.

Get in touch

1. Executive Summary

1.1 Market overview

Executive Summary - Chart on Market Overview
Executive Summary - Data Table on Market Overview
Executive Summary - Chart on Global Market Characteristics
Executive Summary - Chart on Market by Geography
Executive Summary - Chart on Market Segmentation by Deployment
Executive Summary - Chart on Market Segmentation by End-user
Executive Summary - Chart on Market Segmentation by Technology
Executive Summary - Chart on Incremental Growth
Executive Summary - Data Table on Incremental Growth
Executive Summary - Chart on Company Market Positioning

2. Technavio Analysis

2.1 Analysis of price sensitivity, lifecycle, customer purchase basket, adoption rates, and purchase criteria

2.2 Criticality of inputs and Factors of differentiation

Chart on Overview on criticality of inputs and factors of differentiation

2.3 Factors of disruption

Chart on Overview on factors of disruption

2.4 Impact of drivers and challenges

Chart on Impact of drivers and challenges in 2025 and 2030

3. Market Landscape

3.1 Market ecosystem

Chart on Parent Market
Data Table on - Parent Market

3.2 Market characteristics

Chart on Market characteristics analysis

3.3 Value chain analysis

Chart on Value chain analysis

4. Market Sizing

4.1 Market definition

Data Table on Offerings of companies included in the market definition

4.2 Market segment analysis

Market segments

4.3 Market size 2025

4.4 Market outlook: Forecast for 2025-2030

Chart on Global - Market size and forecast 2025-2030 ($ million)
Data Table on Global - Market size and forecast 2025-2030 ($ million)
Chart on Global Market: Year-over-year growth 2025-2030 (%)
Data Table on Global Market: Year-over-year growth 2025-2030 (%)

5. Historic Market Size

5.1 Global Solar Photovoltaic (PV) Market 2020 - 2024

Historic Market Size - Data Table on Global Solar Photovoltaic (PV) Market 2020 - 2024 ($ million)

5.2 Deployment segment analysis 2020 - 2024

Historic Market Size - Deployment Segment 2020 - 2024 ($ million)

5.3 End-user segment analysis 2020 - 2024

Historic Market Size - End-user Segment 2020 - 2024 ($ million)

5.4 Technology segment analysis 2020 - 2024

Historic Market Size - Technology Segment 2020 - 2024 ($ million)

5.5 Geography segment analysis 2020 - 2024

Historic Market Size - Geography Segment 2020 - 2024 ($ million)

5.6 Country segment analysis 2020 - 2024

Historic Market Size - Country Segment 2020 - 2024 ($ million)

6. Qualitative Analysis

6.1 Impact of AI on global solar photovoltaic (PV) market

6.2 Impact of geopolitical conflict on global solar photovoltaic (PV) market

7. Five Forces Analysis

7.1 Five forces summary

Five forces analysis - Comparison between 2025 and 2030

7.2 Bargaining power of buyers

Bargaining power of buyers - Impact of key factors 2025 and 2030

7.3 Bargaining power of suppliers

Bargaining power of suppliers - Impact of key factors in 2025 and 2030

7.4 Threat of new entrants

Threat of new entrants - Impact of key factors in 2025 and 2030

7.5 Threat of substitutes

Threat of substitutes - Impact of key factors in 2025 and 2030

7.6 Threat of rivalry

Threat of rivalry - Impact of key factors in 2025 and 2030

7.7 Market condition

Chart on Market condition - Five forces 2025 and 2030

8. Market Segmentation by Deployment

8.1 Market segments

Chart on Deployment - Market share 2025-2030 (%)
Data Table on Deployment - Market share 2025-2030 (%)

8.2 Comparison by Deployment

Chart on Comparison by Deployment
Data Table on Comparison by Deployment

8.3 Ground-mounted - Market size and forecast 2025-2030

Chart on Ground-mounted - Market size and forecast 2025-2030 ($ million)
Data Table on Ground-mounted - Market size and forecast 2025-2030 ($ million)
Chart on Ground-mounted - Year-over-year growth 2025-2030 (%)
Data Table on Ground-mounted - Year-over-year growth 2025-2030 (%)

8.4 Rooftop - Market size and forecast 2025-2030

Chart on Rooftop - Market size and forecast 2025-2030 ($ million)
Data Table on Rooftop - Market size and forecast 2025-2030 ($ million)
Chart on Rooftop - Year-over-year growth 2025-2030 (%)
Data Table on Rooftop - Year-over-year growth 2025-2030 (%)

8.5 Market opportunity by Deployment

Market opportunity by Deployment ($ million)
Data Table on Market opportunity by Deployment ($ million)

9. Market Segmentation by End-user

9.1 Market segments

Chart on End-user - Market share 2025-2030 (%)
Data Table on End-user - Market share 2025-2030 (%)

9.2 Comparison by End-user

Chart on Comparison by End-user
Data Table on Comparison by End-user

9.3 Commercial - Market size and forecast 2025-2030

Chart on Commercial - Market size and forecast 2025-2030 ($ million)
Data Table on Commercial - Market size and forecast 2025-2030 ($ million)
Chart on Commercial - Year-over-year growth 2025-2030 (%)
Data Table on Commercial - Year-over-year growth 2025-2030 (%)

9.4 Residential - Market size and forecast 2025-2030

Chart on Residential - Market size and forecast 2025-2030 ($ million)
Data Table on Residential - Market size and forecast 2025-2030 ($ million)
Chart on Residential - Year-over-year growth 2025-2030 (%)
Data Table on Residential - Year-over-year growth 2025-2030 (%)

9.5 Utility - Market size and forecast 2025-2030

Chart on Utility - Market size and forecast 2025-2030 ($ million)
Data Table on Utility - Market size and forecast 2025-2030 ($ million)
Chart on Utility - Year-over-year growth 2025-2030 (%)
Data Table on Utility - Year-over-year growth 2025-2030 (%)

9.6 Market opportunity by End-user

Market opportunity by End-user ($ million)
Data Table on Market opportunity by End-user ($ million)

10. Market Segmentation by Technology

10.1 Market segments

Chart on Technology - Market share 2025-2030 (%)
Data Table on Technology - Market share 2025-2030 (%)

10.2 Comparison by Technology

Chart on Comparison by Technology
Data Table on Comparison by Technology

10.3 Monocrystalline silicon - Market size and forecast 2025-2030

Chart on Monocrystalline silicon - Market size and forecast 2025-2030 ($ million)
Data Table on Monocrystalline silicon - Market size and forecast 2025-2030 ($ million)
Chart on Monocrystalline silicon - Year-over-year growth 2025-2030 (%)
Data Table on Monocrystalline silicon - Year-over-year growth 2025-2030 (%)

10.4 Polycrystalline silicon - Market size and forecast 2025-2030

Chart on Polycrystalline silicon - Market size and forecast 2025-2030 ($ million)
Data Table on Polycrystalline silicon - Market size and forecast 2025-2030 ($ million)
Chart on Polycrystalline silicon - Year-over-year growth 2025-2030 (%)
Data Table on Polycrystalline silicon - Year-over-year growth 2025-2030 (%)

10.5 Thin-film - Market size and forecast 2025-2030

Chart on Thin-film - Market size and forecast 2025-2030 ($ million)
Data Table on Thin-film - Market size and forecast 2025-2030 ($ million)
Chart on Thin-film - Year-over-year growth 2025-2030 (%)
Data Table on Thin-film - Year-over-year growth 2025-2030 (%)

10.6 Bifacial solar panels - Market size and forecast 2025-2030

Chart on Bifacial solar panels - Market size and forecast 2025-2030 ($ million)
Data Table on Bifacial solar panels - Market size and forecast 2025-2030 ($ million)
Chart on Bifacial solar panels - Year-over-year growth 2025-2030 (%)
Data Table on Bifacial solar panels - Year-over-year growth 2025-2030 (%)

10.7 Others - Market size and forecast 2025-2030

Chart on Others - Market size and forecast 2025-2030 ($ million)
Data Table on Others - Market size and forecast 2025-2030 ($ million)
Chart on Others - Year-over-year growth 2025-2030 (%)
Data Table on Others - Year-over-year growth 2025-2030 (%)

10.8 Market opportunity by Technology

Market opportunity by Technology ($ million)
Data Table on Market opportunity by Technology ($ million)

11. Customer Landscape

11.1 Customer landscape overview

Analysis of price sensitivity, lifecycle, customer purchase basket, adoption rates, and purchase criteria

12. Geographic Landscape

12.1 Geographic segmentation

Chart on Market share by geography 2025-2030 (%)
Data Table on Market share by geography 2025-2030 (%)

12.2 Geographic comparison

Chart on Geographic comparison
Data Table on Geographic comparison

12.3 APAC - Market size and forecast 2025-2030

Chart on APAC - Market size and forecast 2025-2030 ($ million)
Data Table on APAC - Market size and forecast 2025-2030 ($ million)
Chart on APAC - Year-over-year growth 2025-2030 (%)
Data Table on APAC - Year-over-year growth 2025-2030 (%)
Chart on Regional Comparison - APAC
Data Table on Regional Comparison - APAC

12.3.1 China - Market size and forecast 2025-2030

Chart on China - Market size and forecast 2025-2030 ($ million)
Data Table on China - Market size and forecast 2025-2030 ($ million)
Chart on China - Year-over-year growth 2025-2030 (%)
Data Table on China - Year-over-year growth 2025-2030 (%)

12.3.2 India - Market size and forecast 2025-2030

Chart on India - Market size and forecast 2025-2030 ($ million)
Data Table on India - Market size and forecast 2025-2030 ($ million)
Chart on India - Year-over-year growth 2025-2030 (%)
Data Table on India - Year-over-year growth 2025-2030 (%)

12.3.3 Japan - Market size and forecast 2025-2030

Chart on Japan - Market size and forecast 2025-2030 ($ million)
Data Table on Japan - Market size and forecast 2025-2030 ($ million)
Chart on Japan - Year-over-year growth 2025-2030 (%)
Data Table on Japan - Year-over-year growth 2025-2030 (%)

12.3.4 Australia - Market size and forecast 2025-2030

Chart on Australia - Market size and forecast 2025-2030 ($ million)
Data Table on Australia - Market size and forecast 2025-2030 ($ million)
Chart on Australia - Year-over-year growth 2025-2030 (%)
Data Table on Australia - Year-over-year growth 2025-2030 (%)

12.3.5 South Korea - Market size and forecast 2025-2030

Chart on South Korea - Market size and forecast 2025-2030 ($ million)
Data Table on South Korea - Market size and forecast 2025-2030 ($ million)
Chart on South Korea - Year-over-year growth 2025-2030 (%)
Data Table on South Korea - Year-over-year growth 2025-2030 (%)

12.3.6 Indonesia - Market size and forecast 2025-2030

Chart on Indonesia - Market size and forecast 2025-2030 ($ million)
Data Table on Indonesia - Market size and forecast 2025-2030 ($ million)
Chart on Indonesia - Year-over-year growth 2025-2030 (%)
Data Table on Indonesia - Year-over-year growth 2025-2030 (%)

12.4 Europe - Market size and forecast 2025-2030

Chart on Europe - Market size and forecast 2025-2030 ($ million)
Data Table on Europe - Market size and forecast 2025-2030 ($ million)
Chart on Europe - Year-over-year growth 2025-2030 (%)
Data Table on Europe - Year-over-year growth 2025-2030 (%)
Chart on Regional Comparison - Europe
Data Table on Regional Comparison - Europe

12.4.1 Germany - Market size and forecast 2025-2030

Chart on Germany - Market size and forecast 2025-2030 ($ million)
Data Table on Germany - Market size and forecast 2025-2030 ($ million)
Chart on Germany - Year-over-year growth 2025-2030 (%)
Data Table on Germany - Year-over-year growth 2025-2030 (%)

12.4.2 Spain - Market size and forecast 2025-2030

Chart on Spain - Market size and forecast 2025-2030 ($ million)
Data Table on Spain - Market size and forecast 2025-2030 ($ million)
Chart on Spain - Year-over-year growth 2025-2030 (%)
Data Table on Spain - Year-over-year growth 2025-2030 (%)

12.4.3 Italy - Market size and forecast 2025-2030

Chart on Italy - Market size and forecast 2025-2030 ($ million)
Data Table on Italy - Market size and forecast 2025-2030 ($ million)
Chart on Italy - Year-over-year growth 2025-2030 (%)
Data Table on Italy - Year-over-year growth 2025-2030 (%)

12.4.4 France - Market size and forecast 2025-2030

Chart on France - Market size and forecast 2025-2030 ($ million)
Data Table on France - Market size and forecast 2025-2030 ($ million)
Chart on France - Year-over-year growth 2025-2030 (%)
Data Table on France - Year-over-year growth 2025-2030 (%)

12.4.5 The Netherlands - Market size and forecast 2025-2030

Chart on The Netherlands - Market size and forecast 2025-2030 ($ million)
Data Table on The Netherlands - Market size and forecast 2025-2030 ($ million)
Chart on The Netherlands - Year-over-year growth 2025-2030 (%)
Data Table on The Netherlands - Year-over-year growth 2025-2030 (%)

12.4.6 UK - Market size and forecast 2025-2030

Chart on UK - Market size and forecast 2025-2030 ($ million)
Data Table on UK - Market size and forecast 2025-2030 ($ million)
Chart on UK - Year-over-year growth 2025-2030 (%)
Data Table on UK - Year-over-year growth 2025-2030 (%)

12.5 North America - Market size and forecast 2025-2030

Chart on North America - Market size and forecast 2025-2030 ($ million)
Data Table on North America - Market size and forecast 2025-2030 ($ million)
Chart on North America - Year-over-year growth 2025-2030 (%)
Data Table on North America - Year-over-year growth 2025-2030 (%)
Chart on Regional Comparison - North America
Data Table on Regional Comparison - North America

12.5.1 US - Market size and forecast 2025-2030

Chart on US - Market size and forecast 2025-2030 ($ million)
Data Table on US - Market size and forecast 2025-2030 ($ million)
Chart on US - Year-over-year growth 2025-2030 (%)
Data Table on US - Year-over-year growth 2025-2030 (%)

12.5.2 Canada - Market size and forecast 2025-2030

Chart on Canada - Market size and forecast 2025-2030 ($ million)
Data Table on Canada - Market size and forecast 2025-2030 ($ million)
Chart on Canada - Year-over-year growth 2025-2030 (%)
Data Table on Canada - Year-over-year growth 2025-2030 (%)

12.5.3 Mexico - Market size and forecast 2025-2030

Chart on Mexico - Market size and forecast 2025-2030 ($ million)
Data Table on Mexico - Market size and forecast 2025-2030 ($ million)
Chart on Mexico - Year-over-year growth 2025-2030 (%)
Data Table on Mexico - Year-over-year growth 2025-2030 (%)

12.6 Middle East and Africa - Market size and forecast 2025-2030

Chart on Middle East and Africa - Market size and forecast 2025-2030 ($ million)
Data Table on Middle East and Africa - Market size and forecast 2025-2030 ($ million)
Chart on Middle East and Africa - Year-over-year growth 2025-2030 (%)
Data Table on Middle East and Africa - Year-over-year growth 2025-2030 (%)
Chart on Regional Comparison - Middle East and Africa
Data Table on Regional Comparison - Middle East and Africa

12.6.1 Saudi Arabia - Market size and forecast 2025-2030

Chart on Saudi Arabia - Market size and forecast 2025-2030 ($ million)
Data Table on Saudi Arabia - Market size and forecast 2025-2030 ($ million)
Chart on Saudi Arabia - Year-over-year growth 2025-2030 (%)
Data Table on Saudi Arabia - Year-over-year growth 2025-2030 (%)

12.6.2 UAE - Market size and forecast 2025-2030

Chart on UAE - Market size and forecast 2025-2030 ($ million)
Data Table on UAE - Market size and forecast 2025-2030 ($ million)
Chart on UAE - Year-over-year growth 2025-2030 (%)
Data Table on UAE - Year-over-year growth 2025-2030 (%)

12.6.3 South Africa - Market size and forecast 2025-2030

Chart on South Africa - Market size and forecast 2025-2030 ($ million)
Data Table on South Africa - Market size and forecast 2025-2030 ($ million)
Chart on South Africa - Year-over-year growth 2025-2030 (%)
Data Table on South Africa - Year-over-year growth 2025-2030 (%)

12.6.4 Egypt - Market size and forecast 2025-2030

Chart on Egypt - Market size and forecast 2025-2030 ($ million)
Data Table on Egypt - Market size and forecast 2025-2030 ($ million)
Chart on Egypt - Year-over-year growth 2025-2030 (%)
Data Table on Egypt - Year-over-year growth 2025-2030 (%)

12.6.5 Morocco - Market size and forecast 2025-2030

Chart on Morocco - Market size and forecast 2025-2030 ($ million)
Data Table on Morocco - Market size and forecast 2025-2030 ($ million)
Chart on Morocco - Year-over-year growth 2025-2030 (%)
Data Table on Morocco - Year-over-year growth 2025-2030 (%)

12.7 South America - Market size and forecast 2025-2030

Chart on South America - Market size and forecast 2025-2030 ($ million)
Data Table on South America - Market size and forecast 2025-2030 ($ million)
Chart on South America - Year-over-year growth 2025-2030 (%)
Data Table on South America - Year-over-year growth 2025-2030 (%)
Chart on Regional Comparison - South America
Data Table on Regional Comparison - South America

12.7.1 Brazil - Market size and forecast 2025-2030

Chart on Brazil - Market size and forecast 2025-2030 ($ million)
Data Table on Brazil - Market size and forecast 2025-2030 ($ million)
Chart on Brazil - Year-over-year growth 2025-2030 (%)
Data Table on Brazil - Year-over-year growth 2025-2030 (%)

12.7.2 Chile - Market size and forecast 2025-2030

Chart on Chile - Market size and forecast 2025-2030 ($ million)
Data Table on Chile - Market size and forecast 2025-2030 ($ million)
Chart on Chile - Year-over-year growth 2025-2030 (%)
Data Table on Chile - Year-over-year growth 2025-2030 (%)

12.7.3 Argentina - Market size and forecast 2025-2030

Chart on Argentina - Market size and forecast 2025-2030 ($ million)
Data Table on Argentina - Market size and forecast 2025-2030 ($ million)
Chart on Argentina - Year-over-year growth 2025-2030 (%)
Data Table on Argentina - Year-over-year growth 2025-2030 (%)

12.8 Market opportunity by geography

Market opportunity by geography ($ million)
Data Tables on Market opportunity by geography ($ million)

13. Drivers, Challenges, and Opportunity

13.1 Market drivers

Technological innovation and commercialization of high efficiency cell architectures
Supportive policy frameworks and national energy security mandates
Integration of advanced energy storage and grid modernization solutions

13.2 Market challenges

Supply chain volatility and upstream cost pressures
Infrastructure limitations and grid integration hurdles
Regulatory complexity and domestic content mandates

13.3 Impact of drivers and challenges

Impact of drivers and challenges in 2025 and 2030

13.4 Market opportunities

Acceleration of high efficiency n type cell architectures and perovskite integration
Proliferation of solar plus storage and grid edge intelligence
Expansion of diversified application models and sustainable lifecycle management

14. Competitive Landscape

14.1 Overview

14.2

Overview on criticality of inputs and factors of differentiation

14.3 Landscape disruption

Overview on factors of disruption

14.4 Industry risks

Impact of key risks on business

15. Competitive Analysis

15.1 Companies profiled

Companies covered

15.2 Company ranking index

15.3 Market positioning of companies

Matrix on companies position and classification

15.4 Adani Solar

Adani Solar - Overview
Adani Solar - Product / Service
Adani Solar - Key offerings
SWOT

15.5 AE Solar GmbH

AE Solar GmbH - Overview
AE Solar GmbH - Product / Service
AE Solar GmbH - Key offerings
SWOT

15.6 Astronergy Co Ltd

Astronergy Co Ltd - Overview
Astronergy Co Ltd - Product / Service
Astronergy Co Ltd - Key offerings
SWOT

15.7 Canadian Solar Inc.

Canadian Solar Inc. - Overview
Canadian Solar Inc. - Business segments
Canadian Solar Inc. - Key offerings
Canadian Solar Inc. - Segment focus
SWOT

15.8 First Solar Inc.

First Solar Inc. - Overview
First Solar Inc. - Business segments
First Solar Inc. - Key offerings
First Solar Inc. - Segment focus
SWOT

15.9 HELIENE Inc.

HELIENE Inc. - Overview
HELIENE Inc. - Product / Service
HELIENE Inc. - Key offerings
SWOT

15.10 Huasun Energy Co Ltd

Huasun Energy Co Ltd - Overview
Huasun Energy Co Ltd - Product / Service
Huasun Energy Co Ltd - Key offerings
SWOT

15.11 JA Solar Technology Co. Ltd.

JA Solar Technology Co. Ltd. - Overview
JA Solar Technology Co. Ltd. - Product / Service
JA Solar Technology Co. Ltd. - Key offerings
SWOT

15.12 JinkoSolar Holding Co. Ltd.

JinkoSolar Holding Co. Ltd. - Overview
JinkoSolar Holding Co. Ltd. - Product / Service
JinkoSolar Holding Co. Ltd. - Key offerings
SWOT

15.13 LONGi Green Energy Co. Ltd.

LONGi Green Energy Co. Ltd. - Overview
LONGi Green Energy Co. Ltd. - Product / Service
LONGi Green Energy Co. Ltd. - Key offerings
SWOT

15.14 Maxeon Solar Technologies Ltd.

Maxeon Solar Technologies Ltd. - Overview
Maxeon Solar Technologies Ltd. - Product / Service
Maxeon Solar Technologies Ltd. - Key offerings
SWOT

15.15 Shanghai AIKO Energy Co Ltd.

Shanghai AIKO Energy Co Ltd. - Overview
Shanghai AIKO Energy Co Ltd. - Business segments
Shanghai AIKO Energy Co Ltd. - Key offerings
Shanghai AIKO Energy Co Ltd. - Segment focus
SWOT

15.16 Talesun Solar Technologies

Talesun Solar Technologies - Overview
Talesun Solar Technologies - Product / Service
Talesun Solar Technologies - Key offerings
SWOT

15.17 Trina Solar Co. Ltd.

Trina Solar Co. Ltd. - Overview
Trina Solar Co. Ltd. - Product / Service
Trina Solar Co. Ltd. - Key offerings
SWOT

15.18 Yingli Solar

Yingli Solar - Overview
Yingli Solar - Product / Service
Yingli Solar - Key offerings
SWOT

16. Appendix

16.1 Scope of the report

Market definition
Objectives
Notes and caveats

16.2 Inclusions and exclusions checklist

Inclusions checklist
Exclusions checklist

16.3 Currency conversion rates for US$

16.4 Research methodology

16.5 Data procurement

Information sources

16.6 Data validation

16.7 Validation techniques employed for market sizing

16.8 Data synthesis

16.9 360 degree market analysis

16.10 List of abbreviations

Research Methodology

Technavio presents a detailed picture of the market by way of study, synthesis, and summation of data from multiple sources. The analysts have presented the various facets of the market with a particular focus on identifying the key industry influencers. The data thus presented is comprehensive, reliable, and the result of extensive research, both primary and secondary.

INFORMATION SOURCES

Primary sources

  • Manufacturers and suppliers
  • Channel partners
  • Industry experts
  • Strategic decision makers

Secondary sources

  • Industry journals and periodicals
  • Government data
  • Financial reports of key industry players
  • Historical data
  • Press releases

DATA ANALYSIS

Data Synthesis

  • Collation of data
  • Estimation of key figures
  • Analysis of derived insights

Data Validation

  • Triangulation with data models
  • Reference against proprietary databases
  • Corroboration with industry experts

REPORT WRITING

Qualitative

  • Market drivers
  • Market challenges
  • Market trends
  • Five forces analysis

Quantitative

  • Market size and forecast
  • Market segmentation
  • Geographical insights
  • Competitive landscape

Interested in this report?

Get your sample now to see our research methodology and insights!

Download Now

Frequently Asked Questions

Solar Photovoltaic (PV) market growth will increase by USD 65978.5 million during 2026-2030.

The Solar Photovoltaic (PV) market is expected to grow at a CAGR of 9.2% during 2026-2030.

Solar Photovoltaic (PV) market is segmented by Deployment (Ground-mounted, Rooftop) End-user (Commercial, Residential, Utility) Technology (Monocrystalline silicon, Polycrystalline silicon, Thin-film, Bifacial solar panels, Others)

Adani Solar, AE Solar GmbH, Astronergy Co Ltd, Bauer Solar GmbH, Canadian Solar Inc., First Solar Inc., GAF Materials LLC, HELIENE Inc., Huasun Energy Co Ltd, JA Solar Technology Co. Ltd., JinkoSolar Holding Co. Ltd., LONGi Green Energy Co. Ltd., Maxeon Solar Technologies Ltd., Shanghai AIKO Energy Co Ltd., Talesun Solar Technologies, Trina Solar Co. Ltd., Yingli Solar are a few of the key vendors in the Solar Photovoltaic (PV) market.

APAC will register the highest growth rate of 45.2% among the other regions. Therefore, the Solar Photovoltaic (PV) market in APAC is expected to garner significant business opportunities for the vendors during the forecast period.

China, India, Japan, Australia, South Korea, Indonesia, Germany, Spain, Italy, France, The Netherlands, UK, US, Canada, Mexico, Saudi Arabia, UAE, South Africa, Egypt, Morocco, Brazil, Chile, Argentina

  • Technological innovation and commercialization of high efficiency cell architectures is the driving factor this market.

The Solar Photovoltaic (PV) market vendors should focus on grabbing business opportunities from the Deployment segment as it accounted for the largest market share in the base year.
RIA - Research AI Assistant
Ask RIA