Solar Purifiers Market Analysis APAC, Europe, North America, South America, Middle East and Africa - US, China, India, Germany, UK - Size and Forecast 2024-2028

Solar Purifiers Market Analysis APAC, Europe, North America, South America, Middle East and Africa - US, China, India, Germany, UK - Size and Forecast 2024-2028

Published: Dec 2023 154 Pages SKU: IRTNTR76978

Market Overview at a Glance

$277.93 Mn
Market Opportunity
8.51%
CAGR
7.1
YoY growth 2023-2024(%)

Solar Purifiers Market Size 2024-2028 

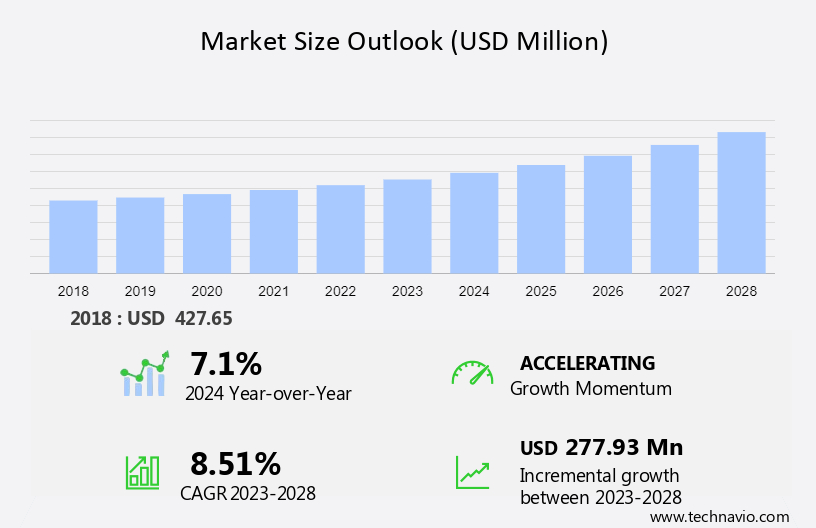
The solar purifiers market size is forecast to increase by USD 277.93 million at a CAGR of 8.51% between 2023 and 2028. The solar purifier market is experiencing significant growth due to the increasing water scarcity and the need for clean drinking water. Energy storage solutions have become essential for solar purifiers to ensure uninterrupted water supply. Market trends include the introduction of smart, connected solar purifiers, which offer advanced features such as real-time monitoring and remote control. However, the presence of counterfeit purifier products poses a challenge to market growth.

Consumers increasingly prefer ultra-filtration systems due to their ability to remove bacteria and viruses effectively. Data validation methodologies and data forecasting models are being employed to ensure the accuracy of market research and trends. HP Watermaker, with its energy-efficient and advanced filtration technology, is a key player in the market. Product preferences and consumer patterns continue to shape the market landscape, making it crucial for companies to stay updated on the latest trends and challenges.

What will be the size of the Solar Purifiers Market During the Forecast Period?

Solar Purifiers Market Size

 Request Free Sample

Market Segmentation

The market research report provides comprehensive data (region-wise segment analysis), with forecasts and estimates in "USD million" for the period 2024-2028, as well as historical data from 2018-2022 for the following segments.

  • Application
    • Portable
    • Stationary
  • Type
    • Water
    • Air
  • Geography
    • APAC
      • China
      • India
    • Europe
      • Germany
      • UK
    • North America
      • US
    • South America
    • Middle East and Africa

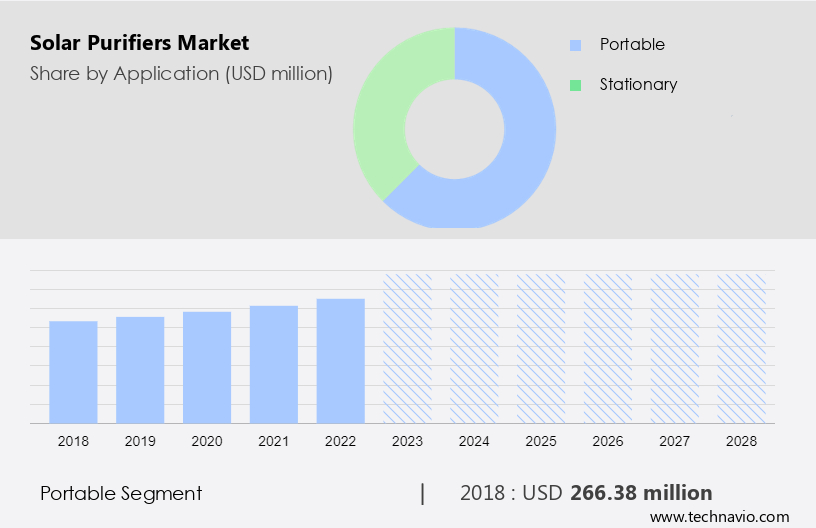
By Application Insights

The portable segment is estimated to witness significant growth during the forecast period. Solar water purification through portable systems is an effective method for pathogen-contaminant purification in various applications, particularly in remote areas and during emergencies. The portable segment of solar water purification systems is projected to expand significantly during the forecast period. This growth can be attributed to the increasing popularity of outdoor activities, such as camping, hiking, and trekking, the expanding tourism and leisure industry, and the rise in natural disasters leading to the disruption of potable water sources. Portable solar purifiers are an inexpensive and sustainable solution for purifying water contaminated with harmful bacteria and viruses. These systems utilize solar panel to generate power and filter water, making them an ideal choice for individuals and organizations in need of clean water in remote locations or during emergencies.

Solar Purifiers Market Size

Get a glance at the market share of various segments Request Free Sample

The portable segment accounted for USD 266.38 million in 2018 and showed a gradual increase during the forecast period.

Regional Insights

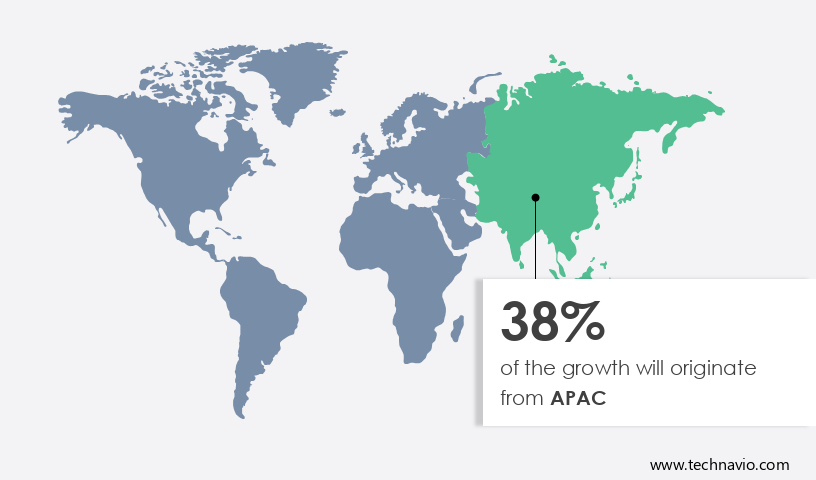
APAC is estimated to contribute 38% to the growth of the global market during the forecast period. Technavio's analysts have elaborately explained the regional trends and drivers that shape the market during the forecast period.

Solar Purifiers Market Share by Geography

For more insights on the market share of various regions Request Free Sample

The market is experiencing significant growth due to its effectiveness in pathogen-contaminant purification in remote areas. Solar panels, as the power source, make solar water purification an inexpensive way to access clean water, especially in regions with limited resources. The market, particularly in the Asia Pacific (APAC) region, is expanding rapidly. Factors contributing to this growth include rising air pollution levels in countries like India and China, plummeting solar panel prices, and a global shift towards Renewable energy sources. The positive economic climate in emerging APAC economies, such as India, China, Vietnam, and the Philippines, is driving spending in the commercial and residential sectors.

Additionally, population growth and urbanization in this region have heightened the demand for smart and sustainable water purification solutions. This is leading to a rise in requests for affordable solar water purifiers in both urban and rural areas, particularly in India and China.

Our researchers analyzed the data with 2023 as the base year, along with the key drivers, trends, and challenges. A holistic analysis of drivers will help companies refine their marketing strategies to gain a competitive advantage.

Market Dynamics

Solar water purifiers have gained significant attention in recent years as an effective method for providing clean, drinkable water, particularly in areas with contaminated water sources. Solar water purification utilizes solar energy, often through the use of a solar panel, to power water purification systems. This process is effective in removing harmful bacteria, viruses, and even microplastics from water, making it safe for household purposes such as drinking and cooking. Solar water purifiers offer inexpensive ways to access clean water in remote areas where large electric generators may not be available. Renewable energy sources like solar power reduce the carbon impression and contribute to the environment by reducing greenhouse gas emissions.

Furthermore, solar water purification is also crucial during natural disasters such as hurricanes, droughts, and floods, which can lead to water scarcity and the spread of waterborne diseases. An is often used in solar water purifiers to ensure thorough pathogen-contaminant purification. Energy storage solutions are also integrated into these systems to ensure a consistent water supply even during periods of limiteultra-filtration systemd sunlight. Overall, solar water purifiers offer a sustainable, clean, and cost-effective solution for accessing drinkable water, especially in areas where traditional water sources may be contaminated or unreliable.

Market Driver

The increase in demand for energy-efficient purifiers is the key driver of the market. The demand for solar water purifiers is surging as consumers prioritize eco-friendly solutions for producing purified water for household purposes. Solar energy is an ideal source for powering these appliances, providing access to clean and drinkable water without relying on traditional energy sources. Contaminated water is a significant health concern, and solar water purifiers offer a sustainable and cost-effective solution.

Furthermore, these companies are focusing on developing energy-efficient solar water purifiers to cater to the increasing consumer preference for eco-friendly appliances. Government regulations mandating energy efficiency for home appliances further boost the market growth. Solar water purifiers offer a viable alternative to conventional purifiers, providing clean water while reducing energy consumption and carbon footprint.

Market Trends

The introduction of smart, connected solar purifiers is the upcoming trend in the market. The market is witnessing significant growth due to the increasing demand for purified water for household purposes. Solar water purifiers, which utilize solar energy to purify contaminated water and provide clean, drinkable water, are gaining popularity. Smart solar purifiers are emerging as innovative solutions in this market, offering user-friendly designs, advanced technologies, and improved aesthetics.

Furthermore, these smart solar purifiers come with several features to enhance user comfort, such as Energy Star certification for energy savings, hassle-free maintenance with automatic cleaning, and alerts for faults or issues. These features make solar purifiers an attractive option for consumers seeking clean water while also being environmentally conscious.

Market Challenge

The presence of counterfeit purifier products is a key challenge affecting the market growth. The market has witnessed significant growth in recent years due to the increasing demand for purified water for household purposes. Solar water purifiers, which utilize solar energy to purify contaminated water and provide clean, drinkable water, have gained popularity in both developed and developing regions. However, the market's growth is threatened by the proliferation of counterfeit solar purifier products.

Furthermore, these products, made from low-quality raw materials, have less durability and may not provide effective purification. The ease of distribution and sales through e-commerce platforms has facilitated the spread of counterfeit solar purifier components. Consumers often find it challenging to distinguish genuine products from counterfeit ones. Despite this, the relatively low price of counterfeit solar purifiers continues to fuel their demand. Government authorities worldwide seize counterfeit products, including purifiers, regularly. Consumers must ensure they purchase genuine solar purifiers to ensure their health and safety.

Exclusive Customer Landscape

The market forecasting report includes the adoption lifecycle of the market, covering from the innovator's stage to the laggard's stage. It focuses on adoption rates in different regions based on penetration. Furthermore, the report also includes key purchase criteria and drivers of price sensitivity to help companies evaluate and develop their market growth analysis strategies.

Solar Purifiers Market Share by Geography

 Customer Landscape

Key Companies & Market Insights

Companies are implementing various strategies, such as strategic alliances, partnerships, mergers and acquisitions, geographical expansion, and product/service launches, to enhance their presence in the market.

BHARAT SOLAR ENERGY: The company offers residential solar purifiers and solar water pumps, under its subsidiary called Solar Energy solutions.

The market research and growth report includes detailed analyses of the competitive landscape of the market and information about key companies, including:

  • C AND B INTERNATIONAL HOLDINGS CO. LTD.
  • COSMIC MICRO SYSTEMS PVT. LTD.
  • Desolenator
  • GRS India Corp.
  • H20 Heroes
  • Hi Tech Sweet Water Technologies Pvt. Ltd.
  • HikePower Ltd.
  • Netsol Water Solutions Pvt. Ltd.
  • Nevon Projects
  • NEWater China
  • Nuetech Solar Systems Pvt. Ltd.
  • Power4 Industries Ltd.
  • Puralytics
  • Solar Water Plc
  • Solar Water Solutions Oy Ltd.
  • Solatron Inc.
  • Swajal Water Pvt. Ltd.
  • Tata Power Co. Ltd.
  • WattSun Energy India Pvt. Ltd.

Qualitative and quantitative analysis of companies has been conducted to help clients understand the wider business environment as well as the strengths and weaknesses of key market players. Data is qualitatively analyzed to categorize companies as pure play, category-focused, industry-focused, and diversified; it is quantitatively analyzed to categorize companies as dominant, leading, strong, tentative, and weak.

Research Analyst Overview

Solar water purifiers have gained significant attention in recent years as an effective method for providing clean, drinkable water for household purposes in remote areas. Solar energy, a renewable and abundant resource, is used to power these water purifiers, making them an inexpensive way to purify contaminated water. Solar water purification systems use solar panels to convert sunshine into electricity, which powers the water filtration system. This process is effective in removing harmful bacteria, viruses, and even microplastics from water. Solar water purifiers are particularly useful in areas with waterborne diseases, which are often caused by contaminated water sources.

Furthermore, in regions prone to natural disasters such as hurricanes, droughts, and floods, solar water purifiers provide a reliable source of clean drinking water. The solar water purification system consists of a solar panel, water filter, and energy storage solutions. The filtration system uses an ultra-filtration system to remove impurities and salinity from the water. Consumer preferences and product availability in various markets influence the design and implementation of solar water purifiers. Data validation methodologies and data forecasting models are used to understand consumer patterns and product demand. Eco-friendly technologies, such as solar water purifiers, contribute to reducing the carbon impression and greenhouse gas emissions associated with large electric generators. As the world faces water scarcity and climate change, solar water purifiers provide a sustainable and efficient solution for providing clean drinking water to domestic and low-income groups in coastal and tribal areas.

Market Scope

Report Coverage

Details

Page number

154

Base year

2023

Historic period

2018-2022

Forecast period

2024-2028

Growth momentum & CAGR

Accelerate at a CAGR of 8.51%

Market Growth 2024-2028

USD 277.93 million

Market structure

Fragmented

YoY growth 2023-2024(%)

7.1

Regional analysis

APAC, Europe, North America, South America, and Middle East and Africa

Performing market contribution

APAC at 38%

Key countries

US, China, India, Germany, and UK

Competitive landscape

Leading Companies, Market Positioning of Companies, Competitive Strategies, and Industry Risks

Key companies profiled

BHARAT SOLAR ENERGY, C AND B INTERNATIONAL HOLDINGS CO. LTD., COSMIC MICRO SYSTEMS PVT. LTD., Desolenator, GRS India Corp., H20 Heroes, Hi Tech Sweet Water Technologies Pvt. Ltd., HikePower Ltd., Netsol Water Solutions Pvt. Ltd., Nevon Projects, NEWater China, Nuetech Solar Systems Pvt. Ltd., Power4 Industries Ltd., Puralytics, Solar Water Plc, Solar Water Solutions Oy Ltd., Solatron Inc., Swajal Water Pvt. Ltd., Tata Power Co. Ltd., and WattSun Energy India Pvt. Ltd.

Market dynamics

Parent market analysis, market growth inducers and obstacles, market forecast, fast-growing and slow-growing segment analysis, COVID-19 impact and recovery analysis and future consumer dynamics, market condition analysis for the forecast period

Customization purview

If our market report has not included the data that you are looking for, you can reach out to our analysts and get segments customized.

Request Free Sample

What are the Key Data Covered in this Market Research and Growth Report?

  • CAGR of the market during the forecast period
  • Detailed information on factors that will drive the market growth and forecasting between 2024 and 2028
  • Precise estimation of the size of the market  and its contribution of the market in focus to the parent market
  • Accurate predictions about upcoming market growth and trends and changes in consumer behaviour
  • Growth of the market across APAC, Europe, North America, South America, and Middle East and Africa
  • Thorough analysis of the market's competitive landscape and detailed information about companies
  • Comprehensive analysis of factors that will challenge the growth of market companies

We can help! Our analysts can customize this market research report to meet your requirements. Get in touch

1 Executive Summary

  • 1.1 Market overview
    • Exhibit 01: Executive Summary – Chart on Market Overview
    • Exhibit 02: Executive Summary – Data Table on Market Overview
    • Exhibit 03: Executive Summary – Chart on Global Market Characteristics
    • Exhibit 04: Executive Summary – Chart on Market by Geography
    • Exhibit 05: Executive Summary – Chart on Market Segmentation by Application
    • Exhibit 06: Executive Summary – Chart on Market Segmentation by Type
    • Exhibit 07: Executive Summary – Chart on Incremental Growth
    • Exhibit 08: Executive Summary – Data Table on Incremental Growth
    • Exhibit 09: Executive Summary – Chart on Vendor Market Positioning

2 Market Landscape

  • 2.1 Market ecosystem
    • Exhibit 10: Parent market
    • Exhibit 11: Market Characteristics

3 Market Sizing

  • 3.1 Market definition
    • Exhibit 12: Offerings of vendors included in the market definition
  • 3.2 Market segment analysis
    • Exhibit 13: Market segments
  • 3.3 Market size 2023
    • 3.4 Market outlook: Forecast for 2023-2028
      • Exhibit 14: Chart on Global - Market size and forecast 2023-2028 ($ million)
      • Exhibit 15: Data Table on Global - Market size and forecast 2023-2028 ($ million)
      • Exhibit 16: Chart on Global Market: Year-over-year growth 2023-2028 (%)
      • Exhibit 17: Data Table on Global Market: Year-over-year growth 2023-2028 (%)

    4 Historic Market Size

    • 4.1 Global solar purifiers market 2018 - 2022
      • Exhibit 18: Historic Market Size – Data Table on global solar purifiers market 2018 - 2022 ($ million)
    • 4.2 Application Segment Analysis 2018 - 2022
      • Exhibit 19: Historic Market Size – Application Segment 2018 - 2022 ($ million)
    • 4.3 Type Segment Analysis 2018 - 2022
      • Exhibit 20: Historic Market Size – Type Segment 2018 - 2022 ($ million)
    • 4.4 Geography Segment Analysis 2018 - 2022
      • Exhibit 21: Historic Market Size – Geography Segment 2018 - 2022 ($ million)
    • 4.5 Country Segment Analysis 2018 - 2022
      • Exhibit 22: Historic Market Size – Country Segment 2018 - 2022 ($ million)

    5 Five Forces Analysis

    • 5.1 Five forces summary
      • Exhibit 23: Five forces analysis - Comparison between 2023 and 2028
    • 5.2 Bargaining power of buyers
      • Exhibit 24: Chart on Bargaining power of buyers – Impact of key factors 2023 and 2028
    • 5.3 Bargaining power of suppliers
      • Exhibit 25: Bargaining power of suppliers – Impact of key factors in 2023 and 2028
    • 5.4 Threat of new entrants
      • Exhibit 26: Threat of new entrants – Impact of key factors in 2023 and 2028
    • 5.5 Threat of substitutes
      • Exhibit 27: Threat of substitutes – Impact of key factors in 2023 and 2028
    • 5.6 Threat of rivalry
      • Exhibit 28: Threat of rivalry – Impact of key factors in 2023 and 2028
    • 5.7 Market condition
      • Exhibit 29: Chart on Market condition - Five forces 2023 and 2028

    6 Market Segmentation by Application

    • 6.1 Market segments
      • Exhibit 30: Chart on Application - Market share 2023-2028 (%)
      • Exhibit 31: Data Table on Application - Market share 2023-2028 (%)
    • 6.2 Comparison by Application
      • Exhibit 32: Chart on Comparison by Application
      • Exhibit 33: Data Table on Comparison by Application
    • 6.3 Portable - Market size and forecast 2023-2028
      • Exhibit 34: Chart on Portable - Market size and forecast 2023-2028 ($ million)
      • Exhibit 35: Data Table on Portable - Market size and forecast 2023-2028 ($ million)
      • Exhibit 36: Chart on Portable - Year-over-year growth 2023-2028 (%)
      • Exhibit 37: Data Table on Portable - Year-over-year growth 2023-2028 (%)
    • 6.4 Stationary - Market size and forecast 2023-2028
      • Exhibit 38: Chart on Stationary - Market size and forecast 2023-2028 ($ million)
      • Exhibit 39: Data Table on Stationary - Market size and forecast 2023-2028 ($ million)
      • Exhibit 40: Chart on Stationary - Year-over-year growth 2023-2028 (%)
      • Exhibit 41: Data Table on Stationary - Year-over-year growth 2023-2028 (%)
    • 6.5 Market opportunity by Application
      • Exhibit 42: Market opportunity by Application ($ million)
      • Exhibit 43: Data Table on Market opportunity by Application ($ million)

    7 Market Segmentation by Type

    • 7.1 Market segments
      • Exhibit 44: Chart on Type - Market share 2023-2028 (%)
      • Exhibit 45: Data Table on Type - Market share 2023-2028 (%)
    • 7.2 Comparison by Type
      • Exhibit 46: Chart on Comparison by Type
      • Exhibit 47: Data Table on Comparison by Type
    • 7.3 Water - Market size and forecast 2023-2028
      • Exhibit 48: Chart on Water - Market size and forecast 2023-2028 ($ million)
      • Exhibit 49: Data Table on Water - Market size and forecast 2023-2028 ($ million)
      • Exhibit 50: Chart on Water - Year-over-year growth 2023-2028 (%)
      • Exhibit 51: Data Table on Water - Year-over-year growth 2023-2028 (%)
    • 7.4 Air - Market size and forecast 2023-2028
      • Exhibit 52: Chart on Air - Market size and forecast 2023-2028 ($ million)
      • Exhibit 53: Data Table on Air - Market size and forecast 2023-2028 ($ million)
      • Exhibit 54: Chart on Air - Year-over-year growth 2023-2028 (%)
      • Exhibit 55: Data Table on Air - Year-over-year growth 2023-2028 (%)
    • 7.5 Market opportunity by Type
      • Exhibit 56: Market opportunity by Type ($ million)
      • Exhibit 57: Data Table on Market opportunity by Type ($ million)

    8 Customer Landscape

    • 8.1 Customer landscape overview
      • Exhibit 58: Analysis of price sensitivity, lifecycle, customer purchase basket, adoption rates, and purchase criteria

    9 Geographic Landscape

    • 9.1 Geographic segmentation
      • Exhibit 59: Chart on Market share by geography 2023-2028 (%)
      • Exhibit 60: Data Table on Market share by geography 2023-2028 (%)
    • 9.2 Geographic comparison
      • Exhibit 61: Chart on Geographic comparison
      • Exhibit 62: Data Table on Geographic comparison
    • 9.3 APAC - Market size and forecast 2023-2028
      • Exhibit 63: Chart on APAC - Market size and forecast 2023-2028 ($ million)
      • Exhibit 64: Data Table on APAC - Market size and forecast 2023-2028 ($ million)
      • Exhibit 65: Chart on APAC - Year-over-year growth 2023-2028 (%)
      • Exhibit 66: Data Table on APAC - Year-over-year growth 2023-2028 (%)
    • 9.4 Europe - Market size and forecast 2023-2028
      • Exhibit 67: Chart on Europe - Market size and forecast 2023-2028 ($ million)
      • Exhibit 68: Data Table on Europe - Market size and forecast 2023-2028 ($ million)
      • Exhibit 69: Chart on Europe - Year-over-year growth 2023-2028 (%)
      • Exhibit 70: Data Table on Europe - Year-over-year growth 2023-2028 (%)
    • 9.5 North America - Market size and forecast 2023-2028
      • Exhibit 71: Chart on North America - Market size and forecast 2023-2028 ($ million)
      • Exhibit 72: Data Table on North America - Market size and forecast 2023-2028 ($ million)
      • Exhibit 73: Chart on North America - Year-over-year growth 2023-2028 (%)
      • Exhibit 74: Data Table on North America - Year-over-year growth 2023-2028 (%)
    • 9.6 South America - Market size and forecast 2023-2028
      • Exhibit 75: Chart on South America - Market size and forecast 2023-2028 ($ million)
      • Exhibit 76: Data Table on South America - Market size and forecast 2023-2028 ($ million)
      • Exhibit 77: Chart on South America - Year-over-year growth 2023-2028 (%)
      • Exhibit 78: Data Table on South America - Year-over-year growth 2023-2028 (%)
    • 9.7 Middle East and Africa - Market size and forecast 2023-2028
      • Exhibit 79: Chart on Middle East and Africa - Market size and forecast 2023-2028 ($ million)
      • Exhibit 80: Data Table on Middle East and Africa - Market size and forecast 2023-2028 ($ million)
      • Exhibit 81: Chart on Middle East and Africa - Year-over-year growth 2023-2028 (%)
      • Exhibit 82: Data Table on Middle East and Africa - Year-over-year growth 2023-2028 (%)
    • 9.8 US - Market size and forecast 2023-2028
      • Exhibit 83: Chart on US - Market size and forecast 2023-2028 ($ million)
      • Exhibit 84: Data Table on US - Market size and forecast 2023-2028 ($ million)
      • Exhibit 85: Chart on US - Year-over-year growth 2023-2028 (%)
      • Exhibit 86: Data Table on US - Year-over-year growth 2023-2028 (%)
    • 9.9 China - Market size and forecast 2023-2028
      • Exhibit 87: Chart on China - Market size and forecast 2023-2028 ($ million)
      • Exhibit 88: Data Table on China - Market size and forecast 2023-2028 ($ million)
      • Exhibit 89: Chart on China - Year-over-year growth 2023-2028 (%)
      • Exhibit 90: Data Table on China - Year-over-year growth 2023-2028 (%)
    • 9.10 Germany - Market size and forecast 2023-2028
      • Exhibit 91: Chart on Germany - Market size and forecast 2023-2028 ($ million)
      • Exhibit 92: Data Table on Germany - Market size and forecast 2023-2028 ($ million)
      • Exhibit 93: Chart on Germany - Year-over-year growth 2023-2028 (%)
      • Exhibit 94: Data Table on Germany - Year-over-year growth 2023-2028 (%)
    • 9.11 UK - Market size and forecast 2023-2028
      • Exhibit 95: Chart on UK - Market size and forecast 2023-2028 ($ million)
      • Exhibit 96: Data Table on UK - Market size and forecast 2023-2028 ($ million)
      • Exhibit 97: Chart on UK - Year-over-year growth 2023-2028 (%)
      • Exhibit 98: Data Table on UK - Year-over-year growth 2023-2028 (%)
    • 9.12 India - Market size and forecast 2023-2028
      • Exhibit 99: Chart on India - Market size and forecast 2023-2028 ($ million)
      • Exhibit 100: Data Table on India - Market size and forecast 2023-2028 ($ million)
      • Exhibit 101: Chart on India - Year-over-year growth 2023-2028 (%)
      • Exhibit 102: Data Table on India - Year-over-year growth 2023-2028 (%)
    • 9.13 Market opportunity by geography
      • Exhibit 103: Market opportunity by geography ($ million)
      • Exhibit 104: Data Tables on Market opportunity by geography ($ million)

    10 Drivers, Challenges, and Trends

    • 10.1 Market drivers
      • 10.2 Market challenges
        • 10.3 Impact of drivers and challenges
          • Exhibit 105: Impact of drivers and challenges in 2023 and 2028
        • 10.4 Market trends

          11 Vendor Landscape

          • 11.1 Overview
            • 11.2 Vendor landscape
              • Exhibit 106: Overview on Criticality of inputs and Factors of differentiation
            • 11.3 Landscape disruption
              • Exhibit 107: Overview on factors of disruption
            • 11.4 Industry risks
              • Exhibit 108: Impact of key risks on business

            12 Vendor Analysis

            • 12.1 Vendors covered
              • Exhibit 109: Vendors covered
            • 12.2 Market positioning of vendors
              • Exhibit 110: Matrix on vendor position and classification
            • 12.3 BHARAT SOLAR ENERGY
              • Exhibit 111: BHARAT SOLAR ENERGY - Overview
              • Exhibit 112: BHARAT SOLAR ENERGY - Product / Service
              • Exhibit 113: BHARAT SOLAR ENERGY - Key offerings
            • 12.4 C AND B INTERNATIONAL HOLDINGS CO. LTD.
              • Exhibit 114: C AND B INTERNATIONAL HOLDINGS CO. LTD. - Overview
              • Exhibit 115: C AND B INTERNATIONAL HOLDINGS CO. LTD. - Product / Service
              • Exhibit 116: C AND B INTERNATIONAL HOLDINGS CO. LTD. - Key offerings
            • 12.5 COSMIC MICRO SYSTEMS PVT. LTD.
              • Exhibit 117: COSMIC MICRO SYSTEMS PVT. LTD. - Overview
              • Exhibit 118: COSMIC MICRO SYSTEMS PVT. LTD. - Product / Service
              • Exhibit 119: COSMIC MICRO SYSTEMS PVT. LTD. - Key offerings
            • 12.6 GRS India Corp.
              • Exhibit 120: GRS India Corp. - Overview
              • Exhibit 121: GRS India Corp. - Product / Service
              • Exhibit 122: GRS India Corp. - Key offerings
            • 12.7 Hi Tech Sweet Water Technologies Pvt. Ltd.
              • Exhibit 123: Hi Tech Sweet Water Technologies Pvt. Ltd. - Overview
              • Exhibit 124: Hi Tech Sweet Water Technologies Pvt. Ltd. - Product / Service
              • Exhibit 125: Hi Tech Sweet Water Technologies Pvt. Ltd. - Key offerings
            • 12.8 Netsol Water Solutions Pvt. Ltd.
              • Exhibit 126: Netsol Water Solutions Pvt. Ltd. - Overview
              • Exhibit 127: Netsol Water Solutions Pvt. Ltd. - Product / Service
              • Exhibit 128: Netsol Water Solutions Pvt. Ltd. - Key offerings
            • 12.9 Nevon Projects
              • Exhibit 129: Nevon Projects - Overview
              • Exhibit 130: Nevon Projects - Product / Service
              • Exhibit 131: Nevon Projects - Key offerings
            • 12.10 NEWater China
              • Exhibit 132: NEWater China - Overview
              • Exhibit 133: NEWater China - Product / Service
              • Exhibit 134: NEWater China - Key offerings
            • 12.11 Nuetech Solar Systems Pvt. Ltd.
              • Exhibit 135: Nuetech Solar Systems Pvt. Ltd. - Overview
              • Exhibit 136: Nuetech Solar Systems Pvt. Ltd. - Product / Service
              • Exhibit 137: Nuetech Solar Systems Pvt. Ltd. - Key offerings
            • 12.12 Power4 Industries Ltd.
              • Exhibit 138: Power4 Industries Ltd. - Overview
              • Exhibit 139: Power4 Industries Ltd. - Product / Service
              • Exhibit 140: Power4 Industries Ltd. - Key offerings
            • 12.13 Puralytics
              • Exhibit 141: Puralytics - Overview
              • Exhibit 142: Puralytics - Product / Service
              • Exhibit 143: Puralytics - Key offerings
            • 12.14 Solatron Inc.
              • Exhibit 144: Solatron Inc. - Overview
              • Exhibit 145: Solatron Inc. - Product / Service
              • Exhibit 146: Solatron Inc. - Key offerings
            • 12.15 Swajal Water Pvt. Ltd.
              • Exhibit 147: Swajal Water Pvt. Ltd. - Overview
              • Exhibit 148: Swajal Water Pvt. Ltd. - Product / Service
              • Exhibit 149: Swajal Water Pvt. Ltd. - Key offerings
            • 12.16 Tata Power Co. Ltd.
              • Exhibit 150: Tata Power Co. Ltd. - Overview
              • Exhibit 151: Tata Power Co. Ltd. - Business segments
              • Exhibit 152: Tata Power Co. Ltd. - Key offerings
              • Exhibit 153: Tata Power Co. Ltd. - Segment focus
            • 12.17 WattSun Energy India Pvt. Ltd.
              • Exhibit 154: WattSun Energy India Pvt. Ltd. - Overview
              • Exhibit 155: WattSun Energy India Pvt. Ltd. - Product / Service
              • Exhibit 156: WattSun Energy India Pvt. Ltd. - Key offerings

            13 Appendix

            • 13.1 Scope of the report
              • 13.2 Inclusions and exclusions checklist
                • Exhibit 157: Inclusions checklist
                • Exhibit 158: Exclusions checklist
              • 13.3 Currency conversion rates for US$
                • Exhibit 159: Currency conversion rates for US$
              • 13.4 Research methodology
                • Exhibit 160: Research methodology
                • Exhibit 161: Validation techniques employed for market sizing
                • Exhibit 162: Information sources
              • 13.5 List of abbreviations
                • Exhibit 163: List of abbreviations

              Research Methodology

              Technavio presents a detailed picture of the market by way of study, synthesis, and summation of data from multiple sources. The analysts have presented the various facets of the market with a particular focus on identifying the key industry influencers. The data thus presented is comprehensive, reliable, and the result of extensive research, both primary and secondary.

              INFORMATION SOURCES

              Primary sources

              • Manufacturers and suppliers
              • Channel partners
              • Industry experts
              • Strategic decision makers

              Secondary sources

              • Industry journals and periodicals
              • Government data
              • Financial reports of key industry players
              • Historical data
              • Press releases

              DATA ANALYSIS

              Data Synthesis

              • Collation of data
              • Estimation of key figures
              • Analysis of derived insights

              Data Validation

              • Triangulation with data models
              • Reference against proprietary databases
              • Corroboration with industry experts

              REPORT WRITING

              Qualitative

              • Market drivers
              • Market challenges
              • Market trends
              • Five forces analysis

              Quantitative

              • Market size and forecast
              • Market segmentation
              • Geographical insights
              • Competitive landscape

              Interested in this report?

              Get your sample now to see our research methodology and insights!

              Download Now

              Frequently Asked Questions

              Solar Purifiers market growth will increase by $ 277.93 mn during 2024-2028 .

              The Solar Purifiers market is expected to grow at a CAGR of 8.51% during 2024-2028 .

              Solar Purifiers market is segmented by Application( Portable, Stationary) Type( Water, Air)

              BHARAT SOLAR ENERGY, C AND B INTERNATIONAL HOLDINGS CO. LTD., COSMIC MICRO SYSTEMS PVT. LTD., Desolenator, GRS India Corp., H20 Heroes, Hi Tech Sweet Water Technologies Pvt. Ltd., HikePower Ltd., Netsol Water Solutions Pvt. Ltd., Nevon Projects, NEWater China, Nuetech Solar Systems Pvt. Ltd., Power4 Industries Ltd., Puralytics, Solar Water Plc, Solar Water Solutions Oy Ltd., Solatron Inc., Swajal Water Pvt. Ltd., Tata Power Co. Ltd., WattSun Energy India Pvt. Ltd. are a few of the key vendors in the Solar Purifiers market.

              APAC will register the highest growth rate of 38% among the other regions. Therefore, the Solar Purifiers market in APAC is expected to garner significant business opportunities for the vendors during the forecast period.

              US, China, India, Germany, UK

              • Increase in demand for energy-efficient purifiers is the driving factor this market.
              • sans-serif;">The preference for eco-friendly solar purifiers over conventional purifiers has been increasing as energy efficiency is becoming important for these appliances. Solar-based air purifiers work on the principle of providing clean air by using power from solar energy and are equipped with humidifying and dehumidifying systems. Ordinary air purifiers consume electricity continuously is the driving factor this market.
              • even more than that of a new refrigerator. At the same time is the driving factor this market.
              • energy-efficient air purifiers offer almost 40% energy savings. Most of the vendors in the market are now focusing on offering energy-efficient solar air purifiers.  is the driving factor this market.
              • sans-serif;">  is the driving factor this market.
              • sans-serif;">Government directives and regulatory agencies in North America and Europe have mandated energy-rating norms for electronic home appliances to save electric energy. These should be followed by vendors while manufacturing air purifiers. Several vendors in the market offer energy-efficient solar purifiers. New purifiers in the market have Energy Star ratings according to their energy consumption. This makes these solar purifiers eco-friendly and economical. The increasing preference for such energy-efficient purifiers is expected to augment the growth of the global solar purifiers market during the forecast period. is the driving factor this market.
              • sans-serif;">  is the driving factor this market.

              The Solar Purifiers market vendors should focus on grabbing business opportunities from the Portable segment as it accounted for the largest market share in the base year.