Industrial Filtration Market Analysis North America, Europe, APAC, South America, Middle East and Africa - US, Canada, China, Germany, UK - Size and Forecast 2024-2028

Industrial Filtration Market Analysis North America, Europe, APAC, South America, Middle East and Africa - US, Canada, China, Germany, UK - Size and Forecast 2024-2028

Published: Mar 2024 174 Pages SKU: IRTNTR44509

Market Overview at a Glance

$11.40 B
Market Opportunity
5.71%
CAGR
4.82
YoY growth 2023-2024(%)

Industrial Filtration Market Size 2024-2028 

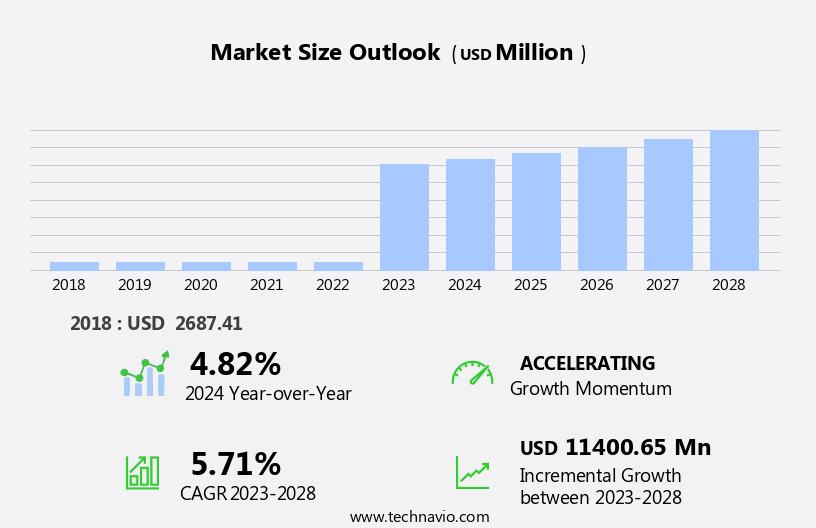
The industrial filtration market size is forecast to increase by USD 11.4 billion at a CAGR of 5.71% between 2023 and 2028.

  • The increasing number of oil refineries is a key driver of the industrial filtration market. As refineries expand, the need for efficient filtration systems to maintain product quality and meet environmental regulations grows. In response, innovations in industrial filtration equipment and industrial gas phase filtration systems by vendors are emerging as a key trend. These advancements focus on improving filtration efficiency, durability, and energy consumption, offering solutions that help industries reduce operational costs while meeting stricter standards for air, water, and waste management
  • However, the lack of regular maintenance remains a challenge, leading to equipment failures and increased operational costs. To mitigate this issue, there is a growing emphasis on implementing preventive maintenance strategies and utilizing predictive maintenance technologies. Overall, the market is poised for continued growth as industries seek to improve their production processes and reduce waste.

What will be the Size of the Industrial Filtration Market During the Forecast Period?

Industrial Filtration Market Size

 Request Free Sample

  • The market encompasses a range of filtration solutions designed to address emissions reduction and particle separation needs in various industries, including petroleum refineries and petrochemical plants. Crude oil and its derivatives, such as gasoline, diesel, and jet fuel, generate substantial volumes of airborne and liquid particles that necessitate effective filtration systems. Filter media technologies, including ultrafiltration, centrifugal filtration, surface filtration, horizontal filtration, cross-flow filtration, and cake filtration, are employed to capture dust particles and airborne particles. Electrical equipment and industrial processes also require air filtration to ensure optimal performance and prevent damage from particulate matter. Water filtration systems are essential for treating process water and ensuring compliance with environmental regulations.
  • With increasing awareness of airborne diseases, there is growing demand for advanced filtration equipment and separation systems. The industrial revolution has led to the development of advanced filtration technologies, such as activated carbon filters, air purifiers, and water filters, to address diverse filtration requirements.

How is this Industrial Filtration Industry segmented and which is the largest segment?

The industrial filtration industry research report provides comprehensive data (region-wise segment analysis), with forecasts and estimates in "USD billion" for the period 2024-2028, as well as historical data from 2018-2022 for the following segments. 

  • Product
    • Industrial liquid filtration
    • Industrial air filtration
  • Application
    • Food and beverage
    • Chemicals and petrochemicals
    • Power generation
    • Others
  • Filter Media
    • Activated carbon/Charcoal
    • Fiberglass
    • Filter paper
    • Metal
    • Non-woven fabric
    • Others
  • Geography
    • North America
      • Canada
      • US
    • Europe
      • Germany
      • UK
    • APAC
      • China
    • South America
    • Middle East and Africa

By Product Insights

The industrial liquid filtration segment is estimated to witness significant growth during the forecast period. Industrial liquid filtration involves the separation of solids from liquids using filtering media, allowing only the purified liquid to pass. This process is crucial in various industries, including oil and gas, petrochemicals, pharmaceuticals, and power generation. Compliance with regulations and stringent requirements, particularly In the food and beverage sector, drives the growth of this market. Techniques such as ultrafiltration, centrifugal filtration, and surface filtration are employed to remove contaminants like dust particles and airborne particles. Filter media like Activated Carbon/Charcoal, Fiberglass, Filter Paper, Metal, and Nonwoven Fabric are commonly used. Applications include fuel filtration, cooling water filtration, and wastewater treatment.

The market expansion is influenced by the need for filtration in industries such as petroleum refineries, petrochemical plants, and power generation, as well as the increasing demand for water filtration systems due to environmental concerns and pollution mitigation.

Industrial Filtration Market Size

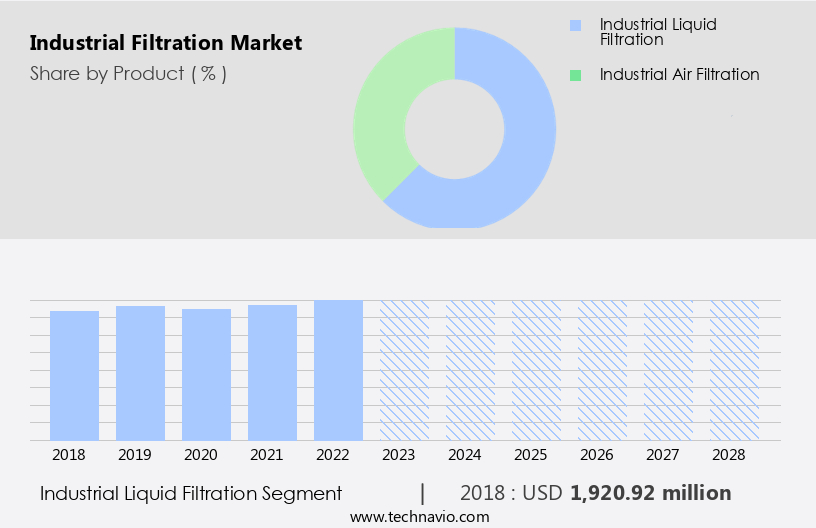
Get a glance at the share of various segments. Request Free Sample

The Industrial liquid filtration segment was valued at USD 1.92 billion in 2018 and showed a gradual increase during the forecast period.

Regional Analysis

North America is estimated to contribute 50% to the growth of the global market during the forecast period. Technavio's analysts have elaborately explained the regional trends and drivers that shape the market during the forecast period.

Industrial Filtration Market Share by Geography

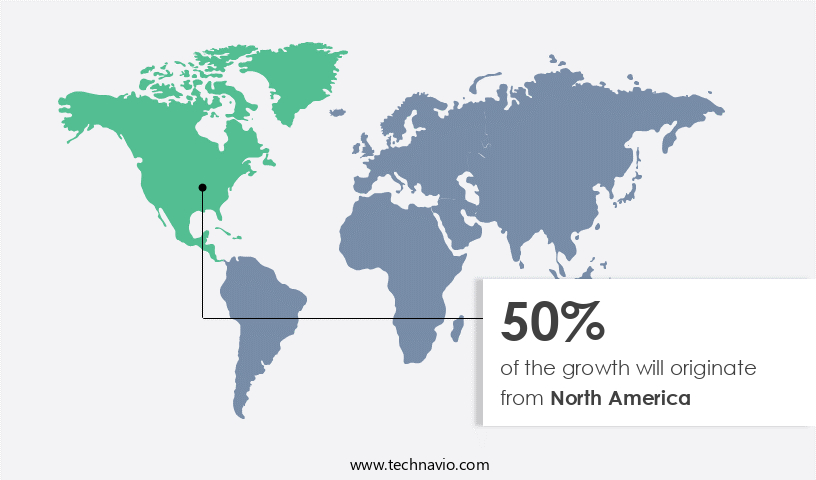
For more insights on the market share of various regions, Request Free Sample

The market in North America is experiencing growth due to the increasing demand for wastewater treatment In the chemical industry. Industrial filters are essential In the chemical processing sector, which produces intermediate products for various industries, including agriculture, rubber, plastics, textiles, pulp and paper, and petroleum. The US chemical industry is expanding due to the low cost of natural gas, revitalizing the petrochemical sector after years of decline. Industrial filtration solutions are integral to numerous applications, including emissions control, real-time monitoring, and the processing of crude oil, gasoline, diesel, jet fuel, petrochemicals, plastics, pharmaceuticals, and more. Filtration technologies include filter media such as Activated Carbon/Charcoal, Fiberglass, Filter Paper, Metal, and Nonwoven Fabric, as well as filtration methods like Ultrafiltration, Centrifugal filtration, Surface filtration, Horizontal filtration, Cross-flow filtration, and Cake filtration.

These filtration systems are crucial for various industries, including power generation, oil and gas, metals & mining, automotive, and water treatment. Effective filtration systems help prevent environmental damage by reducing contaminants and pollution, ensuring the production of cleaner products and reducing the risk of airborne diseases.

Market Dynamics

Our  researchers analyzed the data with 2023 as the base year, along with the key drivers, trends, and challenges. A holistic analysis of drivers will help companies refine their marketing strategies to gain a competitive advantage.

What are the key market drivers leading to the rise In the adoption of Industrial Filtration Industry?

Increasing number of oil refineries is the key driver of the market.

  • Industrial filtration plays a crucial role in petroleum refineries and petrochemical plants by capturing contaminants, such as rust and scale, that can cause equipment damage and hinder process performance. The implementation of filtration solutions leads to several benefits, including reduced downtime, lower maintenance costs, and increased operating efficiencies. These advantages are particularly significant In the context of growing investments in refinery expansions and upgrades. For instance, the Dangote Refinery in Nigeria, which officially opened on May 22, 2023, is an example of such investments. The market is poised for growth due to the expanding demand for filtration systems in various industries, including oil and gas, power generation, metals and mining, automotive, and chemicals & petrochemicals.
  • Filtration systems are essential for the effective separation of matter from fluids and gases. In the context of the oil and gas industry, filtration is used to remove impurities from crude oil, resulting In the production of cleaner fuels such as gasoline, diesel, and jet fuel. In petrochemical plants, filtration is employed to produce high-purity petrochemicals, including plastics, pharmaceuticals, and other chemicals. The filtration market encompasses various filtration technologies, including air filtration, separation systems, and water filtration systems. Filter media such as Activated Carbon/Charcoal, Fiberglass, Filter Paper, Metal, and Nonwoven Fabric are used in different filtration applications. Ultrafiltration, centrifugal filtration, surface filtration, horizontal filtration, cross-flow filtration, cake filtration, and electrical equipment are some of the filtration techniques used In the industry.
  • Airborne particles, dust particles, and water pollution are significant environmental concerns that filtration systems address. The nonwoven segment and activated carbon segment are expected to dominate the filtration market due to their high demand in various industries. Filtration technology is also used in renewable energy sources, power plants, and various other applications, including vehicle production, semiconductors, microelectronics, and mines and minerals. In conclusion, the market is driven by the increasing demand for cleaner fuels, high-purity chemicals, and the need to address environmental concerns. The implementation of filtration systems leads to improved process performance, reduced downtime, and lower maintenance costs, making it a valuable investment for various industries.

What are the market trends shaping the Industrial Filtration Industry?

Innovations in industrial filtration equipment by vendors is the upcoming market trend.

  • Industrial filtration plays a crucial role in various industries such as petroleum refineries, petrochemical plants, and power generation, ensuring the efficient separation of contaminants and emissions. Technological advancements have led to the development of innovative filtration solutions, including ultrafiltration, centrifugal filtration, surface filtration, horizontal filtration, cross-flow filtration, and cake filtration. These filtration systems help industries address environmental concerns by reducing pollution and minimizing the disposal of chemicals and wastewater. Manufacturers invest heavily in research and development to offer a diverse range of filter media, such as Activated Carbon/Charcoal, Fiberglass, Filter Paper, Metal, and Nonwoven Fabric, catering to specific industry needs.
  • For instance, the petrochemical industry requires filters for petroleum products like crude oil, gasoline, diesel, jet fuel, and petrochemicals, while the pharmaceutical industry focuses on filter media for chemicals and pharmaceuticals. The nonwoven segment and activated carbon segment are expected to dominate the market due to their high demand in various applications, including air filtration, separation systems, and water filtration systems. Industrial air filtration is essential in industries like automotive, electronics, and power plants, where airborne particles can cause airborne diseases. In May 2021, Eaton Corporation Plc introduced an optimized version of the IFPM 33 mobile, offline fluid purifier system, capable of removing particulate contamination down to 3 mm, free water, free and dissolved gases, and light to heavy lubricating oils.
  • This fully automated, PLC-controlled purifier system caters to applications with high moisture content, such as marine, offshore, pulp and paper, and hydroelectric power. By investing in advanced filtration technology, industries can minimize environmental damage and ensure the production of high-quality products.

What challenges does the Industrial Filtration Industry face during its growth?

Filtration equipment failures due to less maintenance is a key challenge affecting the industry growth.

  • Industrial filtration plays a crucial role in maintaining the efficiency and productivity of various industries, including petroleum refineries, petrochemical plants, power generation, and oil and gas. Filtration solutions help mitigate emissions, monitor real-time filter performance, and prevent environmental damage caused by contaminants and pollution. The market for filtration solutions In the US is vast and diverse, catering to industries that deal with crude oil, gasoline, diesel, jet fuel, petrochemicals, plastics, pharmaceuticals, and more. Filtration technology encompasses various methods, such as ultrafiltration, centrifugal filtration, surface filtration, horizontal filtration, cross-flow filtration, cake filtration, and others. Filter media, including Activated Carbon/Charcoal, Fiberglass, Filter Paper, Metal, and Nonwoven Fabric, are essential components of filtration systems.
  • These media help capture dust particles, airborne particles, and other contaminants, ensuring the purity and quality of the output. Maintenance and downtime are critical factors in industrial operations. Regular filter monitoring, pressure drop assessment, and timely filter replacement help minimize downtime and ensure optimal performance. Effective filtration systems contribute to wastewater treatment, water pollution reduction, and the prevention of airborne diseases. The filtration market In the US is driven by the increasing demand for cleaner production processes, stringent regulations, and the growing focus on renewable energy sources and sustainable practices. Industries such as electronics, semiconductors, and mines and minerals also rely on filtration technology for their operations.
  • In conclusion, filtration solutions are essential for various industries In the US, contributing to improved efficiency, productivity, and sustainability. Effective filtration systems help minimize downtime, reduce contaminants, and ensure the production of high-quality output.

Exclusive Customer Landscape

The industrial filtration market forecasting report includes the adoption lifecycle of the market, covering from the innovator's stage to the laggard's stage. It focuses on adoption rates in different regions based on penetration. Furthermore, the industrial filtration market report also includes key purchase criteria and drivers of price sensitivity to help companies evaluate and develop their market growth analysis strategies.

Industrial Filtration Market Share by Geography

 Customer Landscape

Key Companies & Market Insights

Companies are implementing various strategies, such as strategic alliances, industrial filtration market forecast, partnerships, mergers and acquisitions, geographical expansion, and product/service launches, to enhance their presence In the industry.

3M Co. - The market encompasses a range of solutions designed to remove impurities from various industrial processes. One notable provider offers the 3M Micro Klean RT Series filter, the 3M Metal Ion Purifier SCP Series Filter cartridge, and the 3M Betapure AUL Series Filter cartridge. These filtration offerings cater to diverse industries, ensuring efficient separation of particles and contaminants for improved process performance and product quality. The 3M Micro Klean RT Series filter delivers superior filtration efficiency, while the 3M Metal Ion Purifier SCP Series Filter cartridge effectively removes metal ions. The 3M Betapure AUL Series Filter cartridge is designed for ultrafiltration applications, providing reliable separation of suspended solids and macromolecules. With a focus on innovation and quality, this company's industrial filtration solutions enhance operational efficiency and contribute to sustainable industrial processes.

The industry research and growth report includes detailed analyses of the competitive landscape of the market and information about key companies, including:

  • 3M Co.
  • Alfa Laval AB
  • Atmus Filtration Technologies Inc.
  • Boll and Kirch Filterbau GmbH
  • Camfil AB
  • Danaher Corp.
  • Donaldson Co. Inc.
  • DuPont de Nemours Inc.
  • Eaton Corp. Plc
  • Ecolab Inc.
  • Entegris Inc.
  • Filtration Group Corp.
  • Freudenberg and Co. KG
  • GEA Group AG
  • Graver Technologies LLC
  • Hengst SE
  • Lenntech BV
  • MANN HUMMEL International GmbH and Co. KG
  • Parker Hannifin Corp.
  • Pentair Plc
  • Russell Finex Ltd.
  • Siemens AG
  • Synder Filtration Inc.
  • Xylem Inc.

Qualitative and quantitative analysis of companies has been conducted to help clients understand the wider business environment as well as the strengths and weaknesses of key industry players. Data is qualitatively analyzed to categorize companies as pure play, category-focused, industry-focused, and diversified; it is quantitatively analyzed to categorize companies as dominant, leading, strong, tentative, and weak.

Research Analyst Overview

Industrial filtration plays a crucial role in various industries, ensuring the separation and purification of fluids and gases. This process is essential for mitigating emissions, preventing environmental damage, and maintaining the quality of final products. Real-time monitoring and effective filtration systems are vital in industries such as petroleum refineries and petrochemical plants. The demand for filtration solutions is driven by the need to remove contaminants, including dust particles and airborne particles, from industrial processes. These contaminants can lead to environmental damage, pollution, and potential health hazards. Filtration systems are employed in various industries, including power generation, oil and gas, metals and mining, automotive, and water treatment.

Filter media, such as activated carbon/charcoal, fiberglass, filter paper, metal, and nonwoven fabric, are used extensively in filtration processes. Different filtration techniques, including ultrafiltration, centrifugal filtration, surface filtration, horizontal filtration, cross-flow filtration, and cake filtration, are utilized based on the specific requirements of the application. Filtration technology has evolved significantly over the years, with advancements in materials and filtration methods. For instance, nanofiber filters have gained popularity due to their high filtration efficiency and low pressure drop. Electrical equipment, such as air filtration systems, separation systems, and water filtration systems, are integral components of various industries, ensuring the cleanliness and quality of the air and water used In their processes.

The industrial revolution brought about a significant increase In the demand for filtration solutions, with the need to address the environmental challenges arising from industrialization. Today, filtration technology continues to play a crucial role in addressing the challenges of various industries, including the removal of contaminants from wastewater treatment systems and the prevention of airborne diseases in power plants and vehicle production facilities. The integration of renewable energy sources, such as wind and solar power, into the power generation sector has also increased the demand for filtration solutions. Filtration technology is employed In the production of raw materials, such as cement, steel, textiles, fertilizers, paints and inks, chemicals, electronics, and mines and minerals, ensuring the quality and purity of the final products.

In conclusion, industrial filtration is a critical process that ensures the separation and purification of fluids and gases in various industries. The demand for filtration solutions is driven by the need to mitigate emissions, prevent environmental damage, and maintaIn the quality of final products. Filtration technology continues to evolve, with advancements in materials and filtration methods addressing the specific requirements of various industries.

Market Scope

Report Coverage

Details

Page number

174

Base year

2023

Historic period

2018-2022

Forecast period

2024-2028

Growth momentum & CAGR

Accelerate at a CAGR of 5.71%

Market growth 2024-2028

USD 11400.65 million

Market structure

Fragmented

YoY growth 2023-2024(%)

4.82

Key countries

US, Canada, China, Germany, and UK

Competitive landscape

Leading Companies, Market Positioning of Companies, Competitive Strategies, and Industry Risks

Request Free Sample

What are the Key Data Covered in this Industrial Filtration Market Research and Growth Report?

  • CAGR of the Industrial Filtration industry during the forecast period
  • Detailed information on factors that will drive the growth and forecasting between 2024 and 2028
  • Precise estimation of the size of the market and its contribution of the industry in focus to the parent market
  • Accurate predictions about upcoming growth and trends and changes in consumer behaviour
  • Growth of the market across North America, Europe, APAC, South America, and Middle East and Africa
  • Thorough analysis of the market's competitive landscape and detailed information about companies
  • Comprehensive analysis of factors that will challenge the industrial filtration market growth of industry companies

We can help! Our analysts can customize this industrial filtration market research report to meet your requirements.

Get in touch

1 Executive Summary

  • 1.1 Market overview
    • Exhibit 01: Executive Summary – Chart on Market Overview
    • Exhibit 02: Executive Summary – Data Table on Market Overview
    • Exhibit 03: Executive Summary – Chart on Global Market Characteristics
    • Exhibit 04: Executive Summary – Chart on Market by Geography
    • Exhibit 05: Executive Summary – Chart on Market Segmentation by Product
    • Exhibit 06: Executive Summary – Chart on Market Segmentation by Application
    • Exhibit 07: Executive Summary – Chart on Incremental Growth
    • Exhibit 08: Executive Summary – Data Table on Incremental Growth
    • Exhibit 09: Executive Summary – Chart on Vendor Market Positioning

2 Market Landscape

  • 2.1 Market ecosystem
    • Exhibit 10: Parent market
    • Exhibit 11: Market Characteristics

3 Market Sizing

  • 3.1 Market definition
    • Exhibit 12: Offerings of vendors included in the market definition
  • 3.2 Market segment analysis
    • Exhibit 13: Market segments
  • 3.3 Market size 2023
    • 3.4 Market outlook: Forecast for 2023-2028
      • Exhibit 14: Chart on Global - Market size and forecast 2023-2028 ($ million)
      • Exhibit 15: Data Table on Global - Market size and forecast 2023-2028 ($ million)
      • Exhibit 16: Chart on Global Market: Year-over-year growth 2023-2028 (%)
      • Exhibit 17: Data Table on Global Market: Year-over-year growth 2023-2028 (%)

    4 Historic Market Size

    • 4.1 Global industrial filtration market 2018 - 2022
      • Exhibit 18: Historic Market Size – Data Table on global industrial filtration market 2018 - 2022 ($ million)
    • 4.2 Product Segment Analysis 2018 - 2022
      • Exhibit 19: Historic Market Size – Product Segment 2018 - 2022 ($ million)
    • 4.3 Application Segment Analysis 2018 - 2022
      • Exhibit 20: Historic Market Size – Application Segment 2018 - 2022 ($ million)
    • 4.4 Geography Segment Analysis 2018 - 2022
      • Exhibit 21: Historic Market Size – Geography Segment 2018 - 2022 ($ million)
    • 4.5 Country Segment Analysis 2018 - 2022
      • Exhibit 22: Historic Market Size – Country Segment 2018 - 2022 ($ million)

    5 Five Forces Analysis

    • 5.1 Five forces summary
      • Exhibit 23: Five forces analysis - Comparison between 2023 and 2028
    • 5.2 Bargaining power of buyers
      • Exhibit 24: Chart on Bargaining power of buyers – Impact of key factors 2023 and 2028
    • 5.3 Bargaining power of suppliers
      • Exhibit 25: Bargaining power of suppliers – Impact of key factors in 2023 and 2028
    • 5.4 Threat of new entrants
      • Exhibit 26: Threat of new entrants – Impact of key factors in 2023 and 2028
    • 5.5 Threat of substitutes
      • Exhibit 27: Threat of substitutes – Impact of key factors in 2023 and 2028
    • 5.6 Threat of rivalry
      • Exhibit 28: Threat of rivalry – Impact of key factors in 2023 and 2028
    • 5.7 Market condition
      • Exhibit 29: Chart on Market condition - Five forces 2023 and 2028

    6 Market Segmentation by Product

    • 6.1 Market segments
      • Exhibit 30: Chart on Product - Market share 2023-2028 (%)
      • Exhibit 31: Data Table on Product - Market share 2023-2028 (%)
    • 6.2 Comparison by Product
      • Exhibit 32: Chart on Comparison by Product
      • Exhibit 33: Data Table on Comparison by Product
    • 6.3 Industrial liquid filtration - Market size and forecast 2023-2028
      • Exhibit 34: Chart on Industrial liquid filtration - Market size and forecast 2023-2028 ($ million)
      • Exhibit 35: Data Table on Industrial liquid filtration - Market size and forecast 2023-2028 ($ million)
      • Exhibit 36: Chart on Industrial liquid filtration - Year-over-year growth 2023-2028 (%)
      • Exhibit 37: Data Table on Industrial liquid filtration - Year-over-year growth 2023-2028 (%)
    • 6.4 Industrial air filtration - Market size and forecast 2023-2028
      • Exhibit 38: Chart on Industrial air filtration - Market size and forecast 2023-2028 ($ million)
      • Exhibit 39: Data Table on Industrial air filtration - Market size and forecast 2023-2028 ($ million)
      • Exhibit 40: Chart on Industrial air filtration - Year-over-year growth 2023-2028 (%)
      • Exhibit 41: Data Table on Industrial air filtration - Year-over-year growth 2023-2028 (%)
    • 6.5 Market opportunity by Product
      • Exhibit 42: Market opportunity by Product ($ million)
      • Exhibit 43: Data Table on Market opportunity by Product ($ million)

    7 Market Segmentation by Application

    • 7.1 Market segments
      • Exhibit 44: Chart on Application - Market share 2023-2028 (%)
      • Exhibit 45: Data Table on Application - Market share 2023-2028 (%)
    • 7.2 Comparison by Application
      • Exhibit 46: Chart on Comparison by Application
      • Exhibit 47: Data Table on Comparison by Application
    • 7.3 Food and beverage - Market size and forecast 2023-2028
      • Exhibit 48: Chart on Food and beverage - Market size and forecast 2023-2028 ($ million)
      • Exhibit 49: Data Table on Food and beverage - Market size and forecast 2023-2028 ($ million)
      • Exhibit 50: Chart on Food and beverage - Year-over-year growth 2023-2028 (%)
      • Exhibit 51: Data Table on Food and beverage - Year-over-year growth 2023-2028 (%)
    • 7.4 Chemicals and petrochemicals - Market size and forecast 2023-2028
      • Exhibit 52: Chart on Chemicals and petrochemicals - Market size and forecast 2023-2028 ($ million)
      • Exhibit 53: Data Table on Chemicals and petrochemicals - Market size and forecast 2023-2028 ($ million)
      • Exhibit 54: Chart on Chemicals and petrochemicals - Year-over-year growth 2023-2028 (%)
      • Exhibit 55: Data Table on Chemicals and petrochemicals - Year-over-year growth 2023-2028 (%)
    • 7.5 Power generation - Market size and forecast 2023-2028
      • Exhibit 56: Chart on Power generation - Market size and forecast 2023-2028 ($ million)
      • Exhibit 57: Data Table on Power generation - Market size and forecast 2023-2028 ($ million)
      • Exhibit 58: Chart on Power generation - Year-over-year growth 2023-2028 (%)
      • Exhibit 59: Data Table on Power generation - Year-over-year growth 2023-2028 (%)
    • 7.6 Others - Market size and forecast 2023-2028
      • Exhibit 60: Chart on Others - Market size and forecast 2023-2028 ($ million)
      • Exhibit 61: Data Table on Others - Market size and forecast 2023-2028 ($ million)
      • Exhibit 62: Chart on Others - Year-over-year growth 2023-2028 (%)
      • Exhibit 63: Data Table on Others - Year-over-year growth 2023-2028 (%)
    • 7.7 Market opportunity by Application
      • Exhibit 64: Market opportunity by Application ($ million)
      • Exhibit 65: Data Table on Market opportunity by Application ($ million)

    8 Market Segmentation by Filter Media

    • 8.1 Market segments
      • Chart on Filter Media - Market share (2023-2028) (%)
      • Data Table on Filter Media - Market share (2023-2028) (%)
    • 8.2 Comparison by Filter Media
      • Chart on Comparison by Filter Media
      • Data Table on Comparison by Filter Media
    • 8.3 Activated carbon/Charcoal - Market size and forecast (2023-2028)
      • Chart on Activated carbon/Charcoal - Market size and forecast (2023-2028) ($ million)
      • Data Table on Activated carbon/Charcoal - Market size and forecast (2023-2028) ($ million)
      • Chart on Activated carbon/Charcoal - Year-over-year growth (2023-2028) (%)
      • Data Table on Activated carbon/Charcoal - Year-over-year growth (2023-2028) (%)
    • 8.4 Fiberglass - Market size and forecast (2023-2028)
      • Chart on Fiberglass - Market size and forecast (2023-2028) ($ million)
      • Data Table on Fiberglass - Market size and forecast (2023-2028) ($ million)
      • Chart on Fiberglass - Year-over-year growth (2023-2028) (%)
      • Data Table on Fiberglass - Year-over-year growth (2023-2028) (%)
    • 8.5 Filter paper - Market size and forecast (2023-2028)
      • Chart on Filter paper - Market size and forecast (2023-2028) ($ million)
      • Data Table on Filter paper - Market size and forecast (2023-2028) ($ million)
      • Chart on Filter paper - Year-over-year growth (2023-2028) (%)
      • Data Table on Filter paper - Year-over-year growth (2023-2028) (%)
    • 8.6 Metal - Market size and forecast (2023-2028)
      • Chart on Metal - Market size and forecast (2023-2028) ($ million)
      • Data Table on Metal - Market size and forecast (2023-2028) ($ million)
      • Chart on Metal - Year-over-year growth (2023-2028) (%)
      • Data Table on Metal - Year-over-year growth (2023-2028) (%)
    • 8.7 Non-woven fabric - Market size and forecast (2023-2028)
      • Chart on Non-woven fabric - Market size and forecast (2023-2028) ($ million)
      • Data Table on Non-woven fabric - Market size and forecast (2023-2028) ($ million)
      • Chart on Non-woven fabric - Year-over-year growth (2023-2028) (%)
      • Data Table on Non-woven fabric - Year-over-year growth (2023-2028) (%)
    • 8.8 Others - Market size and forecast (2023-2028)
      • Chart on Others - Market size and forecast (2023-2028) ($ million)
      • Data Table on Others - Market size and forecast (2023-2028) ($ million)
      • Chart on Others - Year-over-year growth (2023-2028) (%)
      • Data Table on Others - Year-over-year growth (2023-2028) (%)
    • 8.9 Market opportunity by Filter Media
      • Market opportunity by $segment_name ($ million)
      • Data Table on Market opportunity by $segment_name ($ million)

    8 Customer Landscape

    • 8.1 Customer landscape overview
      • Exhibit 66: Analysis of price sensitivity, lifecycle, customer purchase basket, adoption rates, and purchase criteria

    9 Geographic Landscape

    • 9.1 Geographic segmentation
      • Exhibit 67: Chart on Market share by geography 2023-2028 (%)
      • Exhibit 68: Data Table on Market share by geography 2023-2028 (%)
    • 9.2 Geographic comparison
      • Exhibit 69: Chart on Geographic comparison
      • Exhibit 70: Data Table on Geographic comparison
    • 9.3 North America - Market size and forecast 2023-2028
      • Exhibit 71: Chart on North America - Market size and forecast 2023-2028 ($ million)
      • Exhibit 72: Data Table on North America - Market size and forecast 2023-2028 ($ million)
      • Exhibit 73: Chart on North America - Year-over-year growth 2023-2028 (%)
      • Exhibit 74: Data Table on North America - Year-over-year growth 2023-2028 (%)
    • 9.4 Europe - Market size and forecast 2023-2028
      • Exhibit 75: Chart on Europe - Market size and forecast 2023-2028 ($ million)
      • Exhibit 76: Data Table on Europe - Market size and forecast 2023-2028 ($ million)
      • Exhibit 77: Chart on Europe - Year-over-year growth 2023-2028 (%)
      • Exhibit 78: Data Table on Europe - Year-over-year growth 2023-2028 (%)
    • 9.5 APAC - Market size and forecast 2023-2028
      • Exhibit 79: Chart on APAC - Market size and forecast 2023-2028 ($ million)
      • Exhibit 80: Data Table on APAC - Market size and forecast 2023-2028 ($ million)
      • Exhibit 81: Chart on APAC - Year-over-year growth 2023-2028 (%)
      • Exhibit 82: Data Table on APAC - Year-over-year growth 2023-2028 (%)
    • 9.6 South America - Market size and forecast 2023-2028
      • Exhibit 83: Chart on South America - Market size and forecast 2023-2028 ($ million)
      • Exhibit 84: Data Table on South America - Market size and forecast 2023-2028 ($ million)
      • Exhibit 85: Chart on South America - Year-over-year growth 2023-2028 (%)
      • Exhibit 86: Data Table on South America - Year-over-year growth 2023-2028 (%)
    • 9.7 Middle East and Africa - Market size and forecast 2023-2028
      • Exhibit 87: Chart on Middle East and Africa - Market size and forecast 2023-2028 ($ million)
      • Exhibit 88: Data Table on Middle East and Africa - Market size and forecast 2023-2028 ($ million)
      • Exhibit 89: Chart on Middle East and Africa - Year-over-year growth 2023-2028 (%)
      • Exhibit 90: Data Table on Middle East and Africa - Year-over-year growth 2023-2028 (%)
    • 9.8 US - Market size and forecast 2023-2028
      • Exhibit 91: Chart on US - Market size and forecast 2023-2028 ($ million)
      • Exhibit 92: Data Table on US - Market size and forecast 2023-2028 ($ million)
      • Exhibit 93: Chart on US - Year-over-year growth 2023-2028 (%)
      • Exhibit 94: Data Table on US - Year-over-year growth 2023-2028 (%)
    • 9.9 Canada - Market size and forecast 2023-2028
      • Exhibit 95: Chart on Canada - Market size and forecast 2023-2028 ($ million)
      • Exhibit 96: Data Table on Canada - Market size and forecast 2023-2028 ($ million)
      • Exhibit 97: Chart on Canada - Year-over-year growth 2023-2028 (%)
      • Exhibit 98: Data Table on Canada - Year-over-year growth 2023-2028 (%)
    • 9.10 Germany - Market size and forecast 2023-2028
      • Exhibit 99: Chart on Germany - Market size and forecast 2023-2028 ($ million)
      • Exhibit 100: Data Table on Germany - Market size and forecast 2023-2028 ($ million)
      • Exhibit 101: Chart on Germany - Year-over-year growth 2023-2028 (%)
      • Exhibit 102: Data Table on Germany - Year-over-year growth 2023-2028 (%)
    • 9.11 UK - Market size and forecast 2023-2028
      • Exhibit 103: Chart on UK - Market size and forecast 2023-2028 ($ million)
      • Exhibit 104: Data Table on UK - Market size and forecast 2023-2028 ($ million)
      • Exhibit 105: Chart on UK - Year-over-year growth 2023-2028 (%)
      • Exhibit 106: Data Table on UK - Year-over-year growth 2023-2028 (%)
    • 9.12 China - Market size and forecast 2023-2028
      • Exhibit 107: Chart on China - Market size and forecast 2023-2028 ($ million)
      • Exhibit 108: Data Table on China - Market size and forecast 2023-2028 ($ million)
      • Exhibit 109: Chart on China - Year-over-year growth 2023-2028 (%)
      • Exhibit 110: Data Table on China - Year-over-year growth 2023-2028 (%)
    • 9.13 Market opportunity by geography
      • Exhibit 111: Market opportunity by geography ($ million)
      • Exhibit 112: Data Tables on Market opportunity by geography ($ million)

    10 Drivers, Challenges, and Trends

    • 10.1 Market drivers
      • 10.2 Market challenges
        • 10.3 Impact of drivers and challenges
          • Exhibit 113: Impact of drivers and challenges in 2023 and 2028
        • 10.4 Market trends

          11 Vendor Landscape

          • 11.1 Overview
            • 11.2 Vendor landscape
              • Exhibit 114: Overview on Criticality of inputs and Factors of differentiation
            • 11.3 Landscape disruption
              • Exhibit 115: Overview on factors of disruption
            • 11.4 Industry risks
              • Exhibit 116: Impact of key risks on business

            12 Vendor Analysis

            • 12.1 Vendors covered
              • Exhibit 117: Vendors covered
            • 12.2 Market positioning of vendors
              • Exhibit 118: Matrix on vendor position and classification
            • 12.3 3M Co.
              • Exhibit 119: 3M Co. - Overview
              • Exhibit 120: 3M Co. - Business segments
              • Exhibit 121: 3M Co. - Key news
              • Exhibit 122: 3M Co. - Key offerings
              • Exhibit 123: 3M Co. - Segment focus
            • 12.4 Alfa Laval AB
              • Exhibit 124: Alfa Laval AB - Overview
              • Exhibit 125: Alfa Laval AB - Business segments
              • Exhibit 126: Alfa Laval AB - Key news
              • Exhibit 127: Alfa Laval AB - Key offerings
              • Exhibit 128: Alfa Laval AB - Segment focus
            • 12.5 Boll and Kirch Filterbau GmbH
              • Exhibit 129: Boll and Kirch Filterbau GmbH - Overview
              • Exhibit 130: Boll and Kirch Filterbau GmbH - Product / Service
              • Exhibit 131: Boll and Kirch Filterbau GmbH - Key offerings
            • 12.6 Danaher Corp.
              • Exhibit 132: Danaher Corp. - Overview
              • Exhibit 133: Danaher Corp. - Business segments
              • Exhibit 134: Danaher Corp. - Key news
              • Exhibit 135: Danaher Corp. - Key offerings
              • Exhibit 136: Danaher Corp. - Segment focus
            • 12.7 Donaldson Co. Inc.
              • Exhibit 137: Donaldson Co. Inc. - Overview
              • Exhibit 138: Donaldson Co. Inc. - Business segments
              • Exhibit 139: Donaldson Co. Inc. - Key news
              • Exhibit 140: Donaldson Co. Inc. - Key offerings
              • Exhibit 141: Donaldson Co. Inc. - Segment focus
            • 12.8 Eaton Corp. Plc
              • Exhibit 142: Eaton Corp. Plc - Overview
              • Exhibit 143: Eaton Corp. Plc - Business segments
              • Exhibit 144: Eaton Corp. Plc - Key offerings
              • Exhibit 145: Eaton Corp. Plc - Segment focus
            • 12.9 Entegris Inc.
              • Exhibit 146: Entegris Inc. - Overview
              • Exhibit 147: Entegris Inc. - Business segments
              • Exhibit 148: Entegris Inc. - Key offerings
              • Exhibit 149: Entegris Inc. - Segment focus
            • 12.10 Filtration Group Corp.
              • Exhibit 150: Filtration Group Corp. - Overview
              • Exhibit 151: Filtration Group Corp. - Product / Service
              • Exhibit 152: Filtration Group Corp. - Key offerings
            • 12.11 Freudenberg and Co. KG
              • Exhibit 153: Freudenberg and Co. KG - Overview
              • Exhibit 154: Freudenberg and Co. KG - Business segments
              • Exhibit 155: Freudenberg and Co. KG - Key news
              • Exhibit 156: Freudenberg and Co. KG - Key offerings
              • Exhibit 157: Freudenberg and Co. KG - Segment focus
            • 12.12 Lenntech BV
              • Exhibit 158: Lenntech BV - Overview
              • Exhibit 159: Lenntech BV - Product / Service
              • Exhibit 160: Lenntech BV - Key offerings
            • 12.13 MANN HUMMEL International GmbH and Co. KG
              • Exhibit 161: MANN HUMMEL International GmbH and Co. KG - Overview
              • Exhibit 162: MANN HUMMEL International GmbH and Co. KG - Business segments
              • Exhibit 163: MANN HUMMEL International GmbH and Co. KG - Key offerings
              • Exhibit 164: MANN HUMMEL International GmbH and Co. KG - Segment focus
            • 12.14 Parker Hannifin Corp.
              • Exhibit 165: Parker Hannifin Corp. - Overview
              • Exhibit 166: Parker Hannifin Corp. - Business segments
              • Exhibit 167: Parker Hannifin Corp. - Key news
              • Exhibit 168: Parker Hannifin Corp. - Key offerings
              • Exhibit 169: Parker Hannifin Corp. - Segment focus
            • 12.15 Pentair Plc
              • Exhibit 170: Pentair Plc - Overview
              • Exhibit 171: Pentair Plc - Business segments
              • Exhibit 172: Pentair Plc - Key news
              • Exhibit 173: Pentair Plc - Key offerings
              • Exhibit 174: Pentair Plc - Segment focus
            • 12.16 Russell Finex Ltd.
              • Exhibit 175: Russell Finex Ltd. - Overview
              • Exhibit 176: Russell Finex Ltd. - Product / Service
              • Exhibit 177: Russell Finex Ltd. - Key offerings
            • 12.17 Synder Filtration Inc.
              • Exhibit 178: Synder Filtration Inc. - Overview
              • Exhibit 179: Synder Filtration Inc. - Product / Service
              • Exhibit 180: Synder Filtration Inc. - Key offerings

            13 Appendix

            • 13.1 Scope of the report
              • 13.2 Inclusions and exclusions checklist
                • Exhibit 181: Inclusions checklist
                • Exhibit 182: Exclusions checklist
              • 13.3 Currency conversion rates for US$
                • Exhibit 183: Currency conversion rates for US$
              • 13.4 Research methodology
                • Exhibit 184: Research methodology
                • Exhibit 185: Validation techniques employed for market sizing
                • Exhibit 186: Information sources
              • 13.5 List of abbreviations
                • Exhibit 187: List of abbreviations

              Research Methodology

              Technavio presents a detailed picture of the market by way of study, synthesis, and summation of data from multiple sources. The analysts have presented the various facets of the market with a particular focus on identifying the key industry influencers. The data thus presented is comprehensive, reliable, and the result of extensive research, both primary and secondary.

              INFORMATION SOURCES

              Primary sources

              • Manufacturers and suppliers
              • Channel partners
              • Industry experts
              • Strategic decision makers

              Secondary sources

              • Industry journals and periodicals
              • Government data
              • Financial reports of key industry players
              • Historical data
              • Press releases

              DATA ANALYSIS

              Data Synthesis

              • Collation of data
              • Estimation of key figures
              • Analysis of derived insights

              Data Validation

              • Triangulation with data models
              • Reference against proprietary databases
              • Corroboration with industry experts

              REPORT WRITING

              Qualitative

              • Market drivers
              • Market challenges
              • Market trends
              • Five forces analysis

              Quantitative

              • Market size and forecast
              • Market segmentation
              • Geographical insights
              • Competitive landscape

              Interested in this report?

              Get your sample now to see our research methodology and insights!

              Download Now

              Frequently Asked Questions

              Industrial Filtration market growth will increase by $ 11400.65 mn during 2024-2028 .

              The Industrial Filtration market is expected to grow at a CAGR of 5.71% during 2024-2028 .

              Industrial Filtration market is segmented by Product( Industrial liquid filtration, Industrial air filtration) Application( Food and beverage, Chemicals and petrochemicals, Power generation, Others, South America)

              3M Co., Alfa Laval AB, Atmus Filtration Technologies Inc., Boll and Kirch Filterbau GmbH, Camfil AB, Danaher Corp., Donaldson Co. Inc., DuPont de Nemours Inc., Eaton Corp. Plc, Ecolab Inc., Entegris Inc., Filtration Group Corp., Freudenberg and Co. KG, GEA Group AG, Graver Technologies LLC, Hengst SE, Lenntech BV, MANN HUMMEL International GmbH and Co. KG, Parker Hannifin Corp., Pentair Plc, Russell Finex Ltd., Siemens AG, Synder Filtration Inc., Xylem Inc. are a few of the key vendors in the Industrial Filtration market.

              North America will register the highest growth rate of 50% among the other regions. Therefore, the Industrial Filtration market in North America is expected to garner significant business opportunities for the vendors during the forecast period.

              US, Canada, China, Germany, UK

              • Increasing number of oil refineriesFiltration is mandatory in oil refineries as it captures matter such as rust and scale is the driving factor this market.
              • which can damage the equipment is the driving factor this market.
              • catalyst beds is the driving factor this market.
              • and other various refinery process units. The various benefits of an optimized filtration system include the following: Reduced downtime Lower maintenance costs Increased process performance Improved operating efficiencies Thus is the driving factor this market.
              • filtration plays a key role during the process of refining. Growing investments in the expansion or upgrading of refineries are expected to drive the global industrial filtration market. For instance is the driving factor this market.
              • The Dangote Refinery is an oil refinery located in Lekki is the driving factor this market.
              • Nigeria is the driving factor this market.
              • that was officially opened on May 22 is the driving factor this market.
              • 2023 is the driving factor this market.
              • by the Dangote Group. When fully operational is the driving factor this market.
              • it is anticipated to be the worlds largest single-train refinery is the driving factor this market.
              • able to process roughly 650 is the driving factor this market.
              • 000 barrels of crude oil per day. Hindustan Petroleum Corp. Ltd. is the driving factor this market.
              • and Indian Oil Corp. is the driving factor this market.
              • spent $20 billion on refinery expansions to add units by 2022. As of June 01 is the driving factor this market.
              • 2021 is the driving factor this market.
              • the total installed provisional refinery capacity in India stood at 249.9 MMT is the driving factor this market.
              • and IOC emerged as the largest domestic refinery is the driving factor this market.
              • with a capacity of 69.7 MMT. In February 2021 is the driving factor this market.
              • the Indian government launched key oil and gas projects in Assam is the driving factor this market.
              • such as the INDMAX unit at Indian Oils Bongaigaon refinery is the driving factor this market.
              • Oil India Limiteds secondary tank farm at Madhuban is the driving factor this market.
              • Dibrugarh is the driving factor this market.
              • and a gas compressor station at Hebeda village is the driving factor this market.
              • Makum is the driving factor this market.
              • and Tinsukia a remote village from dhemaji in Assam. All these oil refinery projects in emerging countries will increase the demand for industrial filters and its maintenance in coming years. Hence is the driving factor this market.
              • this installation of refineries is expected to propel the demand for industrial filters is the driving factor this market.
              • thereby driving the industrial filtration market growth during the forecast period. is the driving factor this market.

              The Industrial Filtration market vendors should focus on grabbing business opportunities from the Industrial liquid filtration segment as it accounted for the largest market share in the base year.