Water Recycle And Reuse Market Analysis APAC, North America, Europe, Middle East and Africa, South America - China, US, Spain, India, Germany - Size and Forecast 2024-2028

Water Recycle And Reuse Market Analysis APAC, North America, Europe, Middle East and Africa, South America - China, US, Spain, India, Germany - Size and Forecast 2024-2028

Published: Aug 2024 173 Pages SKU: IRTNTR73859

Market Overview at a Glance

$15.09 B
Market Opportunity
14.76%
CAGR
12.55
YoY growth 2023-2024(%)

Water Recycle And Reuse Market Size 2024-2028

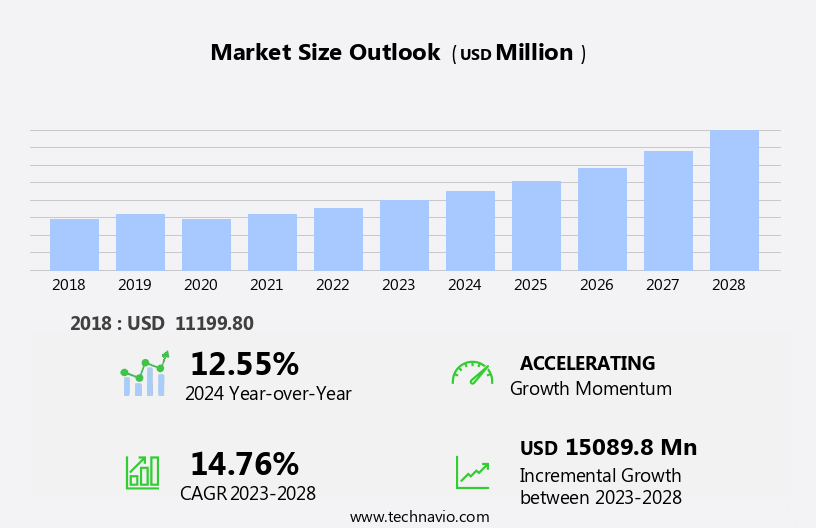
The water recycle and reuse market size is forecast to increase by USD 15.09 billion, at a CAGR of 14.76% between 2023 and 2028.

  • The market is driven by the pressing need to address the scarcity of water resources and escalating environmental concerns. With increasing water scarcity and the growing awareness of the environmental impact of freshwater usage, the demand for water recycling and reuse solutions is surging. This trend is further fueled by advancements in water treatment technologies, enabling the conversion of wastewater into potable water, thereby reducing the reliance on freshwater sources. However, the market faces significant challenges. Infrastructure requirements for water treatment and distribution systems represent a substantial investment, posing financial hurdles for market entrants. Moreover, stringent regulations governing water quality and safety standards necessitate substantial investment in research and development to ensure compliance.
  • These challenges call for strategic partnerships and collaborations among stakeholders to pool resources, expertise, and capabilities, enabling the development of cost-effective and sustainable water recycling and reuse solutions. Companies seeking to capitalize on the market opportunities must navigate these challenges effectively, focusing on innovation, collaboration, and regulatory compliance to secure their position in the market.

What will be the Size of the Water Recycle And Reuse Market during the forecast period?

Water Recycle And Reuse Market Size

Explore in-depth regional segment analysis with market size data - historical 2018-2022 and forecasts 2024-2028 - in the full report.  
Request Free Sample

The market continues to evolve, driven by the increasing importance of sustainable water management and circular economy principles. Anaerobic digestion and biological treatment are key technologies used to transform wastewater into reusable resources, adhering to stringent water quality standards and regulations. Water pricing and infrastructure investments play a crucial role in encouraging water conservation and efficiency, while ultraviolet disinfection and ozone disinfection ensure the safety of reclaimed water. Water reuse facilities are gaining popularity across various sectors, including agriculture, industry, and municipalities, as drought management becomes a pressing concern. Water audits and metering help identify opportunities for water savings, while rainwater harvesting and stormwater management contribute to local water resource management.

Circular economy approaches to water treatment, such as membrane filtration and activated sludge systems, enable the recycling of greywater and blackwater for non-potable uses. Wastewater treatment plants employ a combination of chemical treatment, trickling filters, and reverse osmosis to produce high-quality reclaimed water. Water reuse regulations and policies continue to evolve, reflecting the ongoing dynamism of this market. Irrigation systems, agricultural water reuse, and industrial water reuse are just a few applications of reclaimed water, demonstrating the market's broad reach and potential. In the context of water scarcity, water security, and sustainable water management, the market is poised for continued growth and innovation.

How is this Water Recycle And Reuse Industry segmented?

The water recycle and reuse industry research report provides comprehensive data (region-wise segment analysis), with forecasts and estimates in "USD million" for the period 2024-2028, as well as historical data from 2018-2022 for the following segments.

  • End-user
    • Industrial
    • Agricultural
    • Domestic and commercial
  • Technology
    • Conventional treatment and recycling technologies
    • Membrane filtration technologies
    • Chemical treatment and disinfection technologies
  • Geography
    • North America
      • US
    • Europe
      • Germany
      • Spain
    • APAC
      • China
      • India
    • Rest of World (ROW)

By End-user Insights

The industrial segment is estimated to witness significant growth during the forecast period.

In the energy and power sector, industries such as power generation, upstream oil and gas, and refining and petrochemical rely heavily on water. According to the International Energy Agency (IEA), the demand for freshwater in energy production is projected to double in the next quarter-century. Water is indispensable in power plants, serving as the working fluid, and is utilized for cooling, condensing, and oil extraction. Wastewater reuse and recycling play a crucial role in the energy sector. Applications include general wastewater recycling, boiler feedwater, condensate polishing, cooling tower makeup, and ion exchange rinse waters. Biological treatment, membrane filtration, and ultraviolet disinfection are essential techniques in water reclamation.

Water infrastructure, water resource management, and sustainable water management are key to addressing water scarcity and ensuring water security. Regulations and standards, such as water quality and water reuse, govern the industry. Water pricing and metering are essential for efficient water usage. Drought management and stormwater management are crucial in mitigating water shortages. Circular economy principles, like rainwater harvesting and greywater recycling, contribute to water conservation. The manufacturing, mining and quarrying, and construction industries also leverage water reuse and recycling. Biological treatment, activated sludge, and trickling filters are common methods for wastewater treatment. Reverse osmosis, ozone disinfection, and chemical treatment are other techniques used to ensure water quality.

Industrial water reuse and agricultural water reuse are vital for sustainable water management. Water footprint, an essential concept in water resource management, highlights the water usage impact of various industries. The integration of these practices into the energy and power sector, as well as other industries, is crucial for a circular economy and efficient water usage.

Water Recycle And Reuse Market Size

Request Free Sample

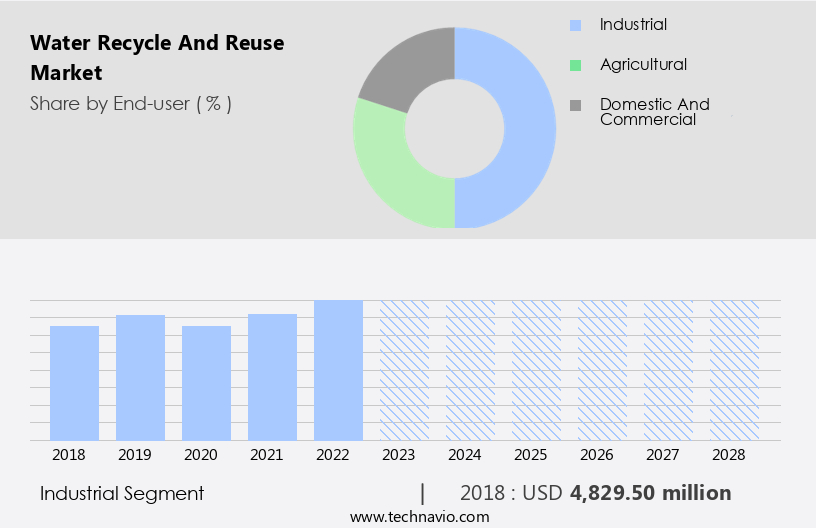
The Industrial segment was valued at USD 4.83 billion in 2018 and showed a gradual increase during the forecast period.

Regional Analysis

APAC is estimated to contribute 41% to the growth of the global market during the forecast period.Technavio's analysts have elaborately explained the regional trends and drivers that shape the market during the forecast period.

Water Recycle And Reuse Market Share by Geography

 Request Free Sample

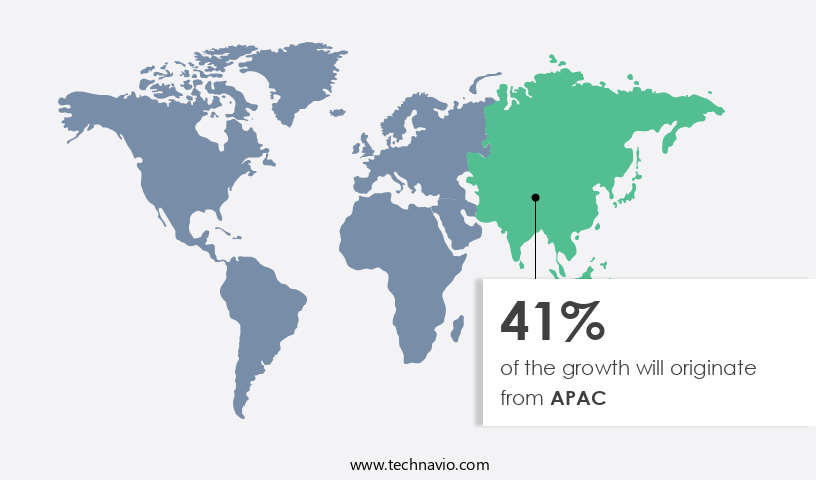
The market in Asia Pacific (APAC) is experiencing significant growth, with China and India leading the charge. Strict water quality standards and regulations are driving the need for water conservation and efficiency, leading to increased investment in water treatment technologies such as anaerobic digestion, biological treatment, and membrane filtration. Ultraviolet disinfection and ozone disinfection are also gaining popularity for their effectiveness in ensuring water safety. Water pricing is another key factor influencing market growth, as governments and industries seek to reduce their water footprint and secure water resources. Water reclamation and rainwater harvesting are becoming essential components of sustainable water management and resource management strategies.

Drought management and water metering are also crucial for efficient water usage. The circular economy is a significant trend in the water industry, with wastewater treatment plants and industrial facilities increasingly focusing on water reuse for irrigation systems, municipal water supply, and industrial processes. Agricultural water reuse is also gaining traction, particularly in regions with water scarcity. Governments and private entities are investing heavily in water infrastructure, including water treatment plants, stormwater management systems, and water reuse facilities. Technological advancements in chemical treatment, trickling filters, and reverse osmosis are enhancing the capabilities of these facilities and enabling more effective water reuse.

Overall, the market is expected to grow rapidly in APAC, driven by a combination of regulatory requirements, water scarcity, and the pursuit of sustainable water management practices.

Market Dynamics

Our researchers analyzed the data with 2023 as the base year, along with the key drivers, trends, and challenges. A holistic analysis of drivers will help companies refine their marketing strategies to gain a competitive advantage.

What are the key market drivers leading to the rise in the adoption of Water Recycle And Reuse Industry?

  • The scarcity of water and escalating environmental concerns serve as the primary drivers in shaping the market dynamics. 
  • The global water crisis is a pressing issue, with freshwater accounting for only a minimal percentage of the world's total water resources. The depletion of freshwater resources is primarily due to the excessive extraction of water from underground sources, which is outpacing the rate of replenishment. This situation is further exacerbated by population growth, increasing per capita water consumption, and urbanization. In response to this challenge, water recycling and reuse have emerged as crucial solutions. Approximately two-fifths of the global population currently faces water shortages, and regions such as the Middle East, North Africa, and Southeast Asia are projected to experience severe water scarcity in the coming decade due to poor water management and insufficient water recycling.
  • Aerobic digestion, greywater recycling, industrial water reuse, municipal water reuse, irrigation systems, rainwater harvesting, and wastewater treatment are some of the essential techniques employed for water recycling and reuse. These methods help reduce the demand for freshwater and decrease the overall water footprint. The primary drivers for water recycling and reuse include population growth, increasing water consumption, and urbanization. By implementing these techniques, businesses and communities can conserve water resources and contribute to a more sustainable future.

What are the market trends shaping the Water Recycle And Reuse Industry?

  • Water treatment technology innovation is gaining significant traction in the market. Two key trends in this field include the adoption of advanced filtration systems and the integration of automation and digital technologies for improved efficiency and precision.
  • The market is experiencing significant growth due to the increasing focus on water conservation and water efficiency. Water reuse regulations and water quality standards are driving the demand for advanced water treatment technologies. Technologies such as anaerobic digestion, biological treatment, ultraviolet disinfection, and water reclamation are gaining popularity in the market. One innovative technology is the Aquaporin Inside technology, which uses biomimetic membranes for water treatment. This Danish company's technology mimics the structure of natural water channels in cell membranes, allowing water to pass through while filtering out impurities. Reverse osmosis technology is used in conjunction with this technology to filter out salts and larger solution components, providing clean water for industrial and household use.
  • Water pricing also plays a crucial role in the market's growth as water scarcity increases and the cost of traditional water sources rises. The implementation of these advanced water treatment technologies is essential for preserving water infrastructure and ensuring a sustainable water supply.

What challenges does the Water Recycle And Reuse Industry face during its growth?

  • The growth of the water treatment industry is significantly influenced by the infrastructure requirements, which pose a significant challenge in this sector. 
  • The market faces significant infrastructure challenges due to the complexity of water treatment processes. Municipal water treatment involves multiple stages, including flocculation, coagulation, sedimentation, filtration, and disinfection, which can make water reclamation and reuse a complex undertaking. The design and implementation of water reuse facilities require careful consideration of water quality objectives, operational and maintenance requirements, and flexibility of operations. These factors contribute to the intricacies of water treatment infrastructure, which can hinder market growth. Sustainable water management and circular economy principles are increasingly important in water resource management. Drought management and water security are critical concerns, making water metering and efficient water use essential.
  • Water policy and regulations play a significant role in promoting water reuse and recycling. Water treatment plants are integral to these efforts, ensuring the quality and safety of reclaimed water for various uses, including agriculture, industry, and municipal applications. By addressing the infrastructure challenges and embracing advanced water treatment technologies, the market can contribute to more efficient and sustainable water management practices.

Exclusive Customer Landscape

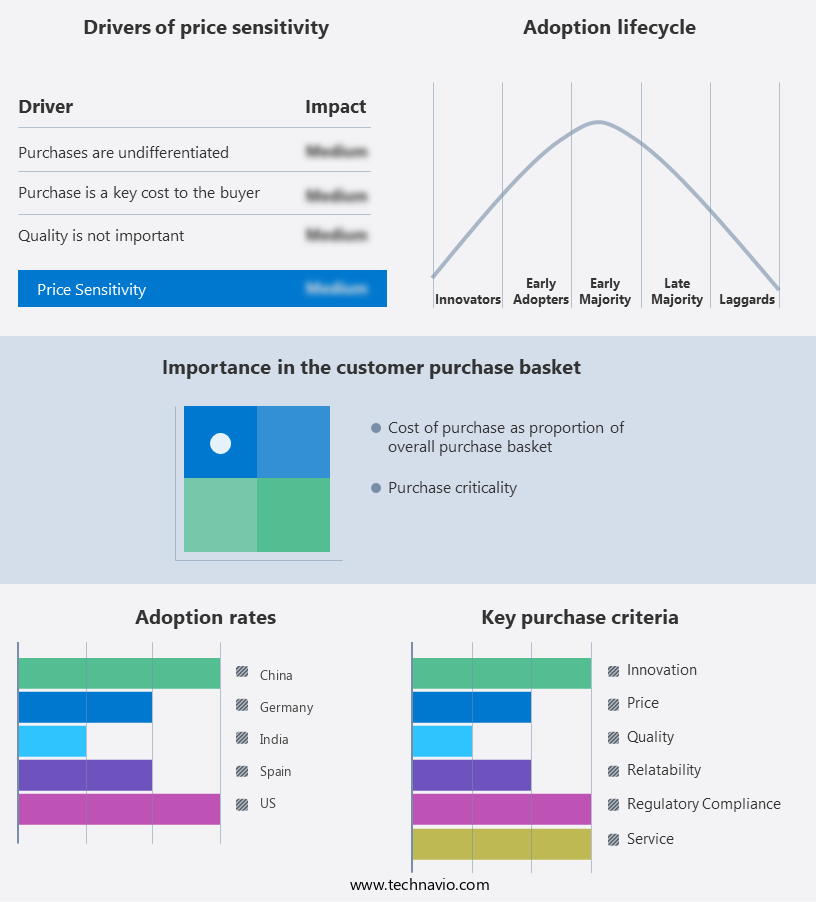
The water recycle and reuse market forecasting report includes the adoption lifecycle of the market, covering from the innovator's stage to the laggard's stage. It focuses on adoption rates in different regions based on penetration. Furthermore, the water recycle and reuse market report also includes key purchase criteria and drivers of price sensitivity to help companies evaluate and develop their market growth analysis strategies.

Water Recycle And Reuse Market Share by Geography

 Customer Landscape

Key Companies & Market Insights

Companies are implementing various strategies, such as strategic alliances, water recycle and reuse market forecast, partnerships, mergers and acquisitions, geographical expansion, and product/service launches, to enhance their presence in the industry.

Alfa Laval AB - The company specializes in providing innovative water recycling and reuse solutions for both municipal and industrial sectors. 

The industry research and growth report includes detailed analyses of the competitive landscape of the market and information about key companies, including:

  • Alfa Laval AB
  • Aquatech International LLC
  • aquatherm GmbH
  • Aries Chemical Inc.
  • DeLoach Industries Inc.
  • Ecolab Inc.
  • Element Solutions Inc.
  • Evoqua Water Technologies LLC
  • Fluence Corp. Ltd.
  • General Electric Co.
  • Grundfos Holding AS
  • Komline Sanderson Corp.
  • Lenntech BV
  • Nitto Denko Corp.
  • PHOENIX Process Equipment Co.
  • Praj Industries Ltd.
  • Samco Technologies Inc.
  • Siemens AG
  • Tata Sons Pvt. Ltd.
  • Veolia Environnement SA

Qualitative and quantitative analysis of companies has been conducted to help clients understand the wider business environment as well as the strengths and weaknesses of key industry players. Data is qualitatively analyzed to categorize companies as pure play, category-focused, industry-focused, and diversified; it is quantitatively analyzed to categorize companies as dominant, leading, strong, tentative, and weak.

Recent Development and News in Water Recycle And Reuse Market

  • In March 2024, Suez Water Technologies & Solutions, a global water technology leader, announced the launch of its new Membrane Filtration System, named "Aquaflex MF," designed to enhance water reuse efficiency by up to 30% compared to traditional systems. This innovation addresses the growing demand for water recycling and reuse, especially in water-stressed regions (Suez Water Technologies & Solutions Press Release, 2024).
  • In July 2025, Veolia Water Technologies, a global water solutions provider, entered into a strategic partnership with Microsoft to develop an IoT-based water management platform. This collaboration aims to optimize water treatment processes, reduce energy consumption, and improve operational efficiency in the water reuse industry (Microsoft News Center, 2025).
  • In October 2024, Siemens Water Technologies Corporation, a leading water infrastructure provider, secured a USD100 million contract from the Saudi Arabian government to build a seawater reverse osmosis desalination plant in Jeddah. This project, expected to be completed by 2026, will significantly contribute to the country's water reuse efforts and its growing water infrastructure (Siemens AG Press Release, 2024).
  • In January 2025, the European Union passed the revised Water Framework Directive, which includes stricter regulations on water reuse and recycling. This policy change is expected to drive investments in advanced water treatment technologies and encourage the adoption of circular water management practices across Europe (European Commission, 2025).

Research Analyst Overview

  • The market encompasses various technologies and applications, including nutrient removal and phosphorus removal in industrial processes. Cooling towers benefit from membrane bioreactors and ion exchange for water reuse in applications such as landscape irrigation and toilet flushing. Multi-stage flash distillation and electrodialysis reversal are employed for water reuse in industries, addressing water reuse challenges and economics. Water reuse research continues to innovate, with sand filtration and sludge dewatering enhancing treatment processes. Nitrogen removal and sludge treatment are crucial components of water reuse, ensuring high-quality end products.
  • Reverse osmosis desalination and water softening are additional water reuse technologies that offer benefits for businesses. Water reuse policy and filtration media are essential factors shaping the market landscape. Activated carbon plays a vital role in water treatment, contributing to the overall success of water reuse initiatives.

Dive into Technavio's robust research methodology, blending expert interviews, extensive data synthesis, and validated models for unparalleled Water Recycle And Reuse Market insights. See full methodology.

Market Scope

Report Coverage

Details

Page number

173

Base year

2023

Historic period

2018-2022

Forecast period

2024-2028

Growth momentum & CAGR

Accelerate at a CAGR of 14.76%

Market growth 2024-2028

USD 15089.8 million

Market structure

Fragmented

YoY growth 2023-2024(%)

12.55

Key countries

China, US, Spain, India, and Germany

Competitive landscape

Leading Companies, Market Positioning of Companies, Competitive Strategies, and Industry Risks

Request Free Sample

What are the Key Data Covered in this Water Recycle And Reuse Market Research and Growth Report?

  • CAGR of the Water Recycle And Reuse industry during the forecast period
  • Detailed information on factors that will drive the growth and forecasting between 2024 and 2028
  • Precise estimation of the size of the market and its contribution of the industry in focus to the parent market
  • Accurate predictions about upcoming growth and trends and changes in consumer behaviour
  • Growth of the market across APAC, North America, Europe, Middle East and Africa, and South America
  • Thorough analysis of the market's competitive landscape and detailed information about companies
  • Comprehensive analysis of factors that will challenge the water recycle and reuse market growth of industry companies

We can help! Our analysts can customize this water recycle and reuse market research report to meet your requirements.

Get in touch

1 Executive Summary

  • 1.1 Market overview
    • Executive Summary - Chart on Market Overview
    • Executive Summary - Data Table on Market Overview
    • Executive Summary - Chart on Global Market Characteristics
    • Executive Summary - Chart on Market by Geography
    • Executive Summary - Chart on Market Segmentation by End-user
    • Executive Summary - Chart on Market Segmentation by Technology
    • Executive Summary - Chart on Incremental Growth
    • Executive Summary - Data Table on Incremental Growth
    • Executive Summary - Chart on Company Market Positioning

2 Market Landscape

  • 2.1 Market ecosystem
    • Parent Market
    • Data Table on - Parent Market
  • 2.2 Market characteristics
    • Market characteristics analysis
  • 2.3 Value chain analysis
    • Value Chain Analysis

3 Market Sizing

  • 3.1 Market definition
    • Offerings of companies included in the market definition
  • 3.2 Market segment analysis
    • Market segments
  • 3.3 Market size 2023
    • 3.4 Market outlook: Forecast for 2023-2028
      • Chart on Global - Market size and forecast 2023-2028 ($ million)
      • Data Table on Global - Market size and forecast 2023-2028 ($ million)
      • Chart on Global Market: Year-over-year growth 2023-2028 (%)
      • Data Table on Global Market: Year-over-year growth 2023-2028 (%)

    4 Historic Market Size

    • 4.1 Global Water Recycle And Reuse Market 2018 - 2022
      • Historic Market Size - Data Table on Global Water Recycle And Reuse Market 2018 - 2022 ($ million)
    • 4.2 End-user segment analysis 2018 - 2022
      • Historic Market Size - End-user Segment 2018 - 2022 ($ million)
    • 4.3 Technology segment analysis 2018 - 2022
      • Historic Market Size - Technology Segment 2018 - 2022 ($ million)
    • 4.4 Geography segment analysis 2018 - 2022
      • Historic Market Size - Geography Segment 2018 - 2022 ($ million)
    • 4.5 Country segment analysis 2018 - 2022
      • Historic Market Size - Country Segment 2018 - 2022 ($ million)

    5 Five Forces Analysis

    • 5.1 Five forces summary
      • Five forces analysis - Comparison between 2023 and 2028
    • 5.2 Bargaining power of buyers
      • Bargaining power of buyers - Impact of key factors 2023 and 2028
    • 5.3 Bargaining power of suppliers
      • Bargaining power of suppliers - Impact of key factors in 2023 and 2028
    • 5.4 Threat of new entrants
      • Threat of new entrants - Impact of key factors in 2023 and 2028
    • 5.5 Threat of substitutes
      • Threat of substitutes - Impact of key factors in 2023 and 2028
    • 5.6 Threat of rivalry
      • Threat of rivalry - Impact of key factors in 2023 and 2028
    • 5.7 Market condition
      • Chart on Market condition - Five forces 2023 and 2028

    6 Market Segmentation by End-user

    • 6.1 Market segments
      • Chart on End-user - Market share 2023-2028 (%)
      • Data Table on End-user - Market share 2023-2028 (%)
    • 6.2 Comparison by End-user
      • Chart on Comparison by End-user
      • Data Table on Comparison by End-user
    • 6.3 Industrial - Market size and forecast 2023-2028
      • Chart on Industrial - Market size and forecast 2023-2028 ($ million)
      • Data Table on Industrial - Market size and forecast 2023-2028 ($ million)
      • Chart on Industrial - Year-over-year growth 2023-2028 (%)
      • Data Table on Industrial - Year-over-year growth 2023-2028 (%)
    • 6.4 Agricultural - Market size and forecast 2023-2028
      • Chart on Agricultural - Market size and forecast 2023-2028 ($ million)
      • Data Table on Agricultural - Market size and forecast 2023-2028 ($ million)
      • Chart on Agricultural - Year-over-year growth 2023-2028 (%)
      • Data Table on Agricultural - Year-over-year growth 2023-2028 (%)
    • 6.5 Domestic and commercial - Market size and forecast 2023-2028
      • Chart on Domestic and commercial - Market size and forecast 2023-2028 ($ million)
      • Data Table on Domestic and commercial - Market size and forecast 2023-2028 ($ million)
      • Chart on Domestic and commercial - Year-over-year growth 2023-2028 (%)
      • Data Table on Domestic and commercial - Year-over-year growth 2023-2028 (%)
    • 6.6 Market opportunity by End-user
      • Market opportunity by End-user ($ million)
      • Data Table on Market opportunity by End-user ($ million)

    7 Market Segmentation by Technology

    • 7.1 Market segments
      • Chart on Technology - Market share 2023-2028 (%)
      • Data Table on Technology - Market share 2023-2028 (%)
    • 7.2 Comparison by Technology
      • Chart on Comparison by Technology
      • Data Table on Comparison by Technology
    • 7.3 Conventional treatment and recycling technologies - Market size and forecast 2023-2028
      • Chart on Conventional treatment and recycling technologies - Market size and forecast 2023-2028 ($ million)
      • Data Table on Conventional treatment and recycling technologies - Market size and forecast 2023-2028 ($ million)
      • Chart on Conventional treatment and recycling technologies - Year-over-year growth 2023-2028 (%)
      • Data Table on Conventional treatment and recycling technologies - Year-over-year growth 2023-2028 (%)
    • 7.4 Membrane filtration technologies - Market size and forecast 2023-2028
      • Chart on Membrane filtration technologies - Market size and forecast 2023-2028 ($ million)
      • Data Table on Membrane filtration technologies - Market size and forecast 2023-2028 ($ million)
      • Chart on Membrane filtration technologies - Year-over-year growth 2023-2028 (%)
      • Data Table on Membrane filtration technologies - Year-over-year growth 2023-2028 (%)
    • 7.5 Chemical treatment and disinfection technologies - Market size and forecast 2023-2028
      • Chart on Chemical treatment and disinfection technologies - Market size and forecast 2023-2028 ($ million)
      • Data Table on Chemical treatment and disinfection technologies - Market size and forecast 2023-2028 ($ million)
      • Chart on Chemical treatment and disinfection technologies - Year-over-year growth 2023-2028 (%)
      • Data Table on Chemical treatment and disinfection technologies - Year-over-year growth 2023-2028 (%)
    • 7.6 Market opportunity by Technology
      • Market opportunity by Technology ($ million)
      • Data Table on Market opportunity by Technology ($ million)

    8 Customer Landscape

    • 8.1 Customer landscape overview
      • Analysis of price sensitivity, lifecycle, customer purchase basket, adoption rates, and purchase criteria

    9 Geographic Landscape

    • 9.1 Geographic segmentation
      • Chart on Market share by geography 2023-2028 (%)
      • Data Table on Market share by geography 2023-2028 (%)
    • 9.2 Geographic comparison
      • Chart on Geographic comparison
      • Data Table on Geographic comparison
    • 9.3 APAC - Market size and forecast 2023-2028
      • Chart on APAC - Market size and forecast 2023-2028 ($ million)
      • Data Table on APAC - Market size and forecast 2023-2028 ($ million)
      • Chart on APAC - Year-over-year growth 2023-2028 (%)
      • Data Table on APAC - Year-over-year growth 2023-2028 (%)
    • 9.4 North America - Market size and forecast 2023-2028
      • Chart on North America - Market size and forecast 2023-2028 ($ million)
      • Data Table on North America - Market size and forecast 2023-2028 ($ million)
      • Chart on North America - Year-over-year growth 2023-2028 (%)
      • Data Table on North America - Year-over-year growth 2023-2028 (%)
    • 9.5 Europe - Market size and forecast 2023-2028
      • Chart on Europe - Market size and forecast 2023-2028 ($ million)
      • Data Table on Europe - Market size and forecast 2023-2028 ($ million)
      • Chart on Europe - Year-over-year growth 2023-2028 (%)
      • Data Table on Europe - Year-over-year growth 2023-2028 (%)
    • 9.6 Middle East and Africa - Market size and forecast 2023-2028
      • Chart on Middle East and Africa - Market size and forecast 2023-2028 ($ million)
      • Data Table on Middle East and Africa - Market size and forecast 2023-2028 ($ million)
      • Chart on Middle East and Africa - Year-over-year growth 2023-2028 (%)
      • Data Table on Middle East and Africa - Year-over-year growth 2023-2028 (%)
    • 9.7 South America - Market size and forecast 2023-2028
      • Chart on South America - Market size and forecast 2023-2028 ($ million)
      • Data Table on South America - Market size and forecast 2023-2028 ($ million)
      • Chart on South America - Year-over-year growth 2023-2028 (%)
      • Data Table on South America - Year-over-year growth 2023-2028 (%)
    • 9.8 China - Market size and forecast 2023-2028
      • Chart on China - Market size and forecast 2023-2028 ($ million)
      • Data Table on China - Market size and forecast 2023-2028 ($ million)
      • Chart on China - Year-over-year growth 2023-2028 (%)
      • Data Table on China - Year-over-year growth 2023-2028 (%)
    • 9.9 US - Market size and forecast 2023-2028
      • Chart on US - Market size and forecast 2023-2028 ($ million)
      • Data Table on US - Market size and forecast 2023-2028 ($ million)
      • Chart on US - Year-over-year growth 2023-2028 (%)
      • Data Table on US - Year-over-year growth 2023-2028 (%)
    • 9.10 Spain - Market size and forecast 2023-2028
      • Chart on Spain - Market size and forecast 2023-2028 ($ million)
      • Data Table on Spain - Market size and forecast 2023-2028 ($ million)
      • Chart on Spain - Year-over-year growth 2023-2028 (%)
      • Data Table on Spain - Year-over-year growth 2023-2028 (%)
    • 9.11 India - Market size and forecast 2023-2028
      • Chart on India - Market size and forecast 2023-2028 ($ million)
      • Data Table on India - Market size and forecast 2023-2028 ($ million)
      • Chart on India - Year-over-year growth 2023-2028 (%)
      • Data Table on India - Year-over-year growth 2023-2028 (%)
    • 9.12 Germany - Market size and forecast 2023-2028
      • Chart on Germany - Market size and forecast 2023-2028 ($ million)
      • Data Table on Germany - Market size and forecast 2023-2028 ($ million)
      • Chart on Germany - Year-over-year growth 2023-2028 (%)
      • Data Table on Germany - Year-over-year growth 2023-2028 (%)
    • 9.13 Market opportunity by geography
      • Market opportunity by geography ($ million)
      • Data Tables on Market opportunity by geography ($ million)

    10 Drivers, Challenges, and Opportunity/Restraints

    • 10.1 Market drivers
      • 10.2 Market challenges
        • 10.3 Impact of drivers and challenges
          • Impact of drivers and challenges in 2023 and 2028
        • 10.4 Market opportunities/restraints

          11 Competitive Landscape

          • 11.1 Overview
            • 11.2 Competitive Landscape
              • Overview on criticality of inputs and factors of differentiation
            • 11.3 Landscape disruption
              • Overview on factors of disruption
            • 11.4 Industry risks
              • Impact of key risks on business

            12 Competitive Analysis

            • 12.1 Companies profiled
              • Companies covered
            • 12.2 Market positioning of companies
              • Matrix on companies position and classification
            • 12.3 Alfa Laval AB
              • Alfa Laval AB - Overview
              • Alfa Laval AB - Business segments
              • Alfa Laval AB - Key news
              • Alfa Laval AB - Key offerings
              • Alfa Laval AB - Segment focus
            • 12.4 Ecolab Inc.
              • Ecolab Inc. - Overview
              • Ecolab Inc. - Business segments
              • Ecolab Inc. - Key news
              • Ecolab Inc. - Key offerings
              • Ecolab Inc. - Segment focus
            • 12.5 Evoqua Water Technologies LLC
              • Evoqua Water Technologies LLC - Overview
              • Evoqua Water Technologies LLC - Business segments
              • Evoqua Water Technologies LLC - Key news
              • Evoqua Water Technologies LLC - Key offerings
              • Evoqua Water Technologies LLC - Segment focus
            • 12.6 Fluence Corp. Ltd.
              • Fluence Corp. Ltd. - Overview
              • Fluence Corp. Ltd. - Product / Service
              • Fluence Corp. Ltd. - Key offerings
            • 12.7 General Electric Co.
              • General Electric Co. - Overview
              • General Electric Co. - Business segments
              • General Electric Co. - Key news
              • General Electric Co. - Key offerings
              • General Electric Co. - Segment focus
            • 12.8 Lenntech BV
              • Lenntech BV - Overview
              • Lenntech BV - Product / Service
              • Lenntech BV - Key offerings
            • 12.9 Nitto Denko Corp.
              • Nitto Denko Corp. - Overview
              • Nitto Denko Corp. - Business segments
              • Nitto Denko Corp. - Key news
              • Nitto Denko Corp. - Key offerings
              • Nitto Denko Corp. - Segment focus
            • 12.10 PHOENIX Process Equipment Co.
              • PHOENIX Process Equipment Co. - Overview
              • PHOENIX Process Equipment Co. - Product / Service
              • PHOENIX Process Equipment Co. - Key offerings
            • 12.11 Siemens AG
              • Siemens AG - Overview
              • Siemens AG - Business segments
              • Siemens AG - Key news
              • Siemens AG - Key offerings
              • Siemens AG - Segment focus
            • 12.12 Veolia Environnement SA
              • Veolia Environnement SA - Overview
              • Veolia Environnement SA - Business segments
              • Veolia Environnement SA - Key news
              • Veolia Environnement SA - Key offerings
              • Veolia Environnement SA - Segment focus

            13 Appendix

            • 13.1 Scope of the report
              • 13.2 Inclusions and exclusions checklist
                • Inclusions checklist
                • Exclusions checklist
              • 13.3 Currency conversion rates for US$
                • Currency conversion rates for US$
              • 13.4 Research methodology
                • Research methodology
              • 13.5 Data procurement
                • Information sources
              • 13.6 Data validation
                • Data validation
              • 13.7 Validation techniques employed for market sizing
                • Validation techniques employed for market sizing
              • 13.8 Data synthesis
                • Data synthesis
              • 360 degree market analysis
                • 360 degree market analysis
              • 13.10 List of abbreviations
                • List of abbreviations

              Research Methodology

              Technavio presents a detailed picture of the market by way of study, synthesis, and summation of data from multiple sources. The analysts have presented the various facets of the market with a particular focus on identifying the key industry influencers. The data thus presented is comprehensive, reliable, and the result of extensive research, both primary and secondary.

              INFORMATION SOURCES

              Primary sources

              • Manufacturers and suppliers
              • Channel partners
              • Industry experts
              • Strategic decision makers

              Secondary sources

              • Industry journals and periodicals
              • Government data
              • Financial reports of key industry players
              • Historical data
              • Press releases

              DATA ANALYSIS

              Data Synthesis

              • Collation of data
              • Estimation of key figures
              • Analysis of derived insights

              Data Validation

              • Triangulation with data models
              • Reference against proprietary databases
              • Corroboration with industry experts

              REPORT WRITING

              Qualitative

              • Market drivers
              • Market challenges
              • Market trends
              • Five forces analysis

              Quantitative

              • Market size and forecast
              • Market segmentation
              • Geographical insights
              • Competitive landscape

              Interested in this report?

              Get your sample now to see our research methodology and insights!

              Download Now

              Frequently Asked Questions

              Water Recycle And Reuse market growth will increase by $ 15089.8 mn during 2024-2028.

              The Water Recycle And Reuse market is expected to grow at a CAGR of 14.76% during 2024-2028.

              Water Recycle And Reuse market is segmented by End-user( Industrial, Agricultural, Domestic and commercial) Technology( Conventional treatment and recycling technologies, Membrane filtration technologies, Chemical treatment and disinfection technologies)

              Alfa Laval AB, Aquatech International LLC, aquatherm GmbH, Aries Chemical Inc., DeLoach Industries Inc., Ecolab Inc., Element Solutions Inc., Evoqua Water Technologies LLC, Fluence Corp. Ltd., General Electric Co., Grundfos Holding AS, Komline Sanderson Corp., Lenntech BV, Nitto Denko Corp., PHOENIX Process Equipment Co., Praj Industries Ltd., Samco Technologies Inc., Siemens AG, Tata Sons Pvt. Ltd., Veolia Environnement SA are a few of the key vendors in the Water Recycle And Reuse market.

              APAC will register the highest growth rate of 41% among the other regions. Therefore, the Water Recycle And Reuse market in APAC is expected to garner significant business opportunities for the vendors during the forecast period.

              China, US, Spain, India, Germany

              • Scarcity of water and rising environmental concernsFreshwater accounts for less than 3% of the total water worldwide. Freshwater resources are depleting due to the rise in the extraction of water from aquifers. The rate of water extraction from underground sources is higher than the rate of being replenished.Water recycling and reusing activities are gaining importance due to the shrinking of water resources globally. Two-fifths of the global population faces a water shortage is the driving factor this market.
              • and regions such as the Middle East is the driving factor this market.
              • North Africa is the driving factor this market.
              • and Southeast Asia are expected to face severe water shortages in the next decade due to poor water management and improper recycling of water. Population growth is the driving factor this market.
              • increasing per capita consumption of water is the driving factor this market.
              • and urbanization are the major driving factors for water scarcity. This is expected to increase the demand for water in the coming decade. Thus is the driving factor this market.
              • industries such as food and beverage is the driving factor this market.
              • industrial manufacturing is the driving factor this market.
              • and mining are investing in and modifying their water treatment plants to supply the treated water for reuse for industrial purposes instead of discharging it to watersheds.Industrial wastewater discharge can cause serious damage to local ecosystems and pose health risks to nearby residents. Therefore is the driving factor this market.
              • it is essential to treat wastewater because it ends up back in the environment. Many companies are taking initiatives to deal with the rising water scarcity. For instance is the driving factor this market.
              • BMW Chennai is using recycled wastewater for water tests in vehicles to avoid water wastage. Moreover is the driving factor this market.
              • reusing water in industries has the potential to reduce costs of water supply and wastewater treatment while reducing pressure on water resources.  Therefore is the driving factor this market.
              • the decline in water levels will result in the reuse of water. As impurities can have an adverse impact on the equipment is the driving factor this market.
              • it necessitates the use of water recycling and reusing equipment to first make the water safe. This is expected to drive the growth of the global water recycle and reuse market during the forecast period.  is the driving factor this market.

              The Water Recycle And Reuse market vendors should focus on grabbing business opportunities from the Industrial segment as it accounted for the largest market share in the base year.
              RIA - Research AI Assistant
              Ask RIA