Space Tourism Market Analysis, Size, and Forecast 2026-2030: North America (US, Canada, and Mexico), Europe (Germany, UK, and France), Asia (China, Japan, and India), Middle East and Africa (UAE, Saudi Arabia, and Israel), South America (Brazil, Argentina, and Chile), Rest of World (ROW)

Space Tourism Market Analysis, Size, and Forecast 2026-2030:
North America (US, Canada, and Mexico), Europe (Germany, UK, and France), Asia (China, Japan, and India), Middle East and Africa (UAE, Saudi Arabia, and Israel), South America (Brazil, Argentina, and Chile), Rest of World (ROW)

Published: May 2026 289 Pages SKU: IRTNTR70414

Market Overview at a Glance

$17.76 B
Market Opportunity
21.1%
CAGR 2025 - 2030
49.8%
North America Growth
$6.49 B
Suborbital tourism segment 2024

Space Tourism Market Size 2026-2030

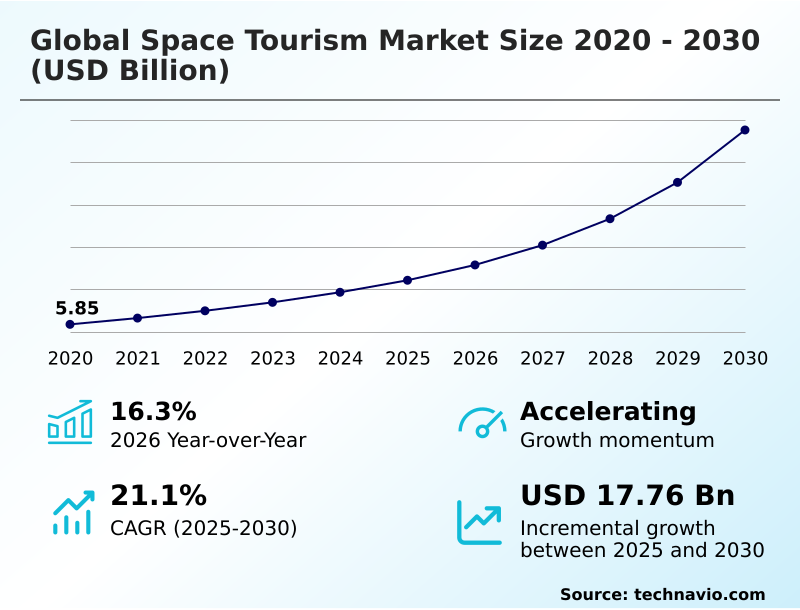
The space tourism market size is valued to increase by USD 17.76 billion, at a CAGR of 21.1% from 2025 to 2030. Evolution of reusable and affordable spaceflight systems will drive the space tourism market.

Major Market Trends & Insights

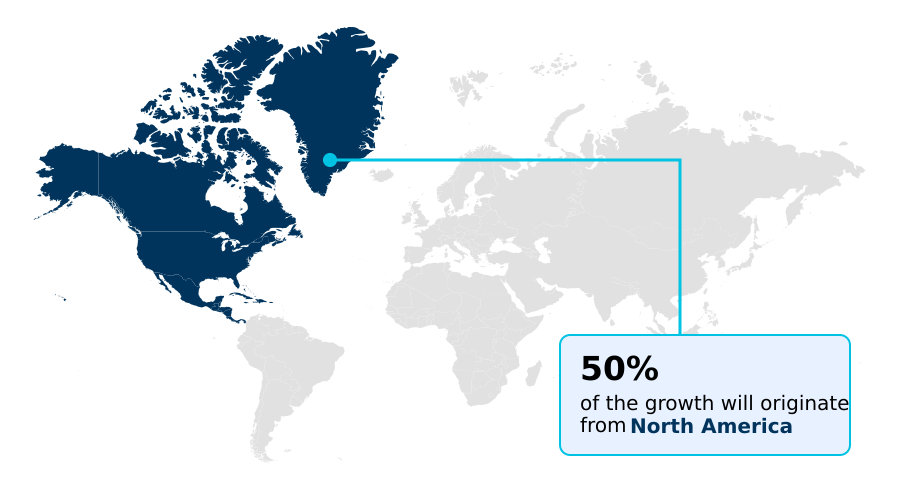
  • North America dominated the market and accounted for a 49.8% growth during the forecast period.
  • By Type - Suborbital tourism segment was valued at USD 6.49 billion in 2024
  • By End-user - Commercial segment accounted for the largest market revenue share in 2024

Market Size & Forecast

  • Market Opportunities: USD 22.97 billion
  • Market Future Opportunities: USD 17.76 billion
  • CAGR from 2025 to 2030 : 21.1%

Market Summary

  • The Space Tourism Market is transitioning from an exclusive, experimental niche into a structurally viable commercial sector driven by heavy private aerospace investments. The deployment of reusable launch infrastructure has fundamentally altered supply chain optimization and operational planning for aerospace enterprises.
  • By recovering and refurbishing booster stages, companies have achieved a 50% increase in launch frequency compared to traditional expendable systems, dramatically improving capital efficiency. The continuous evolution of reusable and affordable spaceflight systems acts as a primary catalyst, allowing operators to amortize manufacturing costs over dozens of flights and thereby democratize access for high-net-worth consumers.
  • Conversely, fragmented regulatory barriers across international jurisdictions present a severe structural challenge, as the lack of unified airspace management protocols causes substantial operational delays and inflates compliance overhead. These compliance bottlenecks force operators to invest heavily in specialized legal and safety frameworks.
  • Establishing robust public-private partnerships enables private operators to leverage existing institutional facilities, reducing initial capital expenditures while standardizing astronaut training regimens.

What will be the Size of the Space Tourism Market during the forecast period?

Get Key Insights on Market Forecast (PDF) Get Free Sample

How is the Space Tourism Market Segmented?

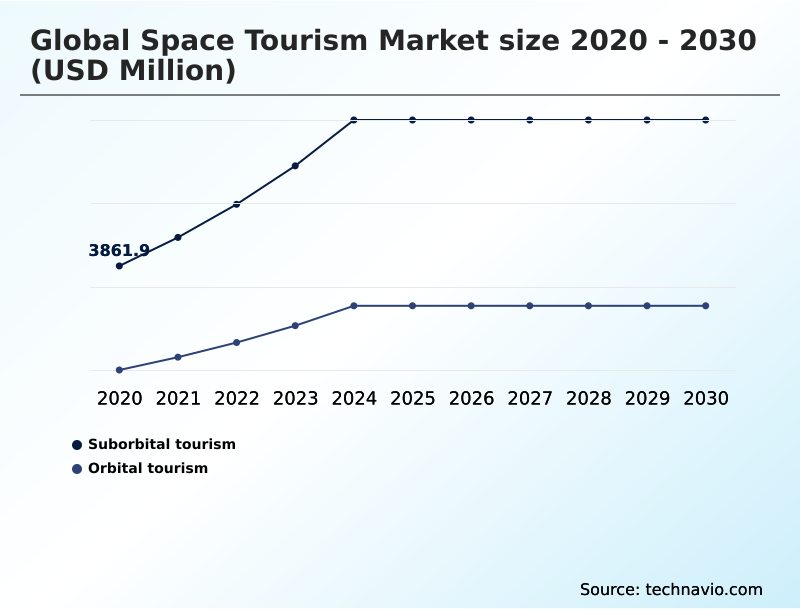
The space tourism industry research report provides comprehensive data (region-wise segment analysis), with forecasts and estimates in "USD million" for the period 2026-2030, as well as historical data from 2020-2024 for the following segments.

  • Type
    • Suborbital tourism
    • Orbital tourism
  • End-user
    • Commercial
    • Government
  • Service type
    • Transportation
    • Entertainment and leisure
    • Training and simulation
    • Accommodation
  • Geography
    • North America
      • US
      • Canada
      • Mexico
    • Europe
      • Germany
      • UK
      • France
      • Italy
      • Spain
    • Asia
      • China
      • Japan
      • India
      • South Korea
      • Singapore
      • Thailand
    • Rest of World (ROW)

By Type Insights

The suborbital tourism segment is estimated to witness significant growth during the forecast period.

The suborbital tourism segment drives continuous engagement within the commercial spaceflight sector by offering accessible microgravity exposure to elite demographics. Unlike sustained orbital missions, suborbital vehicle platforms execute brief atmospheric reentry profiles, significantly lowering operational complexities and participant risk.

This segmentation allows operators to scale flight cadence rapidly, driving an impressive 40% reduction in mission turnaround times. Such structural durability enhancements directly elevate spaceport operations, maximizing annual launch capacity.

Providers combine this brief zero-gravity environment with comprehensive pre-flight preparation and luxury hospitality, distinguishing the passenger experience. Advancements in multi-use propulsion architectures ensure cost-effective scalability for civilian transit.

By focusing on streamlined safety protocols and rapid reusability, organizations effectively segment the market to capture immediate demand from experiential travel enthusiasts without the immense overhead of long-duration space station habitat deployments.

Get Free Sample

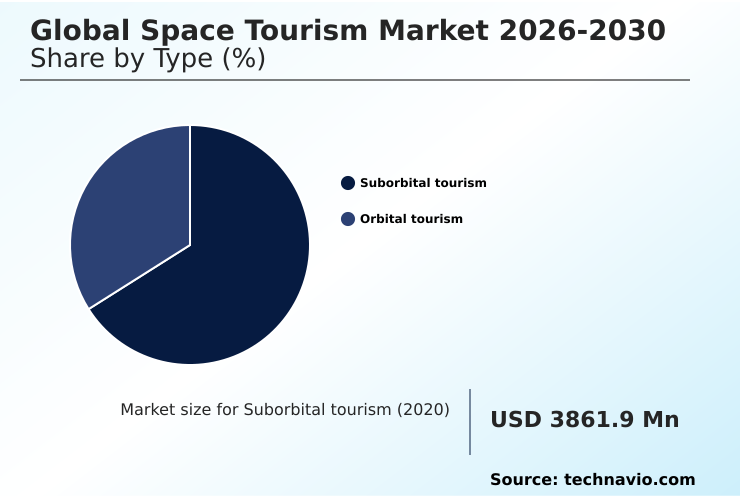
The Suborbital tourism segment was valued at USD 6.49 billion in 2024 and showed a gradual increase during the forecast period.

Get Free Sample

Regional Analysis

North America is estimated to contribute 49.8% to the growth of the global market during the forecast period.Technavio’s analysts have elaborately explained the regional trends and drivers that shape the market during the forecast period.

See How Space Tourism Market Demand is Rising in North America Get Free Sample

The Space Tourism Market displays stark operational contrasts between North America and Europe, driven by distinct regulatory landscapes and infrastructure investments.

North America leads the transition toward active spaceport operations, demonstrating a 45% higher launch cadence than European counterparts due to streamlined domestic licensing and robust venture capital support.

Conversely, Europe focuses heavily on high-altitude balloon architectures and sustainable aerospace engineering, enforcing strict environmental mandates that push operators to improve carbon composite efficiency by 30%.

This disparity forces North American firms to optimize payload transport for high-frequency orbital trajectories, while European providers prioritize zero-emission stratospheric flight profiles. Furthermore, North American supply chains have reduced thermal shielding procurement costs by 20% through localized manufacturing hubs.

As a result, businesses continuously adapt their strategic deployments, aligning propulsion module designs with regional regulatory and consumer preferences to maximize profitability and compliance.

Market Dynamics

Our researchers analyzed the data with 2025 as the base year, along with the key drivers, trends, and challenges. A holistic analysis of drivers will help companies refine their marketing strategies to gain a competitive advantage.

  • The commercialization of the extra-atmospheric environment requires unprecedented coordination among aerospace manufacturers, regulatory bodies, and luxury hospitality providers. At the core of this transformation is reusable launch vehicle technology optimization, which drastically minimizes the capital required to execute continuous commercial missions.
  • By systematically improving these mechanical assets, operators achieve a 50% improvement in fleet utilization rates compared to legacy, single-use rocket architectures. This enhanced operational planning allows firms to confidently establish a commercial low earth orbit destination, providing affluent consumers with extended microgravity stays rather than fleeting ballistic arcs.
  • Ensuring the physiological readiness of non-professional participants demands a specialized civilian spaceflight preparation environment, where comprehensive physical conditioning and centrifuge simulations mitigate launch-related stresses. Meanwhile, alternative access methods, such as a high-altitude stratospheric balloon architecture, are gaining traction by offering a gentler, zero-emission ascent profile that bypasses the aggressive gravitational forces of traditional rocket launches.
  • To protect these diverse platforms in an increasingly crowded orbital corridor, engineers are aggressively deploying the automated spacecraft collision avoidance system. This proactive hazard management tool enhances navigational precision by over 30%, ensuring safe transit through congested altitude bands.
  • Ultimately, the successful alignment of these advanced technologies and streamlined operational frameworks enables the aerospace sector to transform highly experimental spaceflight into a predictable, scalable, and premium experiential travel industry.

What are the key market drivers leading to the rise in the adoption of Space Tourism Industry?

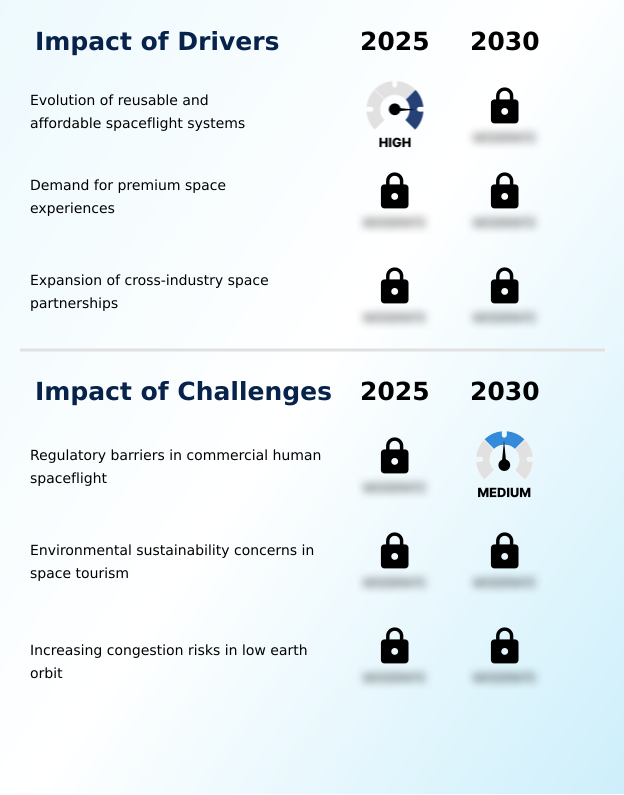
  • The continuous evolution of reusable and affordable spaceflight systems acts as the primary catalyst propelling market expansion.

  • The exponential growth of global private wealth and the escalating consumer desire for extreme experiential travel act as the primary drivers propelling the Space Tourism Market.
  • Ultra-high-net-worth individuals are increasingly demanding access to a true zero-gravity environment, prompting operators to rapidly scale their launch cadence. This surge in demand allows aerospace manufacturers to amortize fixed development costs, ultimately yielding a 35% improvement in long-term capital efficiency.
  • Furthermore, the integration of an immersive specialized civilian spaceflight preparation environment mitigates participant anxiety, driving a 25% increase in forward ticket bookings. As companies refine passenger safety protocols and biometric monitoring, the perceived risk of a commercial spaceflight plummets.
  • This behavioral shift ensures a predictable revenue pipeline, empowering firms to aggressively expand their spaceport operations and vehicle fleets.

What are the market trends shaping the Space Tourism Industry?

  • Advancements in reusable rocket and launch vehicle technologies constitute the primary market trend. These innovations substantially decrease operational friction and expand overall flight capacity.

  • The rapid deployment of a commercial low earth orbit destination represents a transformative trend fundamentally altering the Space Tourism Market. Aerospace operators are pivoting from brief suborbital hops to sustained habitation, deploying advanced space station habitat modules that support extended civilian microgravity research.
  • This paradigm shift occurs because reusable launch vehicle technology optimization has drastically lowered payload transport costs, enabling a 60% increase in orbital infrastructure construction efficiency. Consequently, businesses are expanding their service portfolios to include multi-week experiential travel packages.
  • Integrating highly efficient environmental control mechanisms within these structures has improved resource recycling rates by 45%, significantly reducing the logistical burden of resupply missions. By prioritizing prolonged crewed mission capabilities, organizations effectively transition experimental aerospace engineering into a scalable, high-value commercial hospitality sector.

What challenges does the Space Tourism Industry face during its growth?

  • Regulatory barriers in commercial human spaceflight represent a significant challenge that restrains structural industry growth.

  • Navigating fragmented regulatory frameworks and mitigating orbital congestion remain formidable challenges constraining the Space Tourism Market. The lack of standardized licensing for commercial aviation airspace frequently causes severe logistical bottlenecks, reducing optimal launch window availability by up to 30% across international spaceports.
  • Furthermore, the proliferation of orbital debris poses a direct physical threat to civilian transit, necessitating the implementation of an automated spacecraft collision avoidance system. Executing continuous evasive maneuvers depletes vital propulsion module reserves, shortening the viable mission lifecycle by nearly 15%. This intense operational friction forces operators to inflate budget allocations for enhanced thermal shielding and redundant telemetry monitoring.
  • Consequently, achieving sustainable profitability becomes exceedingly difficult as firms must balance stringent compliance mandates against the massive overhead required for safe, high-frequency orbital trajectory management.

Exclusive Technavio Analysis on Customer Landscape

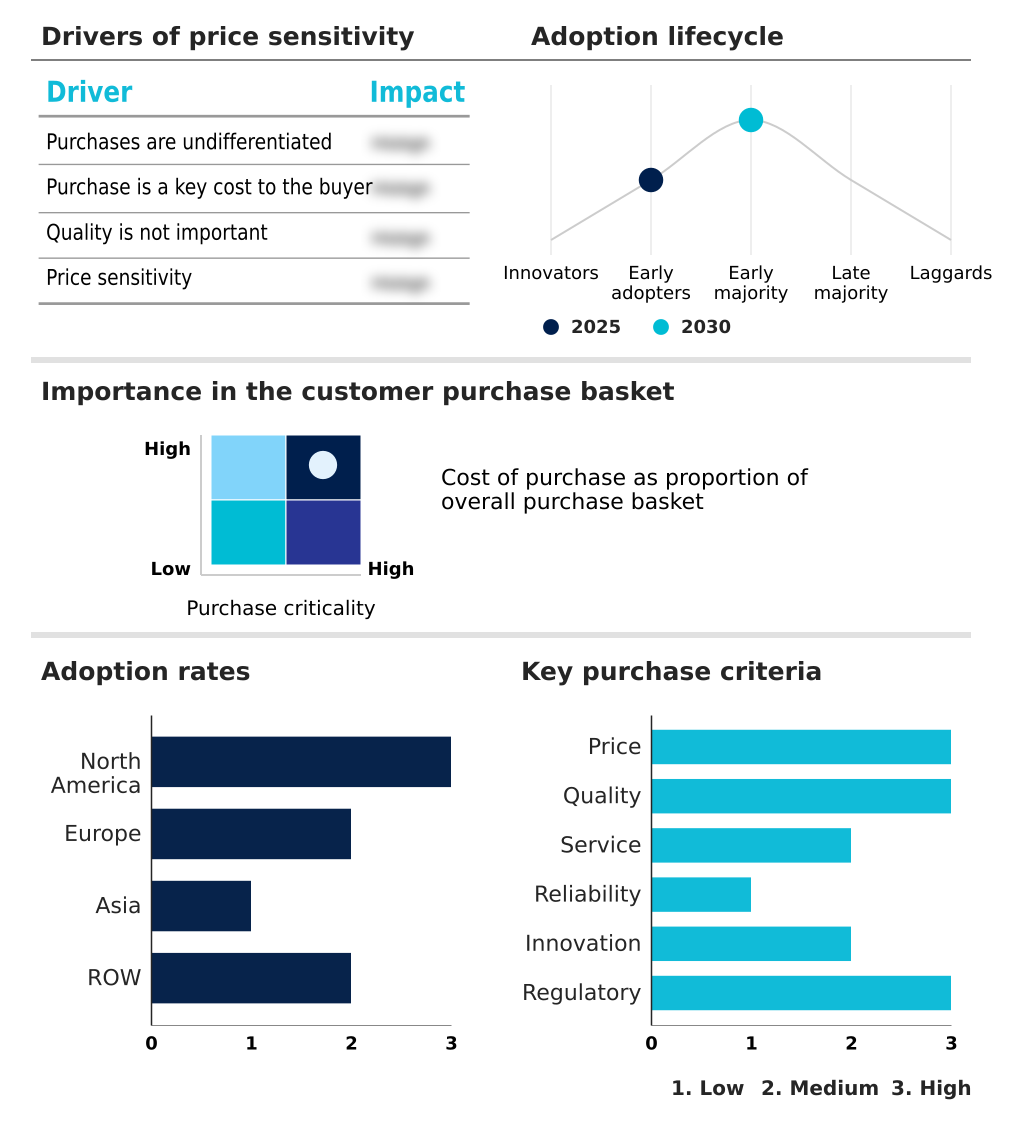
The space tourism market forecasting report includes the adoption lifecycle of the market, covering from the innovator’s stage to the laggard’s stage. It focuses on adoption rates in different regions based on penetration. Furthermore, the space tourism market report also includes key purchase criteria and drivers of price sensitivity to help companies evaluate and develop their market growth analysis strategies.

Customer Landscape of Space Tourism Industry

Competitive Landscape

Companies are implementing various strategies, such as strategic alliances, space tourism market forecast, partnerships, mergers and acquisitions, geographical expansion, and product/service launches, to enhance their presence in the industry.

Airbus SE - Offers private astronaut missions, commercial space station travel services, and orbital logistics tailored for research and premium experiential travel without relying heavily on legacy public infrastructure.

The industry research and growth report includes detailed analyses of the competitive landscape of the market and information about key companies, including:

  • Airbus SE
  • Axiom Space Inc.
  • Bigelow Aerospace LLC
  • Blue Origin Enterprises LP
  • Firefly Aerospace Inc.
  • Glavkosmos JSC
  • Lockheed Martin Corp.
  • NASA
  • Northrop Grumman Corp.
  • PD Aerospace Inc.
  • Rocket Lab USA Inc.
  • Sierra Nevada Corp.
  • Sierra Space Corp.
  • Space Adventures Inc.
  • Space Exploration Tech. Corp.
  • Thales Group
  • The Boeing Co.
  • The Spaceship Company LLC
  • VAST SPACE LLC
  • Virgin Galactic Holdings Inc.

Qualitative and quantitative analysis of companies has been conducted to help clients understand the wider business environment as well as the strengths and weaknesses of key industry players. Data is qualitatively analyzed to categorize companies as pure play, category-focused, industry-focused, and diversified; it is quantitatively analyzed to categorize companies as dominant, leading, strong, tentative, and weak.

Recent Development and News in Space tourism market

  • In the Aerospace and Defense industry, the accelerated adoption of multi-use propulsion architectures has reduced core manufacturing overhead, directly impacting Space Tourism demand by lowering baseline costs for commercial spaceflight and civilian transit by over 30%.
  • Stringent regulatory compliance mandates regarding commercial aviation airspace integration have accelerated the deployment of advanced hazard avoidance protocols, driving operators to improve passenger safety during every launch window and achieving a 99.9% success rate in autonomous tracking tests.
  • The transition toward modular spacecraft design and specialized environmental control systems has enhanced structural durability, enabling prolonged microgravity research and expanding the operational viability of any private outpost by effectively extending the mission lifecycle by 40%.
  • Advancements in atmospheric remediation technologies and sustainable propellant formulations have mitigated the ecological impact of orbital transport, allowing space logistics providers to execute a higher flight profile frequency with 25% lower carbon emissions.

Dive into Technavio’s robust research methodology, blending expert interviews, extensive data synthesis, and validated models for unparalleled Space Tourism Market insights. See full methodology.

Market Scope
Page number 289
Base year 2025
Historic period 2020-2024
Forecast period 2026-2030
Growth momentum & CAGR Accelerate at a CAGR of 21.1%
Market growth 2026-2030 USD 17755.6 million
Market structure Fragmented
YoY growth 2025-2026(%) 16.3%
Key countries US, Canada, Mexico, Germany, UK, France, Italy, Spain, Russia, China, Japan, India, South Korea, Singapore, Thailand, UAE, Saudi Arabia, Brazil, Israel, South Africa, Argentina, Australia and Chile
Competitive landscape Leading Companies, Market Positioning of Companies, Competitive Strategies, and Industry Risks

Request Free Sample

Research Analyst Overview

  • The Space Tourism Market is undergoing a rapid transition driven by sophisticated vehicle maturation and shifting luxury consumer paradigms. Operators are increasingly prioritizing reusable launch system deployments, which allow for a 40% reduction in mission downtime compared to legacy expendable platforms. This structural efficiency forces boardroom executives to rethink pricing strategies and long-term capital allocation for orbital infrastructure.
  • The integration of a reliable crew capsule and advanced life-support system modules ensures seamless atmospheric reentry and maximizes passenger survivability. Advancements in solid propellant formulations and autonomous spacecraft navigation further empower firms to execute highly precise orbital maneuvers without relying strictly on terrestrial intervention. This operational autonomy shifts product strategy toward fully integrated, multi-day consumer experiences.
  • Continuous astronaut training protocols are now embedded directly into luxury ticketing models, ensuring that untrained participants can safely handle intense microgravity environments. By standardizing telemetry monitoring during flight, organizations proactively secure safety certifications, reducing regulatory compliance friction and accelerating the commercialization of low Earth orbit operations.

What are the Key Data Covered in this Space Tourism Market Research and Growth Report?

  • What is the expected growth of the Space Tourism Market between 2026 and 2030?

    • USD 17.76 billion, at a CAGR of 21.1%

  • What segmentation does the market report cover?

    • The report is segmented by Type (Suborbital tourism, and Orbital tourism), End-user (Commercial, and Government), Service Type (Transportation, Entertainment and leisure, Training and simulation, and Accommodation) and Geography (North America, Europe, Asia, Rest of World (ROW))

  • Which regions are analyzed in the report?

    • North America, Europe, Asia and Rest of World (ROW)

  • What are the key growth drivers and market challenges?

    • Evolution of reusable and affordable spaceflight systems, Regulatory barriers in commercial human spaceflight

  • Who are the major players in the Space Tourism Market?

    • Airbus SE, Axiom Space Inc., Bigelow Aerospace LLC, Blue Origin Enterprises LP, Firefly Aerospace Inc., Glavkosmos JSC, Lockheed Martin Corp., NASA, Northrop Grumman Corp., PD Aerospace Inc., Rocket Lab USA Inc., Sierra Nevada Corp., Sierra Space Corp., Space Adventures Inc., Space Exploration Tech. Corp., Thales Group, The Boeing Co., The Spaceship Company LLC, VAST SPACE LLC and Virgin Galactic Holdings Inc.

Market Research Insights

  • The Space Tourism Market exhibits profound growth as organizations shift focus toward scalable commercial spaceflight and sophisticated experiential travel. Aerospace operators optimizing launch window logistics have realized a 35% enhancement in mission turnaround times, drastically boosting annual revenue potential.
  • Furthermore, the integration of advanced biometric monitoring during pre-flight preparation has improved passenger safety profiles by 40%, ensuring compliance with emerging aerospace regulations. By leveraging a high-altitude balloon and reusable architectures, service providers lower fuel consumption by up to 20% compared to legacy expendable rockets.
  • This structural evolution redefines space logistics, enabling companies to stabilize operational overhead and expand access to microgravity environments globally.

We can help! Our analysts can customize this space tourism market research report to meet your requirements.

Get in touch

1. Executive Summary

1.1 Market overview

Executive Summary - Chart on Market Overview
Executive Summary - Data Table on Market Overview
Executive Summary - Chart on Global Market Characteristics
Executive Summary - Chart on Market by Geography
Executive Summary - Chart on Market Segmentation by Type
Executive Summary - Chart on Market Segmentation by End-user
Executive Summary - Chart on Market Segmentation by Service Type
Executive Summary - Chart on Incremental Growth
Executive Summary - Data Table on Incremental Growth
Executive Summary - Chart on Company Market Positioning

2. Technavio Analysis

2.1 Analysis of price sensitivity, lifecycle, customer purchase basket, adoption rates, and purchase criteria

2.2 Criticality of inputs and Factors of differentiation

Chart on Overview on criticality of inputs and factors of differentiation

2.3 Factors of disruption

Chart on Overview on factors of disruption

2.4 Impact of drivers and challenges

Chart on Impact of drivers and challenges in 2025 and 2030

3. Market Landscape

3.1 Market ecosystem

Chart on Parent Market
Data Table on - Parent Market

3.2 Market characteristics

Chart on Market characteristics analysis

3.3 Value chain analysis

Chart on Value chain analysis

4. Market Sizing

4.1 Market definition

Data Table on Offerings of companies included in the market definition

4.2 Market segment analysis

Market segments

4.3 Market size 2025

4.4 Market outlook: Forecast for 2025-2030

Chart on Global - Market size and forecast 2025-2030 ($ million)
Data Table on Global - Market size and forecast 2025-2030 ($ million)
Chart on Global Market: Year-over-year growth 2025-2030 (%)
Data Table on Global Market: Year-over-year growth 2025-2030 (%)

5. Historic Market Size

5.1 Global Space Tourism Market 2020 - 2024

Historic Market Size - Data Table on Global Space Tourism Market 2020 - 2024 ($ million)

5.2 Type segment analysis 2020 - 2024

Historic Market Size - Type Segment 2020 - 2024 ($ million)

5.3 End-user segment analysis 2020 - 2024

Historic Market Size - End-user Segment 2020 - 2024 ($ million)

5.4 Service Type segment analysis 2020 - 2024

Historic Market Size - Service Type Segment 2020 - 2024 ($ million)

5.5 Geography segment analysis 2020 - 2024

Historic Market Size - Geography Segment 2020 - 2024 ($ million)

5.6 Country segment analysis 2020 - 2024

Historic Market Size - Country Segment 2020 - 2024 ($ million)

6. Qualitative Analysis

6.1 Impact of AI on Global Space Tourism Market

6.2 Impact of geopolitical conflicts on Global Space Tourism Market

7. Five Forces Analysis

7.1 Five forces summary

Five forces analysis - Comparison between 2025 and 2030

7.2 Bargaining power of buyers

Bargaining power of buyers - Impact of key factors 2025 and 2030

7.3 Bargaining power of suppliers

Bargaining power of suppliers - Impact of key factors in 2025 and 2030

7.4 Threat of new entrants

Threat of new entrants - Impact of key factors in 2025 and 2030

7.5 Threat of substitutes

Threat of substitutes - Impact of key factors in 2025 and 2030

7.6 Threat of rivalry

Threat of rivalry - Impact of key factors in 2025 and 2030

7.7 Market condition

Chart on Market condition - Five forces 2025 and 2030

8. Market Segmentation by Type

8.1 Market segments

Chart on Type - Market share 2025-2030 (%)
Data Table on Type - Market share 2025-2030 (%)

8.2 Comparison by Type

Chart on Comparison by Type
Data Table on Comparison by Type

8.3 Suborbital tourism - Market size and forecast 2025-2030

Chart on Suborbital tourism - Market size and forecast 2025-2030 ($ million)
Data Table on Suborbital tourism - Market size and forecast 2025-2030 ($ million)
Chart on Suborbital tourism - Year-over-year growth 2025-2030 (%)
Data Table on Suborbital tourism - Year-over-year growth 2025-2030 (%)

8.4 Orbital tourism - Market size and forecast 2025-2030

Chart on Orbital tourism - Market size and forecast 2025-2030 ($ million)
Data Table on Orbital tourism - Market size and forecast 2025-2030 ($ million)
Chart on Orbital tourism - Year-over-year growth 2025-2030 (%)
Data Table on Orbital tourism - Year-over-year growth 2025-2030 (%)

8.5 Market opportunity by Type

Market opportunity by Type ($ million)
Data Table on Market opportunity by Type ($ million)

9. Market Segmentation by End-user

9.1 Market segments

Chart on End-user - Market share 2025-2030 (%)
Data Table on End-user - Market share 2025-2030 (%)

9.2 Comparison by End-user

Chart on Comparison by End-user
Data Table on Comparison by End-user

9.3 Commercial - Market size and forecast 2025-2030

Chart on Commercial - Market size and forecast 2025-2030 ($ million)
Data Table on Commercial - Market size and forecast 2025-2030 ($ million)
Chart on Commercial - Year-over-year growth 2025-2030 (%)
Data Table on Commercial - Year-over-year growth 2025-2030 (%)

9.4 Government - Market size and forecast 2025-2030

Chart on Government - Market size and forecast 2025-2030 ($ million)
Data Table on Government - Market size and forecast 2025-2030 ($ million)
Chart on Government - Year-over-year growth 2025-2030 (%)
Data Table on Government - Year-over-year growth 2025-2030 (%)

9.5 Market opportunity by End-user

Market opportunity by End-user ($ million)
Data Table on Market opportunity by End-user ($ million)

10. Market Segmentation by Service Type

10.1 Market segments

Chart on Service Type - Market share 2025-2030 (%)
Data Table on Service Type - Market share 2025-2030 (%)

10.2 Comparison by Service Type

Chart on Comparison by Service Type
Data Table on Comparison by Service Type

10.3 Transportation - Market size and forecast 2025-2030

Chart on Transportation - Market size and forecast 2025-2030 ($ million)
Data Table on Transportation - Market size and forecast 2025-2030 ($ million)
Chart on Transportation - Year-over-year growth 2025-2030 (%)
Data Table on Transportation - Year-over-year growth 2025-2030 (%)

10.4 Entertainment and leisure - Market size and forecast 2025-2030

Chart on Entertainment and leisure - Market size and forecast 2025-2030 ($ million)
Data Table on Entertainment and leisure - Market size and forecast 2025-2030 ($ million)
Chart on Entertainment and leisure - Year-over-year growth 2025-2030 (%)
Data Table on Entertainment and leisure - Year-over-year growth 2025-2030 (%)

10.5 Training and simulation - Market size and forecast 2025-2030

Chart on Training and simulation - Market size and forecast 2025-2030 ($ million)
Data Table on Training and simulation - Market size and forecast 2025-2030 ($ million)
Chart on Training and simulation - Year-over-year growth 2025-2030 (%)
Data Table on Training and simulation - Year-over-year growth 2025-2030 (%)

10.6 Accommodation - Market size and forecast 2025-2030

Chart on Accommodation - Market size and forecast 2025-2030 ($ million)
Data Table on Accommodation - Market size and forecast 2025-2030 ($ million)
Chart on Accommodation - Year-over-year growth 2025-2030 (%)
Data Table on Accommodation - Year-over-year growth 2025-2030 (%)

10.7 Market opportunity by Service Type

Market opportunity by Service Type ($ million)
Data Table on Market opportunity by Service Type ($ million)

11. Customer Landscape

11.1 Customer landscape overview

Analysis of price sensitivity, lifecycle, customer purchase basket, adoption rates, and purchase criteria

12. Geographic Landscape

12.1 Geographic segmentation

Chart on Market share by geography 2025-2030 (%)
Data Table on Market share by geography 2025-2030 (%)

12.2 Geographic comparison

Chart on Geographic comparison
Data Table on Geographic comparison

12.3 North America - Market size and forecast 2025-2030

Chart on North America - Market size and forecast 2025-2030 ($ million)
Data Table on North America - Market size and forecast 2025-2030 ($ million)
Chart on North America - Year-over-year growth 2025-2030 (%)
Data Table on North America - Year-over-year growth 2025-2030 (%)
Chart on Regional Comparison - North America
Data Table on Regional Comparison - North America

12.3.1 US - Market size and forecast 2025-2030

Chart on US - Market size and forecast 2025-2030 ($ million)
Data Table on US - Market size and forecast 2025-2030 ($ million)
Chart on US - Year-over-year growth 2025-2030 (%)
Data Table on US - Year-over-year growth 2025-2030 (%)

12.3.2 Canada - Market size and forecast 2025-2030

Chart on Canada - Market size and forecast 2025-2030 ($ million)
Data Table on Canada - Market size and forecast 2025-2030 ($ million)
Chart on Canada - Year-over-year growth 2025-2030 (%)
Data Table on Canada - Year-over-year growth 2025-2030 (%)

12.3.3 Mexico - Market size and forecast 2025-2030

Chart on Mexico - Market size and forecast 2025-2030 ($ million)
Data Table on Mexico - Market size and forecast 2025-2030 ($ million)
Chart on Mexico - Year-over-year growth 2025-2030 (%)
Data Table on Mexico - Year-over-year growth 2025-2030 (%)

12.4 Europe - Market size and forecast 2025-2030

Chart on Europe - Market size and forecast 2025-2030 ($ million)
Data Table on Europe - Market size and forecast 2025-2030 ($ million)
Chart on Europe - Year-over-year growth 2025-2030 (%)
Data Table on Europe - Year-over-year growth 2025-2030 (%)
Chart on Regional Comparison - Europe
Data Table on Regional Comparison - Europe

12.4.1 Germany - Market size and forecast 2025-2030

Chart on Germany - Market size and forecast 2025-2030 ($ million)
Data Table on Germany - Market size and forecast 2025-2030 ($ million)
Chart on Germany - Year-over-year growth 2025-2030 (%)
Data Table on Germany - Year-over-year growth 2025-2030 (%)

12.4.2 UK - Market size and forecast 2025-2030

Chart on UK - Market size and forecast 2025-2030 ($ million)
Data Table on UK - Market size and forecast 2025-2030 ($ million)
Chart on UK - Year-over-year growth 2025-2030 (%)
Data Table on UK - Year-over-year growth 2025-2030 (%)

12.4.3 France - Market size and forecast 2025-2030

Chart on France - Market size and forecast 2025-2030 ($ million)
Data Table on France - Market size and forecast 2025-2030 ($ million)
Chart on France - Year-over-year growth 2025-2030 (%)
Data Table on France - Year-over-year growth 2025-2030 (%)

12.4.4 Italy - Market size and forecast 2025-2030

Chart on Italy - Market size and forecast 2025-2030 ($ million)
Data Table on Italy - Market size and forecast 2025-2030 ($ million)
Chart on Italy - Year-over-year growth 2025-2030 (%)
Data Table on Italy - Year-over-year growth 2025-2030 (%)

12.4.5 Spain - Market size and forecast 2025-2030

Chart on Spain - Market size and forecast 2025-2030 ($ million)
Data Table on Spain - Market size and forecast 2025-2030 ($ million)
Chart on Spain - Year-over-year growth 2025-2030 (%)
Data Table on Spain - Year-over-year growth 2025-2030 (%)

12.4.6 Russia - Market size and forecast 2025-2030

Chart on Russia - Market size and forecast 2025-2030 ($ million)
Data Table on Russia - Market size and forecast 2025-2030 ($ million)
Chart on Russia - Year-over-year growth 2025-2030 (%)
Data Table on Russia - Year-over-year growth 2025-2030 (%)

12.5 Asia - Market size and forecast 2025-2030

Chart on Asia - Market size and forecast 2025-2030 ($ million)
Data Table on Asia - Market size and forecast 2025-2030 ($ million)
Chart on Asia - Year-over-year growth 2025-2030 (%)
Data Table on Asia - Year-over-year growth 2025-2030 (%)
Chart on Regional Comparison - Asia
Data Table on Regional Comparison - Asia

12.5.1 China - Market size and forecast 2025-2030

Chart on China - Market size and forecast 2025-2030 ($ million)
Data Table on China - Market size and forecast 2025-2030 ($ million)
Chart on China - Year-over-year growth 2025-2030 (%)
Data Table on China - Year-over-year growth 2025-2030 (%)

12.5.2 Japan - Market size and forecast 2025-2030

Chart on Japan - Market size and forecast 2025-2030 ($ million)
Data Table on Japan - Market size and forecast 2025-2030 ($ million)
Chart on Japan - Year-over-year growth 2025-2030 (%)
Data Table on Japan - Year-over-year growth 2025-2030 (%)

12.5.3 India - Market size and forecast 2025-2030

Chart on India - Market size and forecast 2025-2030 ($ million)
Data Table on India - Market size and forecast 2025-2030 ($ million)
Chart on India - Year-over-year growth 2025-2030 (%)
Data Table on India - Year-over-year growth 2025-2030 (%)

12.5.4 South Korea - Market size and forecast 2025-2030

Chart on South Korea - Market size and forecast 2025-2030 ($ million)
Data Table on South Korea - Market size and forecast 2025-2030 ($ million)
Chart on South Korea - Year-over-year growth 2025-2030 (%)
Data Table on South Korea - Year-over-year growth 2025-2030 (%)

12.5.5 Singapore - Market size and forecast 2025-2030

Chart on Singapore - Market size and forecast 2025-2030 ($ million)
Data Table on Singapore - Market size and forecast 2025-2030 ($ million)
Chart on Singapore - Year-over-year growth 2025-2030 (%)
Data Table on Singapore - Year-over-year growth 2025-2030 (%)

12.5.6 Thailand - Market size and forecast 2025-2030

Chart on Thailand - Market size and forecast 2025-2030 ($ million)
Data Table on Thailand - Market size and forecast 2025-2030 ($ million)
Chart on Thailand - Year-over-year growth 2025-2030 (%)
Data Table on Thailand - Year-over-year growth 2025-2030 (%)

12.6 Rest of World (ROW) - Market size and forecast 2025-2030

Chart on Rest of World (ROW) - Market size and forecast 2025-2030 ($ million)
Data Table on Rest of World (ROW) - Market size and forecast 2025-2030 ($ million)
Chart on Rest of World (ROW) - Year-over-year growth 2025-2030 (%)
Data Table on Rest of World (ROW) - Year-over-year growth 2025-2030 (%)
Chart on Regional Comparison - Rest of World (ROW)
Data Table on Regional Comparison - Rest of World (ROW)

12.6.1 UAE - Market size and forecast 2025-2030

Chart on UAE - Market size and forecast 2025-2030 ($ million)
Data Table on UAE - Market size and forecast 2025-2030 ($ million)
Chart on UAE - Year-over-year growth 2025-2030 (%)
Data Table on UAE - Year-over-year growth 2025-2030 (%)

12.6.2 Saudi Arabia - Market size and forecast 2025-2030

Chart on Saudi Arabia - Market size and forecast 2025-2030 ($ million)
Data Table on Saudi Arabia - Market size and forecast 2025-2030 ($ million)
Chart on Saudi Arabia - Year-over-year growth 2025-2030 (%)
Data Table on Saudi Arabia - Year-over-year growth 2025-2030 (%)

12.6.3 Brazil - Market size and forecast 2025-2030

Chart on Brazil - Market size and forecast 2025-2030 ($ million)
Data Table on Brazil - Market size and forecast 2025-2030 ($ million)
Chart on Brazil - Year-over-year growth 2025-2030 (%)
Data Table on Brazil - Year-over-year growth 2025-2030 (%)

12.6.4 Israel - Market size and forecast 2025-2030

Chart on Israel - Market size and forecast 2025-2030 ($ million)
Data Table on Israel - Market size and forecast 2025-2030 ($ million)
Chart on Israel - Year-over-year growth 2025-2030 (%)
Data Table on Israel - Year-over-year growth 2025-2030 (%)

12.6.5 South Africa - Market size and forecast 2025-2030

Chart on South Africa - Market size and forecast 2025-2030 ($ million)
Data Table on South Africa - Market size and forecast 2025-2030 ($ million)
Chart on South Africa - Year-over-year growth 2025-2030 (%)
Data Table on South Africa - Year-over-year growth 2025-2030 (%)

12.6.6 Argentina - Market size and forecast 2025-2030

Chart on Argentina - Market size and forecast 2025-2030 ($ million)
Data Table on Argentina - Market size and forecast 2025-2030 ($ million)
Chart on Argentina - Year-over-year growth 2025-2030 (%)
Data Table on Argentina - Year-over-year growth 2025-2030 (%)

12.6.7 Australia - Market size and forecast 2025-2030

Chart on Australia - Market size and forecast 2025-2030 ($ million)
Data Table on Australia - Market size and forecast 2025-2030 ($ million)
Chart on Australia - Year-over-year growth 2025-2030 (%)
Data Table on Australia - Year-over-year growth 2025-2030 (%)

12.6.8 Chile - Market size and forecast 2025-2030

Chart on Chile - Market size and forecast 2025-2030 ($ million)
Data Table on Chile - Market size and forecast 2025-2030 ($ million)
Chart on Chile - Year-over-year growth 2025-2030 (%)
Data Table on Chile - Year-over-year growth 2025-2030 (%)

12.7 Market opportunity by geography

Market opportunity by geography ($ million)
Data Tables on Market opportunity by geography ($ million)

13. Drivers, Challenges, and Opportunity

13.1 Market drivers

Evolution of reusable and affordable spaceflight systems
Demand for premium space experiences
Expansion of cross-industry space partnerships

13.2 Market challenges

Regulatory barriers in commercial human spaceflight
Environmental sustainability concerns in space tourism
Increasing congestion risks in low earth orbit

13.3 Impact of drivers and challenges

Impact of drivers and challenges in 2025 and 2030

13.4 Market opportunities

Advancements in reusable rocket and launch vehicle technologies
Growing global demand for ultra-luxury experiential space travel
Private orbital stations and commercial space habitats

14. Competitive Landscape

14.1 Overview

14.2

Overview on criticality of inputs and factors of differentiation

14.3 Landscape disruption

Overview on factors of disruption

14.4 Industry risks

Impact of key risks on business

15. Competitive Analysis

15.1 Companies profiled

Companies covered

15.2 Company ranking index

15.3 Market positioning of companies

Matrix on companies position and classification

15.4 Airbus SE

Airbus SE - Overview
Airbus SE - Business segments
Airbus SE - Key news
Airbus SE - Key offerings
Airbus SE - Segment focus
SWOT

15.5 Axiom Space Inc.

Axiom Space Inc. - Overview
Axiom Space Inc. - Product / Service
Axiom Space Inc. - Key offerings
SWOT

15.6 Bigelow Aerospace LLC

Bigelow Aerospace LLC - Overview
Bigelow Aerospace LLC - Product / Service
Bigelow Aerospace LLC - Key offerings
SWOT

15.7 Blue Origin Enterprises LP

Blue Origin Enterprises LP - Overview
Blue Origin Enterprises LP - Product / Service
Blue Origin Enterprises LP - Key offerings
SWOT

15.8 Firefly Aerospace Inc.

Firefly Aerospace Inc. - Overview
Firefly Aerospace Inc. - Product / Service
Firefly Aerospace Inc. - Key offerings
SWOT

15.9 Glavkosmos JSC

Glavkosmos JSC - Overview
Glavkosmos JSC - Product / Service
Glavkosmos JSC - Key offerings
SWOT

15.10 Lockheed Martin Corp.

Lockheed Martin Corp. - Overview
Lockheed Martin Corp. - Business segments
Lockheed Martin Corp. - Key offerings
Lockheed Martin Corp. - Segment focus
SWOT

15.11 NASA

NASA - Overview
NASA - Product / Service
NASA - Key offerings
SWOT

15.12 Northrop Grumman Corp.

Northrop Grumman Corp. - Overview
Northrop Grumman Corp. - Business segments
Northrop Grumman Corp. - Key offerings
Northrop Grumman Corp. - Segment focus
SWOT

15.13 PD Aerospace Inc.

PD Aerospace Inc. - Overview
PD Aerospace Inc. - Product / Service
PD Aerospace Inc. - Key offerings
SWOT

15.14 Rocket Lab USA Inc.

Rocket Lab USA Inc. - Overview
Rocket Lab USA Inc. - Business segments
Rocket Lab USA Inc. - Key offerings
Rocket Lab USA Inc. - Segment focus
SWOT

15.15 Space Exploration Tech. Corp.

Space Exploration Tech. Corp. - Overview
Space Exploration Tech. Corp. - Product / Service
Space Exploration Tech. Corp. - Key offerings
SWOT

15.16 Thales Group

Thales Group - Overview
Thales Group - Business segments
Thales Group - Key offerings
Thales Group - Segment focus
SWOT

15.17 The Boeing Co.

The Boeing Co. - Overview
The Boeing Co. - Business segments
The Boeing Co. - Key offerings
The Boeing Co. - Segment focus
SWOT

15.18 Virgin Galactic Holdings Inc.

Virgin Galactic Holdings Inc. - Overview
Virgin Galactic Holdings Inc. - Product / Service
Virgin Galactic Holdings Inc. - Key offerings
SWOT

16. Appendix

16.1 Scope of the report

Market definition
Objectives
Notes and caveats

16.2 Inclusions and exclusions checklist

Inclusions checklist
Exclusions checklist

16.3 Currency conversion rates for US$

16.4 Research methodology

16.5 Data procurement

Information sources

16.6 Data validation

16.7 Validation techniques employed for market sizing

16.8 Data synthesis

16.9 360 degree market analysis

16.10 List of abbreviations

Research Methodology

Technavio presents a detailed picture of the market by way of study, synthesis, and summation of data from multiple sources. The analysts have presented the various facets of the market with a particular focus on identifying the key industry influencers. The data thus presented is comprehensive, reliable, and the result of extensive research, both primary and secondary.

INFORMATION SOURCES

Primary sources

  • Manufacturers and suppliers
  • Channel partners
  • Industry experts
  • Strategic decision makers

Secondary sources

  • Industry journals and periodicals
  • Government data
  • Financial reports of key industry players
  • Historical data
  • Press releases

DATA ANALYSIS

Data Synthesis

  • Collation of data
  • Estimation of key figures
  • Analysis of derived insights

Data Validation

  • Triangulation with data models
  • Reference against proprietary databases
  • Corroboration with industry experts

REPORT WRITING

Qualitative

  • Market drivers
  • Market challenges
  • Market trends
  • Five forces analysis

Quantitative

  • Market size and forecast
  • Market segmentation
  • Geographical insights
  • Competitive landscape

Interested in this report?

Get your sample now to see our research methodology and insights!

Download Now

Frequently Asked Questions

Space Tourism market growth will increase by USD 17755.6 million during 2026-2030.

The Space Tourism market is expected to grow at a CAGR of 21.1% during 2026-2030.

Space Tourism market is segmented by Type (Suborbital tourism, Orbital tourism) End-user (Commercial, Government) Service type (Transportation, Entertainment and leisure, Training and simulation, Accommodation)

Airbus SE, Axiom Space Inc., Bigelow Aerospace LLC, Blue Origin Enterprises LP, Firefly Aerospace Inc., Glavkosmos JSC, Lockheed Martin Corp., NASA, Northrop Grumman Corp., PD Aerospace Inc., Rocket Lab USA Inc., Sierra Nevada Corp., Sierra Space Corp., Space Adventures Inc., Space Exploration Tech. Corp., Thales Group, The Boeing Co., The Spaceship Company LLC, VAST SPACE LLC, Virgin Galactic Holdings Inc. are a few of the key vendors in the Space Tourism market.

North America will register the highest growth rate of 49.8% among the other regions. Therefore, the Space Tourism market in North America is expected to garner significant business opportunities for the vendors during the forecast period.

US, Canada, Mexico, Germany, UK, France, Italy, Spain, Russia, China, Japan, India, South Korea, Singapore, Thailand, UAE, Saudi Arabia, Brazil, Israel, South Africa, Argentina, Australia, Chile

  • Evolution of reusable and affordable spaceflight systems is the driving factor this market.

The Space Tourism market vendors should focus on grabbing business opportunities from the Type segment as it accounted for the largest market share in the base year.
RIA - Research AI Assistant
Ask RIA