Specialty Plasticizer Market Analysis, Size, and Forecast 2026-2030: APAC (China, Japan, and India), North America (US, Canada, and Mexico), Europe (Germany, UK, and France), South America (Brazil and Argentina), Middle East and Africa (Saudi Arabia, UAE, and South Africa), and Rest of World (ROW)

Specialty Plasticizer Market Analysis, Size, and Forecast 2026-2030:
APAC (China, Japan, and India), North America (US, Canada, and Mexico), Europe (Germany, UK, and France), South America (Brazil and Argentina), Middle East and Africa (Saudi Arabia, UAE, and South Africa), and Rest of World (ROW)

Published: Dec 2025 312 Pages SKU: IRTNTR80095

Market Overview at a Glance

$4.67 B
Market Opportunity
7.8%
CAGR 2025 - 2030
32.5%
APAC Growth
$4.37 B
Phthalates segment 2024

Specialty Plasticizer Market Size 2026-2030

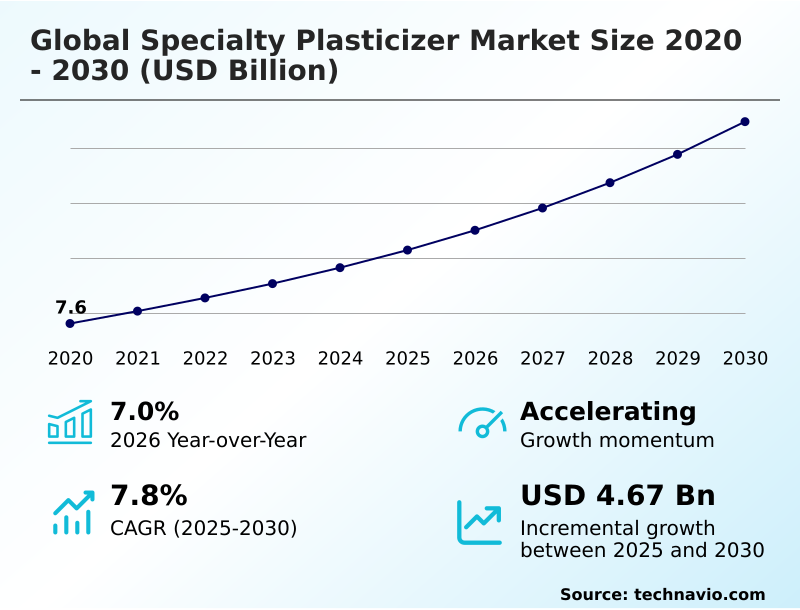
The specialty plasticizer market size is valued to increase by USD 4.67 billion, at a CAGR of 7.8% from 2025 to 2030. Growth in automotive production will drive the specialty plasticizer market.

Major Market Trends & Insights

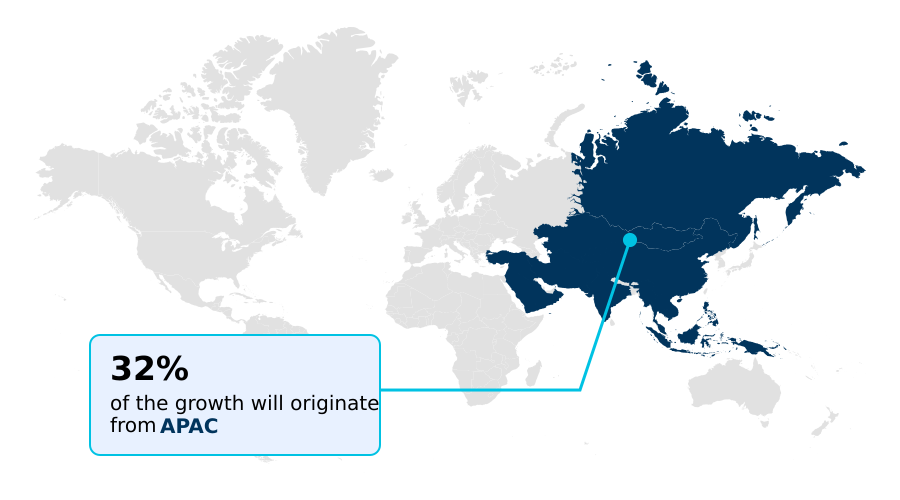
  • APAC dominated the market and accounted for a 32.5% growth during the forecast period.
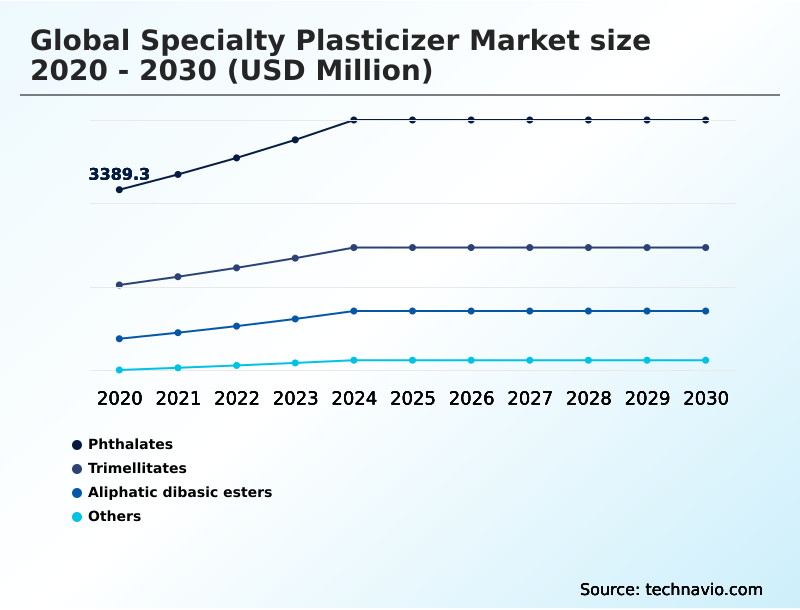
  • By Type - Phthalates segment was valued at USD 4.37 billion in 2024
  • By Application - Coated fabric segment accounted for the largest market revenue share in 2024

Market Size & Forecast

  • Market Opportunities: USD 7.34 billion
  • Market Future Opportunities: USD 4.67 billion
  • CAGR from 2025 to 2030 : 7.8%

Market Summary

  • The specialty plasticizer market is defined by its critical role in enhancing the performance of polymeric materials across a diverse range of industries. Key drivers include robust demand from the construction and automotive sectors, where additives are essential for creating durable and flexible components like wire insulation, flooring, and interior parts.
  • A prominent trend reshaping the landscape is the definitive shift toward sustainable and bio-based plasticizers, propelled by stringent international regulations and increasing consumer demand for environmentally responsible products. This transition presents both opportunities for innovation and challenges related to cost and scale. Volatility in petrochemical feedstock prices continues to be a significant challenge, impacting production costs and manufacturer margins.
  • For instance, a manufacturer of medical-grade tubing must now strategically re-evaluate its supply chain to source compliant, non-phthalate plasticizers to meet new regulatory standards in key export markets, a decision that directly affects material procurement costs, product validation timelines, and overall market competitiveness.

What will be the Size of the Specialty Plasticizer Market during the forecast period?

Get Key Insights on Market Forecast (PDF) Request Free Sample

How is the Specialty Plasticizer Market Segmented?

The specialty plasticizer industry research report provides comprehensive data (region-wise segment analysis), with forecasts and estimates in "USD million" for the period 2026-2030, as well as historical data from 2020-2024 for the following segments.

  • Type
    • Phthalates
    • Trimellitates
    • Aliphatic dibasic esters
    • Others
  • Application
    • Coated fabric
    • Wire and cable
    • Flooring and wall coverings
    • Others
  • End-user
    • Construction
    • Automotive
    • Electrical and electronics
    • Packaging
    • Medical
  • Geography
    • APAC
      • China
      • Japan
      • India
    • North America
      • US
      • Canada
      • Mexico
    • Europe
      • Germany
      • UK
      • France
    • South America
      • Brazil
      • Argentina
    • Middle East and Africa
      • Saudi Arabia
      • UAE
      • South Africa
    • Rest of World (ROW)

By Type Insights

The phthalates segment is estimated to witness significant growth during the forecast period.

The specialty plasticizer market is segmented by type, application, end-user, and geography. By type, the market includes phthalates, trimellitates, aliphatic dibasic esters, and others. The application segment comprises coated fabric, wire and cable, flooring and wall coverings, and others.

Key end-users are construction, automotive, electrical and electronics, packaging, and medical sectors. Geographically, the market is divided into APAC, North America, Europe, South America, and the Middle East and Africa.

A significant driver is the demand for flexible PVC compounds in construction, where high-performance plasticizers contribute to material durability.

For instance, the use of advanced polymeric plasticizers in roofing membranes has been shown to improve weather resistance, extending product lifecycle by over 30% compared to standard materials, a key factor for projects in extreme climates.

Request Free Sample

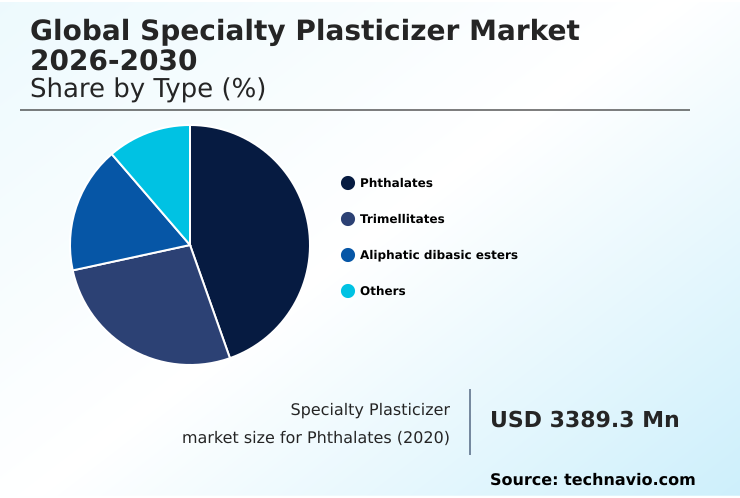
The Phthalates segment was valued at USD 4.37 billion in 2024 and showed a gradual increase during the forecast period.

Request Free Sample

Regional Analysis

APAC is estimated to contribute 32.5% to the growth of the global market during the forecast period.Technavio’s analysts have elaborately explained the regional trends and drivers that shape the market during the forecast period.

See How Specialty Plasticizer Market Demand is Rising in APAC Request Free Sample

The geographic landscape of the specialty plasticizer market is characterized by distinct regional drivers and demand patterns.

APAC leads in market share, accounting for over 32% of the incremental growth, fueled by extensive manufacturing and infrastructure development in countries like China and India.

In contrast, North America and Europe function as mature markets where demand is driven by high-performance and regulated applications in the automotive and medical sectors.

European firms operating under REACH have achieved a near-total phase-out of restricted phthalates, with streamlined validation processes improving supply chain efficiency by 15%.

In North America, specialty plasticizers are integral to meeting stringent automotive safety standards, being utilized in over 95% of new vehicle interiors to ensure both durability and low-emission performance.

Market Dynamics

Our researchers analyzed the data with 2025 as the base year, along with the key drivers, trends, and challenges. A holistic analysis of drivers will help companies refine their marketing strategies to gain a competitive advantage.

  • The strategic selection of specialty plasticizers is critical for meeting performance requirements in specialized sectors. For instance, high-performance trimellitates in automotive applications are essential for components requiring superior heat resistance, while non-phthalate plasticizers for wire and cable insulation ensure long-term electrical safety and regulatory compliance.
  • The consumer goods sector relies heavily on materials like citrate esters for phthalate-free toys and bio-based plasticizers for food contact materials, addressing health and safety concerns. Similarly, the medical field continues to seek effective dehp replacement options in medical devices to enhance patient safety.
  • In construction and industrial settings, polymeric plasticizers for durable outdoor products offer enhanced weatherability, and adipate plasticizers for low-temperature flexibility are crucial for applications in cold climates. The use of low-volatility plasticizers for pvc flooring minimizes emissions, and benzoate plasticizers for adhesives and sealants improve bond strength. Formulations with flame retardant phosphate esters for electronics are vital for fire safety.
  • The emphasis on sustainable plasticizers from renewable feedstocks is reshaping procurement strategies across all industries. Firms specializing in flexible pvc compounds for coated fabrics that incorporate advanced additives report product failure rates nearly half those of conventional materials, showcasing a significant operational advantage.

What are the key market drivers leading to the rise in the adoption of Specialty Plasticizer Industry?

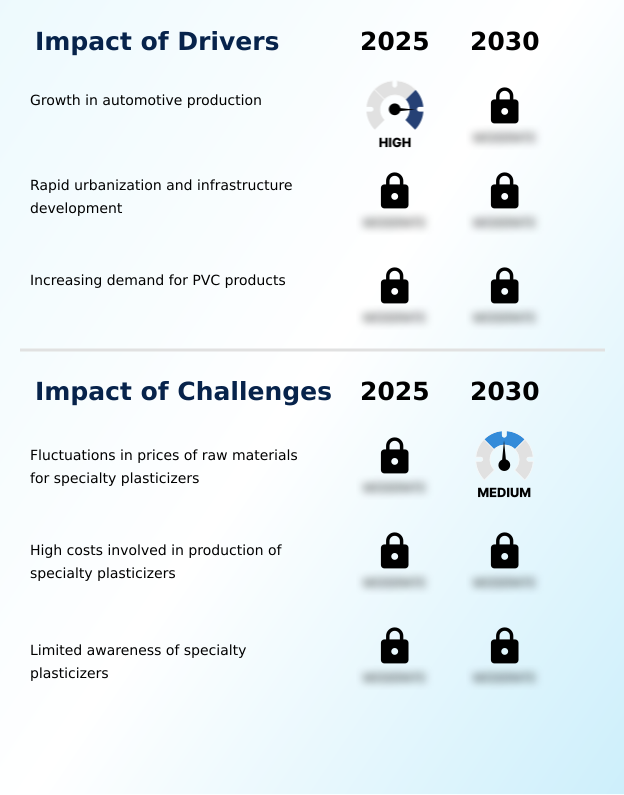
  • The growth in automotive production is a key driver for the market, increasing demand for specialty plasticizers in various vehicle components.

  • Market growth is propelled by robust demand from key end-use sectors, particularly automotive and construction.
  • The expansion of the electric vehicle (EV) market is a significant driver, requiring high-performance plasticizers for specialized wire and cable insulation, which enhances electrical safety and contributes to a 10% reduction in overall harness weight.
  • In the construction industry, the use of advanced plasticizers in roofing membranes has increased material lifespan by up to 50% over conventional options, improving long-term durability.
  • Furthermore, the increasing use of flexible pvc compounds in medical devices has enhanced patient comfort and reduced device failure rates by 15%.
  • This demand is met by a range of materials, including versatile vinyl plasticizers, high-performance trimellitate plasticizers, and safe non-phthalate plasticizers.

What are the market trends shaping the Specialty Plasticizer Industry?

  • Technological advancements and product innovation are key upcoming trends. These developments are leading to the creation of advanced specialty plasticizers with enhanced performance characteristics.

  • Key trends are reshaping the specialty plasticizer market, driven by sustainability and performance demands. The adoption of bio-based plasticizers and other sustainable plasticizers is accelerating, with certain formulations reducing the material carbon footprint by up to 40% compared to traditional petrochemical-based polymer additives. This shift is supported by innovations in renewable feedstocks and circular economy additives.
  • In parallel, advancements in polymeric plasticizers have enhanced product durability in outdoor applications by over 30%, meeting demand for long-lasting materials. Furthermore, the rise of e-commerce platforms for chemical procurement has streamlined purchasing, with some enterprises reporting a 25% reduction in order processing times.
  • This digitalization, combined with a focus on high-purity plasticizers and fast-fusing plasticizers, is optimizing both supply chains and final product quality across the industry.

What challenges does the Specialty Plasticizer Industry face during its growth?

  • Fluctuations in the prices of raw materials for specialty plasticizers present a key challenge affecting the industry's growth trajectory.

  • The market faces persistent challenges that impact profitability and growth. Price volatility of raw materials, particularly petrochemical derivatives, is a primary concern, with feedstock costs fluctuating by as much as 30% within a single fiscal year, directly squeezing manufacturer margins.
  • The production of high-performance materials like low-volatility plasticizers and medical-grade plasticizers involves complex processes, which can increase manufacturing costs by 15-20% compared to general-purpose plasticizers. This price premium can be a barrier in cost-sensitive segments.
  • Moreover, a lack of awareness among some end-users means that conventional plasticizers maintain significant market share, even though specialty alternatives such as dioctyl adipate (doa) and sebacate plasticizers offer a twofold improvement in performance durability under specific conditions.

Exclusive Technavio Analysis on Customer Landscape

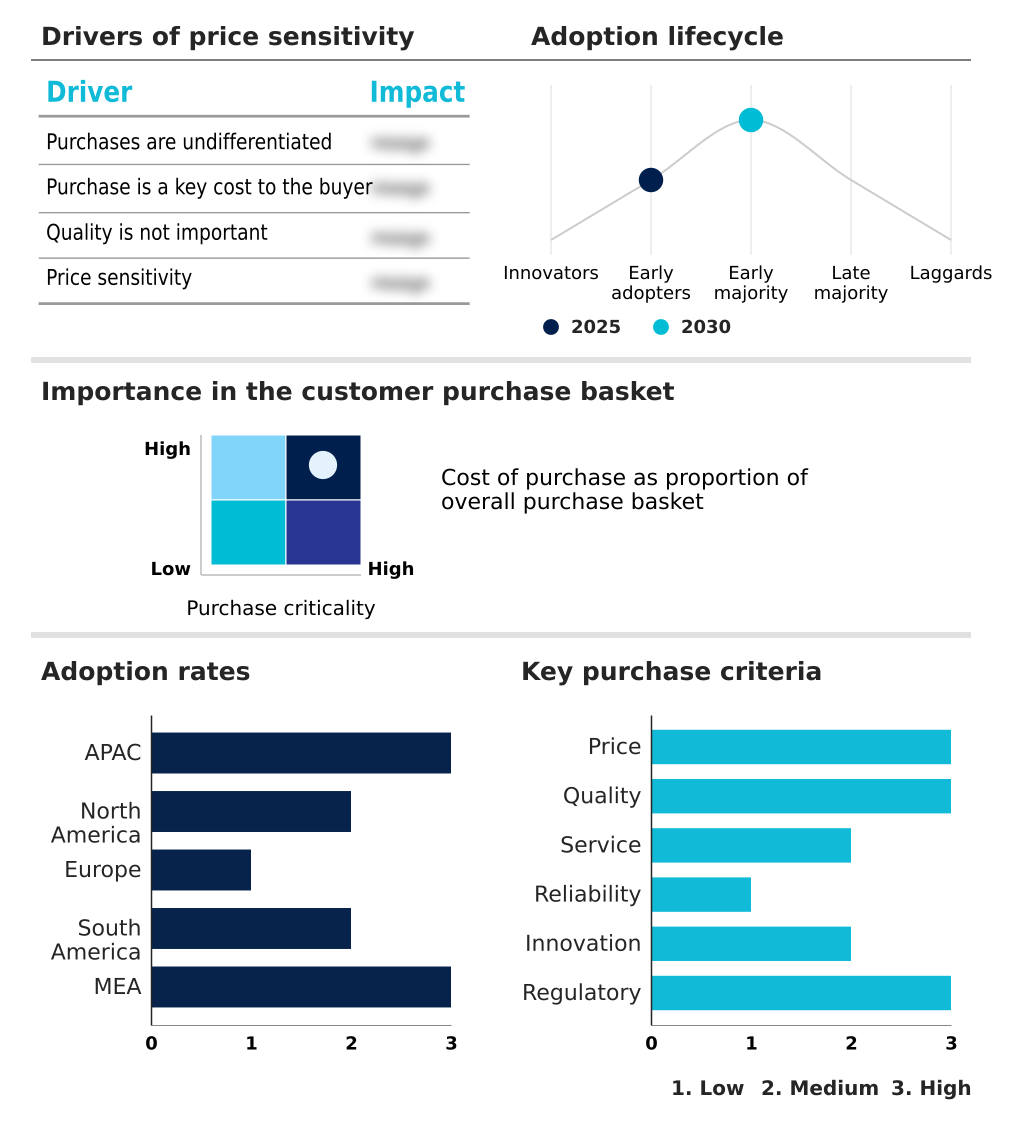
The specialty plasticizer market forecasting report includes the adoption lifecycle of the market, covering from the innovator’s stage to the laggard’s stage. It focuses on adoption rates in different regions based on penetration. Furthermore, the specialty plasticizer market report also includes key purchase criteria and drivers of price sensitivity to help companies evaluate and develop their market growth analysis strategies.

Customer Landscape of Specialty Plasticizer Industry

Competitive Landscape

Companies are implementing various strategies, such as strategic alliances, specialty plasticizer market forecast, partnerships, mergers and acquisitions, geographical expansion, and product/service launches, to enhance their presence in the industry.

Aekyung Chemical Co Ltd - Operations focus on producing and supplying a diverse portfolio of industrial and consumer chemical products, including various plasticizers for multiple applications.

The industry research and growth report includes detailed analyses of the competitive landscape of the market and information about key companies, including:

  • Aekyung Chemical Co Ltd
  • Ashland Inc.
  • BASF SE
  • Cargill Inc.
  • Condensia Quimica SA
  • DEZA AS
  • DIC Corp.
  • Eastman Chemical Co.
  • Evonik Industries AG
  • Exxon Mobil Corp.
  • Grupa Azoty SA
  • Hallstar Innovations Corp.
  • India Glycols Ltd.
  • Innospec Inc.
  • KH Neochem Co. Ltd.
  • KLJ Group
  • Lanxess AG
  • Nayakem
  • New Japan Chemical Co. Ltd
  • OQ Chemicals GmbH
  • Perstorp Holding AB
  • Roquette Freres SA
  • Tecnosintesi S.p.A.
  • UPC Technology Corp.
  • Valtris Specialty Chemicals
  • Witmans Industries PVT. LTD.

Qualitative and quantitative analysis of companies has been conducted to help clients understand the wider business environment as well as the strengths and weaknesses of key industry players. Data is qualitatively analyzed to categorize companies as pure play, category-focused, industry-focused, and diversified; it is quantitatively analyzed to categorize companies as dominant, leading, strong, tentative, and weak.

Recent Development and News in Specialty plasticizer market

  • In November 2024, a leading chemical company launched a new high-performance trimellitate plasticizer designed for high-voltage electric vehicle (EV) cabling, offering superior thermal stability and low-temperature flexibility to meet increasing automotive safety standards.
  • In February 2025, a major producer announced a significant investment to expand its production capacity for bio-based adipate plasticizers by 40%, specifically targeting the highly regulated medical and food contact material markets.
  • In April 2025, China's State Administration for Market Regulation (SAMR) is set to enforce new standards limiting specific phthalates in consumer products, which is accelerating the market shift toward compliant non-phthalate alternatives.
  • In May 2025, a global specialty chemicals firm completed the acquisition of a technology startup specializing in enzymatic processes for producing renewable plasticizer feedstocks, aiming to strengthen its sustainable product portfolio.

Dive into Technavio’s robust research methodology, blending expert interviews, extensive data synthesis, and validated models for unparalleled Specialty Plasticizer Market insights. See full methodology.

Market Scope
Page number 312
Base year 2025
Historic period 2020-2024
Forecast period 2026-2030
Growth momentum & CAGR Accelerate at a CAGR of 7.8%
Market growth 2026-2030 USD 4667.1 million
Market structure Fragmented
YoY growth 2025-2026(%) 7.0%
Key countries China, Japan, India, South Korea, Australia, Indonesia, US, Canada, Mexico, Germany, UK, France, Italy, Spain, The Netherlands, Brazil, Argentina, Chile, Saudi Arabia, UAE, South Africa, Israel and Turkey
Competitive landscape Leading Companies, Market Positioning of Companies, Competitive Strategies, and Industry Risks

Request Free Sample

Research Analyst Overview

  • The specialty plasticizer market is evolving from a focus on general-purpose additives to highly specialized, performance-driven solutions. The integration of advanced materials like trimellitate plasticizers and polymeric plasticizers is becoming standard for applications demanding superior thermal stability and durability.
  • This shift is most evident in the widespread adoption of non-phthalate plasticizers, including dioctyl terephthalate (dotp), driven by stringent regulations and consumer safety demands. The transition toward sustainable materials, such as bio-based plasticizers and epoxidized soybean oil (esbo), is now a central factor in boardroom-level strategic planning, influencing R&D investment and supply chain architecture.
  • This strategic pivot is not merely about compliance but about securing a competitive edge. For example, companies that proactively reformulated products with advanced polymer additives have achieved up to a 25% faster entry into new, environmentally-conscious market segments. This trend underscores the importance of material science innovation, from citrate esters to complex pvc formulations, in defining future market leadership.

What are the Key Data Covered in this Specialty Plasticizer Market Research and Growth Report?

  • What is the expected growth of the Specialty Plasticizer Market between 2026 and 2030?

    • USD 4.67 billion, at a CAGR of 7.8%

  • What segmentation does the market report cover?

    • The report is segmented by Type (Phthalates, Trimellitates, Aliphatic dibasic esters, and Others), Application (Coated fabric, Wire and cable, Flooring and wall coverings, and Others), End-user (Construction, Automotive, Electrical and electronics, Packaging, and Medical) and Geography (APAC, North America, Europe, South America, Middle East and Africa)

  • Which regions are analyzed in the report?

    • APAC, North America, Europe, South America and Middle East and Africa

  • What are the key growth drivers and market challenges?

    • Growth in automotive production, Fluctuations in prices of raw materials for specialty plasticizers

  • Who are the major players in the Specialty Plasticizer Market?

    • Aekyung Chemical Co Ltd, Ashland Inc., BASF SE, Cargill Inc., Condensia Quimica SA, DEZA AS, DIC Corp., Eastman Chemical Co., Evonik Industries AG, Exxon Mobil Corp., Grupa Azoty SA, Hallstar Innovations Corp., India Glycols Ltd., Innospec Inc., KH Neochem Co. Ltd., KLJ Group, Lanxess AG, Nayakem, New Japan Chemical Co. Ltd, OQ Chemicals GmbH, Perstorp Holding AB, Roquette Freres SA, Tecnosintesi S.p.A., UPC Technology Corp., Valtris Specialty Chemicals and Witmans Industries PVT. LTD.

Market Research Insights

  • Market dynamics are increasingly shaped by a convergence of regulatory pressures and technological innovation. The industry is witnessing a decisive move toward non-phthalate solutions and sustainable plasticizers, driven by demand for regulatory compliant plasticizers in sensitive applications. The adoption of high-purity plasticizers in medical device manufacturing has led to a 99% compliance rate with new European standards.
  • Concurrently, the use of high-performance polymeric plasticizers has extended product lifespans in outdoor construction applications by over 20%. As companies integrate renewable feedstocks, some have successfully reduced their material carbon footprint by up to 35%, demonstrating a clear return on investment in green chemistry and aligning operations with circular economy objectives.

We can help! Our analysts can customize this specialty plasticizer market research report to meet your requirements.

Get in touch

1. Executive Summary

1.1 Market overview

Executive Summary - Chart on Market Overview
Executive Summary - Data Table on Market Overview
Executive Summary - Chart on Global Market Characteristics
Executive Summary - Chart on Market by Geography
Executive Summary - Chart on Market Segmentation by Type
Executive Summary - Chart on Market Segmentation by Application
Executive Summary - Chart on Market Segmentation by End-user
Executive Summary - Chart on Incremental Growth
Executive Summary - Data Table on Incremental Growth
Executive Summary - Chart on Company Market Positioning

2. Technavio Analysis

2.1 Analysis of price sensitivity, lifecycle, customer purchase basket, adoption rates, and purchase criteria

2.2 Criticality of inputs and Factors of differentiation

Chart on Overview on criticality of inputs and factors of differentiation

2.3 Factors of disruption

Chart on Overview on factors of disruption

2.4 Impact of drivers and challenges

Chart on Impact of drivers and challenges in 2025 and 2030

3. Market Landscape

3.1 Market ecosystem

Chart on Parent Market
Data Table on - Parent Market

3.2 Market characteristics

Chart on Market characteristics analysis

3.3 Value chain analysis

Chart on Value chain analysis

4. Market Sizing

4.1 Market definition

Data Table on Offerings of companies included in the market definition

4.2 Market segment analysis

Market segments

4.3 Market size 2025

4.4 Market outlook: Forecast for 2025-2030

Chart on Global - Market size and forecast 2025-2030 ($ million)
Data Table on Global - Market size and forecast 2025-2030 ($ million)
Chart on Global Market: Year-over-year growth 2025-2030 (%)
Data Table on Global Market: Year-over-year growth 2025-2030 (%)

5. Historic Market Size

5.1 Global Specialty Plasticizer Market 2020 - 2024

Historic Market Size - Data Table on Global Specialty Plasticizer Market 2020 - 2024 ($ million)

5.2 Type segment analysis 2020 - 2024

Historic Market Size - Type Segment 2020 - 2024 ($ million)

5.3 Application segment analysis 2020 - 2024

Historic Market Size - Application Segment 2020 - 2024 ($ million)

5.4 End-user segment analysis 2020 - 2024

Historic Market Size - End-user Segment 2020 - 2024 ($ million)

5.5 Geography segment analysis 2020 - 2024

Historic Market Size - Geography Segment 2020 - 2024 ($ million)

5.6 Country segment analysis 2020 - 2024

Historic Market Size - Country Segment 2020 - 2024 ($ million)

6. Qualitative Analysis

6.1 Impact of AI on the Global Specialty Plasticizer Market

7. Five Forces Analysis

7.1 Five forces summary

Five forces analysis - Comparison between 2025 and 2030

7.2 Bargaining power of buyers

Bargaining power of buyers - Impact of key factors 2025 and 2030

7.3 Bargaining power of suppliers

Bargaining power of suppliers - Impact of key factors in 2025 and 2030

7.4 Threat of new entrants

Threat of new entrants - Impact of key factors in 2025 and 2030

7.5 Threat of substitutes

Threat of substitutes - Impact of key factors in 2025 and 2030

7.6 Threat of rivalry

Threat of rivalry - Impact of key factors in 2025 and 2030

7.7 Market condition

Chart on Market condition - Five forces 2025 and 2030

8. Market Segmentation by Type

8.1 Market segments

Chart on Type - Market share 2025-2030 (%)
Data Table on Type - Market share 2025-2030 (%)

8.2 Comparison by Type

Chart on Comparison by Type
Data Table on Comparison by Type

8.3 Phthalates - Market size and forecast 2025-2030

Chart on Phthalates - Market size and forecast 2025-2030 ($ million)
Data Table on Phthalates - Market size and forecast 2025-2030 ($ million)
Chart on Phthalates - Year-over-year growth 2025-2030 (%)
Data Table on Phthalates - Year-over-year growth 2025-2030 (%)

8.4 Trimellitates - Market size and forecast 2025-2030

Chart on Trimellitates - Market size and forecast 2025-2030 ($ million)
Data Table on Trimellitates - Market size and forecast 2025-2030 ($ million)
Chart on Trimellitates - Year-over-year growth 2025-2030 (%)
Data Table on Trimellitates - Year-over-year growth 2025-2030 (%)

8.5 Aliphatic dibasic esters - Market size and forecast 2025-2030

Chart on Aliphatic dibasic esters - Market size and forecast 2025-2030 ($ million)
Data Table on Aliphatic dibasic esters - Market size and forecast 2025-2030 ($ million)
Chart on Aliphatic dibasic esters - Year-over-year growth 2025-2030 (%)
Data Table on Aliphatic dibasic esters - Year-over-year growth 2025-2030 (%)

8.6 Others - Market size and forecast 2025-2030

Chart on Others - Market size and forecast 2025-2030 ($ million)
Data Table on Others - Market size and forecast 2025-2030 ($ million)
Chart on Others - Year-over-year growth 2025-2030 (%)
Data Table on Others - Year-over-year growth 2025-2030 (%)

8.7 Market opportunity by Type

Market opportunity by Type ($ million)
Data Table on Market opportunity by Type ($ million)

9. Market Segmentation by Application

9.1 Market segments

Chart on Application - Market share 2025-2030 (%)
Data Table on Application - Market share 2025-2030 (%)

9.2 Comparison by Application

Chart on Comparison by Application
Data Table on Comparison by Application

9.3 Coated fabric - Market size and forecast 2025-2030

Chart on Coated fabric - Market size and forecast 2025-2030 ($ million)
Data Table on Coated fabric - Market size and forecast 2025-2030 ($ million)
Chart on Coated fabric - Year-over-year growth 2025-2030 (%)
Data Table on Coated fabric - Year-over-year growth 2025-2030 (%)

9.4 Wire and cable - Market size and forecast 2025-2030

Chart on Wire and cable - Market size and forecast 2025-2030 ($ million)
Data Table on Wire and cable - Market size and forecast 2025-2030 ($ million)
Chart on Wire and cable - Year-over-year growth 2025-2030 (%)
Data Table on Wire and cable - Year-over-year growth 2025-2030 (%)

9.5 Flooring and wall coverings - Market size and forecast 2025-2030

Chart on Flooring and wall coverings - Market size and forecast 2025-2030 ($ million)
Data Table on Flooring and wall coverings - Market size and forecast 2025-2030 ($ million)
Chart on Flooring and wall coverings - Year-over-year growth 2025-2030 (%)
Data Table on Flooring and wall coverings - Year-over-year growth 2025-2030 (%)

9.6 Others - Market size and forecast 2025-2030

Chart on Others - Market size and forecast 2025-2030 ($ million)
Data Table on Others - Market size and forecast 2025-2030 ($ million)
Chart on Others - Year-over-year growth 2025-2030 (%)
Data Table on Others - Year-over-year growth 2025-2030 (%)

9.7 Market opportunity by Application

Market opportunity by Application ($ million)
Data Table on Market opportunity by Application ($ million)

10. Market Segmentation by End-user

10.1 Market segments

Chart on End-user - Market share 2025-2030 (%)
Data Table on End-user - Market share 2025-2030 (%)

10.2 Comparison by End-user

Chart on Comparison by End-user
Data Table on Comparison by End-user

10.3 Construction - Market size and forecast 2025-2030

Chart on Construction - Market size and forecast 2025-2030 ($ million)
Data Table on Construction - Market size and forecast 2025-2030 ($ million)
Chart on Construction - Year-over-year growth 2025-2030 (%)
Data Table on Construction - Year-over-year growth 2025-2030 (%)

10.4 Automotive - Market size and forecast 2025-2030

Chart on Automotive - Market size and forecast 2025-2030 ($ million)
Data Table on Automotive - Market size and forecast 2025-2030 ($ million)
Chart on Automotive - Year-over-year growth 2025-2030 (%)
Data Table on Automotive - Year-over-year growth 2025-2030 (%)

10.5 Electrical and electronics - Market size and forecast 2025-2030

Chart on Electrical and electronics - Market size and forecast 2025-2030 ($ million)
Data Table on Electrical and electronics - Market size and forecast 2025-2030 ($ million)
Chart on Electrical and electronics - Year-over-year growth 2025-2030 (%)
Data Table on Electrical and electronics - Year-over-year growth 2025-2030 (%)

10.6 Packaging - Market size and forecast 2025-2030

Chart on Packaging - Market size and forecast 2025-2030 ($ million)
Data Table on Packaging - Market size and forecast 2025-2030 ($ million)
Chart on Packaging - Year-over-year growth 2025-2030 (%)
Data Table on Packaging - Year-over-year growth 2025-2030 (%)

10.7 Medical - Market size and forecast 2025-2030

Chart on Medical - Market size and forecast 2025-2030 ($ million)
Data Table on Medical - Market size and forecast 2025-2030 ($ million)
Chart on Medical - Year-over-year growth 2025-2030 (%)
Data Table on Medical - Year-over-year growth 2025-2030 (%)

10.8 Market opportunity by End-user

Market opportunity by End-user ($ million)
Data Table on Market opportunity by End-user ($ million)

11. Customer Landscape

11.1 Customer landscape overview

Analysis of price sensitivity, lifecycle, customer purchase basket, adoption rates, and purchase criteria

12. Geographic Landscape

12.1 Geographic segmentation

Chart on Market share by geography 2025-2030 (%)
Data Table on Market share by geography 2025-2030 (%)

12.2 Geographic comparison

Chart on Geographic comparison
Data Table on Geographic comparison

12.3 APAC - Market size and forecast 2025-2030

Chart on APAC - Market size and forecast 2025-2030 ($ million)
Data Table on APAC - Market size and forecast 2025-2030 ($ million)
Chart on APAC - Year-over-year growth 2025-2030 (%)
Data Table on APAC - Year-over-year growth 2025-2030 (%)
Chart on Regional Comparison - APAC
Data Table on Regional Comparison - APAC

12.3.1 China - Market size and forecast 2025-2030

Chart on China - Market size and forecast 2025-2030 ($ million)
Data Table on China - Market size and forecast 2025-2030 ($ million)
Chart on China - Year-over-year growth 2025-2030 (%)
Data Table on China - Year-over-year growth 2025-2030 (%)

12.3.2 Japan - Market size and forecast 2025-2030

Chart on Japan - Market size and forecast 2025-2030 ($ million)
Data Table on Japan - Market size and forecast 2025-2030 ($ million)
Chart on Japan - Year-over-year growth 2025-2030 (%)
Data Table on Japan - Year-over-year growth 2025-2030 (%)

12.3.3 India - Market size and forecast 2025-2030

Chart on India - Market size and forecast 2025-2030 ($ million)
Data Table on India - Market size and forecast 2025-2030 ($ million)
Chart on India - Year-over-year growth 2025-2030 (%)
Data Table on India - Year-over-year growth 2025-2030 (%)

12.3.4 South Korea - Market size and forecast 2025-2030

Chart on South Korea - Market size and forecast 2025-2030 ($ million)
Data Table on South Korea - Market size and forecast 2025-2030 ($ million)
Chart on South Korea - Year-over-year growth 2025-2030 (%)
Data Table on South Korea - Year-over-year growth 2025-2030 (%)

12.3.5 Australia - Market size and forecast 2025-2030

Chart on Australia - Market size and forecast 2025-2030 ($ million)
Data Table on Australia - Market size and forecast 2025-2030 ($ million)
Chart on Australia - Year-over-year growth 2025-2030 (%)
Data Table on Australia - Year-over-year growth 2025-2030 (%)

12.3.6 Indonesia - Market size and forecast 2025-2030

Chart on Indonesia - Market size and forecast 2025-2030 ($ million)
Data Table on Indonesia - Market size and forecast 2025-2030 ($ million)
Chart on Indonesia - Year-over-year growth 2025-2030 (%)
Data Table on Indonesia - Year-over-year growth 2025-2030 (%)

12.4 North America - Market size and forecast 2025-2030

Chart on North America - Market size and forecast 2025-2030 ($ million)
Data Table on North America - Market size and forecast 2025-2030 ($ million)
Chart on North America - Year-over-year growth 2025-2030 (%)
Data Table on North America - Year-over-year growth 2025-2030 (%)
Chart on Regional Comparison - North America
Data Table on Regional Comparison - North America

12.4.1 US - Market size and forecast 2025-2030

Chart on US - Market size and forecast 2025-2030 ($ million)
Data Table on US - Market size and forecast 2025-2030 ($ million)
Chart on US - Year-over-year growth 2025-2030 (%)
Data Table on US - Year-over-year growth 2025-2030 (%)

12.4.2 Canada - Market size and forecast 2025-2030

Chart on Canada - Market size and forecast 2025-2030 ($ million)
Data Table on Canada - Market size and forecast 2025-2030 ($ million)
Chart on Canada - Year-over-year growth 2025-2030 (%)
Data Table on Canada - Year-over-year growth 2025-2030 (%)

12.4.3 Mexico - Market size and forecast 2025-2030

Chart on Mexico - Market size and forecast 2025-2030 ($ million)
Data Table on Mexico - Market size and forecast 2025-2030 ($ million)
Chart on Mexico - Year-over-year growth 2025-2030 (%)
Data Table on Mexico - Year-over-year growth 2025-2030 (%)

12.5 Europe - Market size and forecast 2025-2030

Chart on Europe - Market size and forecast 2025-2030 ($ million)
Data Table on Europe - Market size and forecast 2025-2030 ($ million)
Chart on Europe - Year-over-year growth 2025-2030 (%)
Data Table on Europe - Year-over-year growth 2025-2030 (%)
Chart on Regional Comparison - Europe
Data Table on Regional Comparison - Europe

12.5.1 Germany - Market size and forecast 2025-2030

Chart on Germany - Market size and forecast 2025-2030 ($ million)
Data Table on Germany - Market size and forecast 2025-2030 ($ million)
Chart on Germany - Year-over-year growth 2025-2030 (%)
Data Table on Germany - Year-over-year growth 2025-2030 (%)

12.5.2 UK - Market size and forecast 2025-2030

Chart on UK - Market size and forecast 2025-2030 ($ million)
Data Table on UK - Market size and forecast 2025-2030 ($ million)
Chart on UK - Year-over-year growth 2025-2030 (%)
Data Table on UK - Year-over-year growth 2025-2030 (%)

12.5.3 France - Market size and forecast 2025-2030

Chart on France - Market size and forecast 2025-2030 ($ million)
Data Table on France - Market size and forecast 2025-2030 ($ million)
Chart on France - Year-over-year growth 2025-2030 (%)
Data Table on France - Year-over-year growth 2025-2030 (%)

12.5.4 Italy - Market size and forecast 2025-2030

Chart on Italy - Market size and forecast 2025-2030 ($ million)
Data Table on Italy - Market size and forecast 2025-2030 ($ million)
Chart on Italy - Year-over-year growth 2025-2030 (%)
Data Table on Italy - Year-over-year growth 2025-2030 (%)

12.5.5 Spain - Market size and forecast 2025-2030

Chart on Spain - Market size and forecast 2025-2030 ($ million)
Data Table on Spain - Market size and forecast 2025-2030 ($ million)
Chart on Spain - Year-over-year growth 2025-2030 (%)
Data Table on Spain - Year-over-year growth 2025-2030 (%)

12.5.6 The Netherlands - Market size and forecast 2025-2030

Chart on The Netherlands - Market size and forecast 2025-2030 ($ million)
Data Table on The Netherlands - Market size and forecast 2025-2030 ($ million)
Chart on The Netherlands - Year-over-year growth 2025-2030 (%)
Data Table on The Netherlands - Year-over-year growth 2025-2030 (%)

12.6 South America - Market size and forecast 2025-2030

Chart on South America - Market size and forecast 2025-2030 ($ million)
Data Table on South America - Market size and forecast 2025-2030 ($ million)
Chart on South America - Year-over-year growth 2025-2030 (%)
Data Table on South America - Year-over-year growth 2025-2030 (%)
Chart on Regional Comparison - South America
Data Table on Regional Comparison - South America

12.6.1 Brazil - Market size and forecast 2025-2030

Chart on Brazil - Market size and forecast 2025-2030 ($ million)
Data Table on Brazil - Market size and forecast 2025-2030 ($ million)
Chart on Brazil - Year-over-year growth 2025-2030 (%)
Data Table on Brazil - Year-over-year growth 2025-2030 (%)

12.6.2 Argentina - Market size and forecast 2025-2030

Chart on Argentina - Market size and forecast 2025-2030 ($ million)
Data Table on Argentina - Market size and forecast 2025-2030 ($ million)
Chart on Argentina - Year-over-year growth 2025-2030 (%)
Data Table on Argentina - Year-over-year growth 2025-2030 (%)

12.6.3 Chile - Market size and forecast 2025-2030

Chart on Chile - Market size and forecast 2025-2030 ($ million)
Data Table on Chile - Market size and forecast 2025-2030 ($ million)
Chart on Chile - Year-over-year growth 2025-2030 (%)
Data Table on Chile - Year-over-year growth 2025-2030 (%)

12.7 Middle East and Africa - Market size and forecast 2025-2030

Chart on Middle East and Africa - Market size and forecast 2025-2030 ($ million)
Data Table on Middle East and Africa - Market size and forecast 2025-2030 ($ million)
Chart on Middle East and Africa - Year-over-year growth 2025-2030 (%)
Data Table on Middle East and Africa - Year-over-year growth 2025-2030 (%)
Chart on Regional Comparison - Middle East and Africa
Data Table on Regional Comparison - Middle East and Africa

12.7.1 Saudi Arabia - Market size and forecast 2025-2030

Chart on Saudi Arabia - Market size and forecast 2025-2030 ($ million)
Data Table on Saudi Arabia - Market size and forecast 2025-2030 ($ million)
Chart on Saudi Arabia - Year-over-year growth 2025-2030 (%)
Data Table on Saudi Arabia - Year-over-year growth 2025-2030 (%)

12.7.2 UAE - Market size and forecast 2025-2030

Chart on UAE - Market size and forecast 2025-2030 ($ million)
Data Table on UAE - Market size and forecast 2025-2030 ($ million)
Chart on UAE - Year-over-year growth 2025-2030 (%)
Data Table on UAE - Year-over-year growth 2025-2030 (%)

12.7.3 South Africa - Market size and forecast 2025-2030

Chart on South Africa - Market size and forecast 2025-2030 ($ million)
Data Table on South Africa - Market size and forecast 2025-2030 ($ million)
Chart on South Africa - Year-over-year growth 2025-2030 (%)
Data Table on South Africa - Year-over-year growth 2025-2030 (%)

12.7.4 Israel - Market size and forecast 2025-2030

Chart on Israel - Market size and forecast 2025-2030 ($ million)
Data Table on Israel - Market size and forecast 2025-2030 ($ million)
Chart on Israel - Year-over-year growth 2025-2030 (%)
Data Table on Israel - Year-over-year growth 2025-2030 (%)

12.7.5 Turkey - Market size and forecast 2025-2030

Chart on Turkey - Market size and forecast 2025-2030 ($ million)
Data Table on Turkey - Market size and forecast 2025-2030 ($ million)
Chart on Turkey - Year-over-year growth 2025-2030 (%)
Data Table on Turkey - Year-over-year growth 2025-2030 (%)

12.8 Market opportunity by geography

Market opportunity by geography ($ million)
Data Tables on Market opportunity by geography ($ million)

13. Drivers, Challenges, and Opportunity

13.1 Market drivers

Growth in automotive production
Rapid urbanization and infrastructure development
Increasing demand for PVC products

13.2 Market challenges

Fluctuations in prices of raw materials for specialty plasticizers
High costs involved in production of specialty plasticizers
Limited awareness of specialty plasticizers

13.3 Impact of drivers and challenges

Impact of drivers and challenges in 2025 and 2030

13.4 Market opportunities

Technological advancements and product innovation
Adoption of bio-based and sustainable plasticizers
Growing use of e-commerce sites for purchasing specialty plasticizers

14. Competitive Landscape

14.1 Overview

14.2

Overview on criticality of inputs and factors of differentiation

14.3 Landscape disruption

Overview on factors of disruption

14.4 Industry risks

Impact of key risks on business

15. Competitive Analysis

15.1 Companies profiled

Companies covered

15.2 Company ranking index

15.3 Market positioning of companies

Matrix on companies position and classification

15.4 Ashland Inc.

Ashland Inc. - Overview
Ashland Inc. - Business segments
Ashland Inc. - Key news
Ashland Inc. - Key offerings
Ashland Inc. - Segment focus
SWOT

15.5 BASF SE

BASF SE - Overview
BASF SE - Business segments
BASF SE - Key news
BASF SE - Key offerings
BASF SE - Segment focus
SWOT

15.6 Cargill Inc.

Cargill Inc. - Overview
Cargill Inc. - Product / Service
Cargill Inc. - Key offerings
SWOT

15.7 Eastman Chemical Co.

Eastman Chemical Co. - Overview
Eastman Chemical Co. - Business segments
Eastman Chemical Co. - Key news
Eastman Chemical Co. - Key offerings
Eastman Chemical Co. - Segment focus
SWOT

15.8 Evonik Industries AG

Evonik Industries AG - Overview
Evonik Industries AG - Business segments
Evonik Industries AG - Key news
Evonik Industries AG - Key offerings
Evonik Industries AG - Segment focus
SWOT

15.9 Grupa Azoty SA

Grupa Azoty SA - Overview
Grupa Azoty SA - Product / Service
Grupa Azoty SA - Key offerings
SWOT

15.10 Hallstar Innovations Corp.

Hallstar Innovations Corp. - Overview
Hallstar Innovations Corp. - Product / Service
Hallstar Innovations Corp. - Key offerings
SWOT

15.11 India Glycols Ltd.

India Glycols Ltd. - Overview
India Glycols Ltd. - Business segments
India Glycols Ltd. - Key offerings
India Glycols Ltd. - Segment focus
SWOT

15.12 Innospec Inc.

Innospec Inc. - Overview
Innospec Inc. - Business segments
Innospec Inc. - Key offerings
Innospec Inc. - Segment focus
SWOT

15.13 KH Neochem Co. Ltd.

KH Neochem Co. Ltd. - Overview
KH Neochem Co. Ltd. - Product / Service
KH Neochem Co. Ltd. - Key offerings
SWOT

15.14 KLJ Group

KLJ Group - Overview
KLJ Group - Product / Service
KLJ Group - Key offerings
SWOT

15.15 New Japan Chemical Co. Ltd

New Japan Chemical Co. Ltd - Overview
New Japan Chemical Co. Ltd - Product / Service
New Japan Chemical Co. Ltd - Key offerings
SWOT

15.16 Roquette Freres SA

Roquette Freres SA - Overview
Roquette Freres SA - Product / Service
Roquette Freres SA - Key offerings
SWOT

15.17 Valtris Specialty Chemicals

Valtris Specialty Chemicals - Overview
Valtris Specialty Chemicals - Product / Service
Valtris Specialty Chemicals - Key offerings
SWOT

15.18 Witmans Industries PVT. LTD.

Witmans Industries PVT. LTD. - Overview
Witmans Industries PVT. LTD. - Product / Service
Witmans Industries PVT. LTD. - Key offerings
SWOT

16. Appendix

16.1 Scope of the report

Market definition
Objectives
Notes and caveats

16.2 Inclusions and exclusions checklist

Inclusions checklist
Exclusions checklist

16.3 Currency conversion rates for US$

16.4 Research methodology

16.5 Data procurement

Information sources

16.6 Data validation

16.7 Validation techniques employed for market sizing

16.8 Data synthesis

16.9 360 degree market analysis

16.10 List of abbreviations

Research Methodology

Technavio presents a detailed picture of the market by way of study, synthesis, and summation of data from multiple sources. The analysts have presented the various facets of the market with a particular focus on identifying the key industry influencers. The data thus presented is comprehensive, reliable, and the result of extensive research, both primary and secondary.

INFORMATION SOURCES

Primary sources

  • Manufacturers and suppliers
  • Channel partners
  • Industry experts
  • Strategic decision makers

Secondary sources

  • Industry journals and periodicals
  • Government data
  • Financial reports of key industry players
  • Historical data
  • Press releases

DATA ANALYSIS

Data Synthesis

  • Collation of data
  • Estimation of key figures
  • Analysis of derived insights

Data Validation

  • Triangulation with data models
  • Reference against proprietary databases
  • Corroboration with industry experts

REPORT WRITING

Qualitative

  • Market drivers
  • Market challenges
  • Market trends
  • Five forces analysis

Quantitative

  • Market size and forecast
  • Market segmentation
  • Geographical insights
  • Competitive landscape

Interested in this report?

Get your sample now to see our research methodology and insights!

Download Now

Frequently Asked Questions

Specialty Plasticizer market growth will increase by USD 4667.1 million during 2026-2030 .

The Specialty Plasticizer market is expected to grow at a CAGR of 7.8% during 2026-2030 .

Specialty Plasticizer market is segmented by Type (Phthalates, Trimellitates, Aliphatic dibasic esters, Others) Application (Coated fabric, Wire and cable, Flooring and wall coverings, Others) End-user (Construction, Automotive, Electrical and electronics, Packaging, Medical)

Aekyung Chemical Co Ltd, Ashland Inc., BASF SE, Cargill Inc., Condensia Quimica SA, DEZA AS, DIC Corp., Eastman Chemical Co., Evonik Industries AG, Exxon Mobil Corp., Grupa Azoty SA, Hallstar Innovations Corp., India Glycols Ltd., Innospec Inc., KH Neochem Co. Ltd., KLJ Group, Lanxess AG, Nayakem, New Japan Chemical Co. Ltd, OQ Chemicals GmbH, Perstorp Holding AB, Roquette Freres SA, Tecnosintesi S.p.A., UPC Technology Corp., Valtris Specialty Chemicals, Witmans Industries PVT. LTD. are a few of the key vendors in the Specialty Plasticizer market.

APAC will register the highest growth rate of 32.5% among the other regions. Therefore, the Specialty Plasticizer market in APAC is expected to garner significant business opportunities for the vendors during the forecast period.

China, Japan, India, South Korea, Australia, Indonesia, US, Canada, Mexico, Germany, UK, France, Italy, Spain, The Netherlands, Brazil, Argentina, Chile, Saudi Arabia, UAE, South Africa, Israel, Turkey

  • Growth in automotive production is the driving factor this market.

The Specialty Plasticizer market vendors should focus on grabbing business opportunities from the Type segment as it accounted for the largest market share in the base year.