Spring Water Market Analysis, Size, and Forecast 2026-2030: North America (US, Canada, and Mexico), Europe (Germany, UK, and France), APAC (China, Japan, and India), South America (Brazil, Argentina, and Colombia), Middle East and Africa (Saudi Arabia, UAE, and South Africa), and Rest of World (ROW)

Spring Water Market Analysis, Size, and Forecast 2026-2030:
North America (US, Canada, and Mexico), Europe (Germany, UK, and France), APAC (China, Japan, and India), South America (Brazil, Argentina, and Colombia), Middle East and Africa (Saudi Arabia, UAE, and South Africa), and Rest of World (ROW)

Published: Dec 2025 298 Pages SKU: IRTNTR81169

Market Overview at a Glance

$26.44 B
Market Opportunity
9.5%
CAGR 2025 - 2030
37.5%
North America Growth
$36.98 B
Plain water segment 2024

Spring Water Market Size 2026-2030

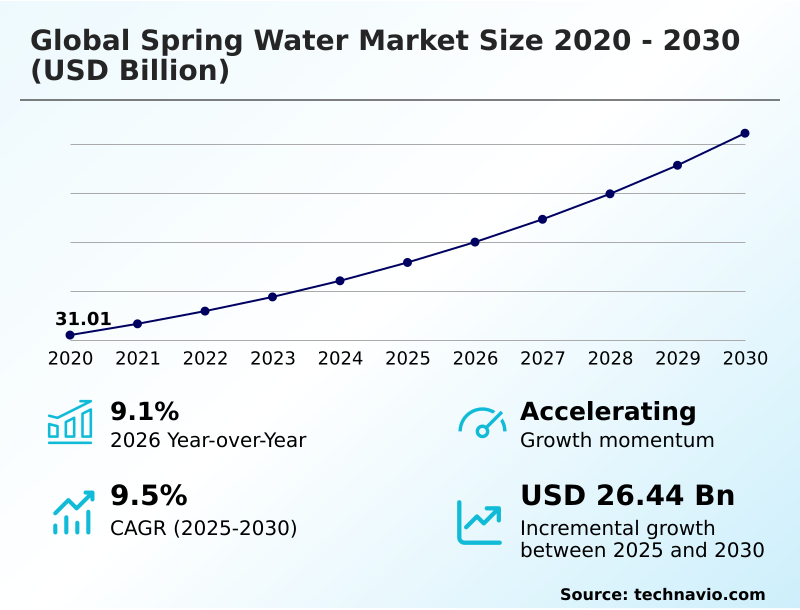
The spring water market size is valued to increase by USD 26.44 billion, at a CAGR of 9.5% from 2025 to 2030. Escalating health and wellness consciousness will drive the spring water market.

Major Market Trends & Insights

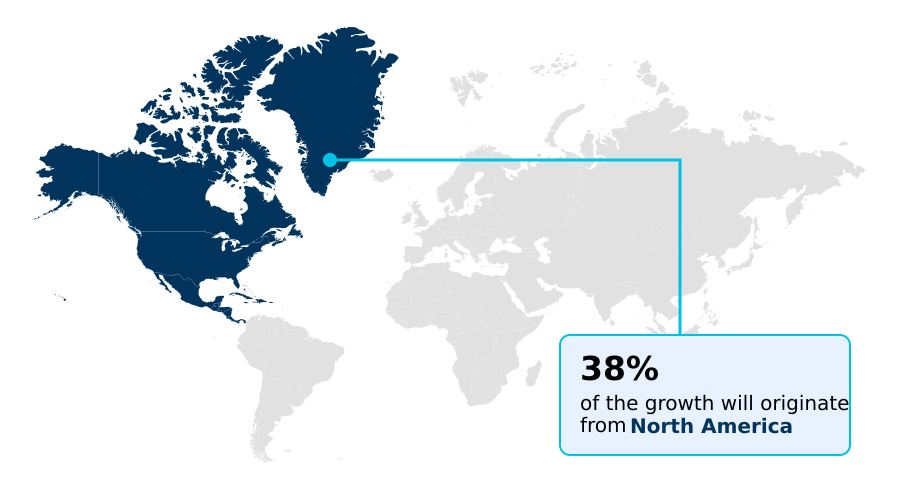
  • North America dominated the market and accounted for a 37.5% growth during the forecast period.
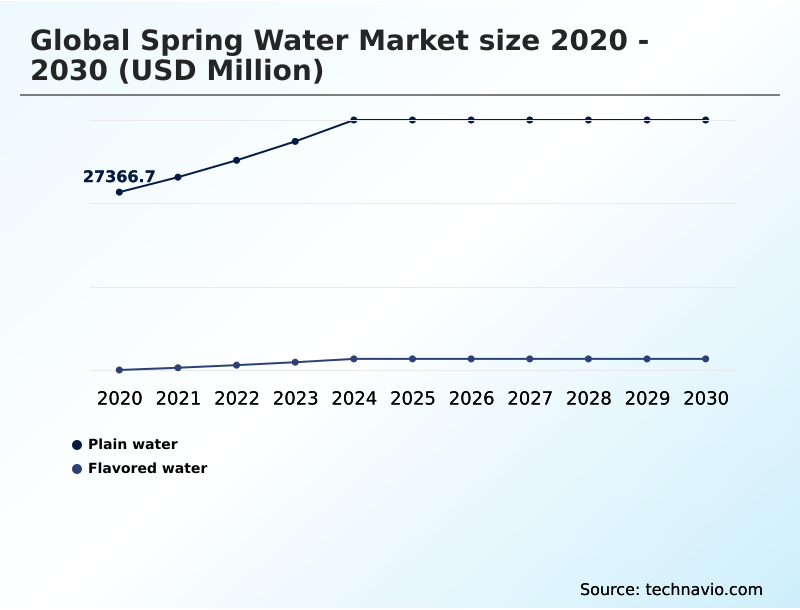
  • By Category - Plain water segment was valued at USD 36.98 billion in 2024
  • By Distribution Channel - Hypermarkets segment accounted for the largest market revenue share in 2024

Market Size & Forecast

  • Market Opportunities: USD 41.29 billion
  • Market Future Opportunities: USD 26.44 billion
  • CAGR from 2025 to 2030 : 9.5%

Market Summary

  • The spring water market is undergoing significant evolution, driven by a global consumer pivot toward health, purity, and environmental responsibility. This shift away from sugary beverages has positioned spring water, with its inherent naturalness, as a preferred hydration choice. Demand is further bolstered by concerns over municipal water quality, making the pristine origin of spring water a key differentiator.
  • The market is also being shaped by premiumization, where brands articulate unique source narratives and mineral profiles to justify higher price points. Concurrently, sustainability has become a non-negotiable aspect of operations. For instance, a key business scenario involves optimizing the supply chain to incorporate higher percentages of recycled packaging materials without disrupting production schedules or increasing costs.
  • This requires intricate logistics and sourcing strategies to meet both regulatory mandates and consumer expectations for eco-friendly products. Intense competition and the challenge of managing water resources sustainably create a complex but opportunity-rich environment for companies that can balance authenticity with innovation and responsible stewardship.

What will be the Size of the Spring Water Market during the forecast period?

Get Key Insights on Market Forecast (PDF) Request Free Sample

How is the Spring Water Market Segmented?

The spring water industry research report provides comprehensive data (region-wise segment analysis), with forecasts and estimates in "USD million" for the period 2026-2030, as well as historical data from 2020-2024 for the following segments.

  • Category
    • Plain water
    • Flavored water
  • Distribution channel
    • Hypermarkets
    • Specialty stores
    • Online
  • Application
    • PET bottles
    • Glass bottles
    • Cans
    • Others
  • Geography
    • North America
      • US
      • Canada
      • Mexico
    • Europe
      • Germany
      • UK
      • France
    • APAC
      • China
      • Japan
      • India
    • South America
      • Brazil
      • Argentina
      • Colombia
    • Middle East and Africa
      • Saudi Arabia
      • UAE
      • South Africa
    • Rest of World (ROW)

By Category Insights

The plain water segment is estimated to witness significant growth during the forecast period.

The plain water segment, including still and sparkling varieties, is the foundation of the market. Its expansion is driven by consumer preferences for transparency and naturalness.

The premiumization of water is evident as brands leverage terroir-driven marketing to highlight a unique terroir and mineral profile, creating a differentiated brand narrative. Firms utilize the direct-to-consumer (DTC) model for natural hydration solutions.

Concurrently, sustainability mandates supply chain optimization, driving innovations like bottle lightweighting technology and tethered cap design.

The adoption of eco-friendly packaging alternatives has improved material efficiency by over 15%, reflecting a core strategic focus on balancing product purity with environmental responsibility in a competitive landscape.

Request Free Sample

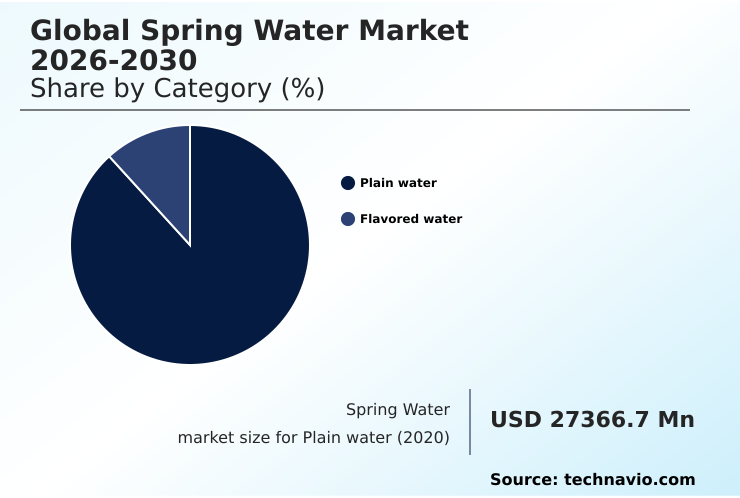
The Plain water segment was valued at USD 36.98 billion in 2024 and showed a gradual increase during the forecast period.

Request Free Sample

Regional Analysis

North America is estimated to contribute 37.5% to the growth of the global market during the forecast period.Technavio’s analysts have elaborately explained the regional trends and drivers that shape the market during the forecast period.

See How Spring Water Market Demand is Rising in North America Request Free Sample

The market's geographic landscape is diverse, with North America leading in incremental growth, contributing 37.5% of the total market expansion. This region is characterized by high consumer awareness and a competitive environment shaped by consolidation and sustainability mandates.

In contrast, the APAC region is the fastest-growing, driven by rising incomes and concerns over water safety.

Regional strategies are critical; for example, implementing efficient home and office delivery (HOD) systems has been shown to reduce last-mile distribution costs by over 20%.

Success hinges on securing borehole water collection sites, investing in water stewardship programs, and achieving carbon neutral certification. The use of food-grade recycled pet is becoming standard, moving beyond the carbonated soft drinks model.

This focus on environmental stewardship commitment is essential for maintaining market access and consumer trust across all geographies, impacting the trade of packaged drinking water.

Market Dynamics

Our researchers analyzed the data with 2025 as the base year, along with the key drivers, trends, and challenges. A holistic analysis of drivers will help companies refine their marketing strategies to gain a competitive advantage.

  • The global spring water market 2026-2030 is increasingly shaped by technical decisions at the operational level. A key area of focus is packaging, where a recycled pet vs virgin pet cost analysis is central to corporate strategy, balancing sustainability goals with financial performance.
  • The adoption of aluminum bottle packaging for spring water is a direct response to consumer demand for plastic-free options, though it requires adjustments to bottling lines. The impact of terroir on spring water taste is no longer a niche concept but a core component of terroir marketing strategies for water brands.
  • This is complemented by the rise of functional spring water with added electrolytes, which bridges hydration and wellness. Behind the scenes, spring water market supply chain logistics are being re-engineered to support both a circular economy in beverage packaging and an expansion of home delivery models for spring water.
  • Firms are evaluating an artesian vs spring water quality comparison to inform sourcing, while alkaline water health benefits analysis guides product development. This deepens the premium bottled water market segmentation. Managing consumer perception of recycled packaging is critical, especially given the water source vulnerability to climate change.
  • The challenges of single-use plastic alternatives are being addressed through lightweighting PET bottle design innovations and exploring aseptic carton water packaging benefits. Navigating the social license for water extraction through robust hydrogeological assessment for bottling plants is also paramount for long-term viability and the success of direct-to-consumer spring water subscriptions.
  • Businesses with optimized sustainability in spring water bottling practices report a 15% greater operational efficiency compared to industry laggards.

What are the key market drivers leading to the rise in the adoption of Spring Water Industry?

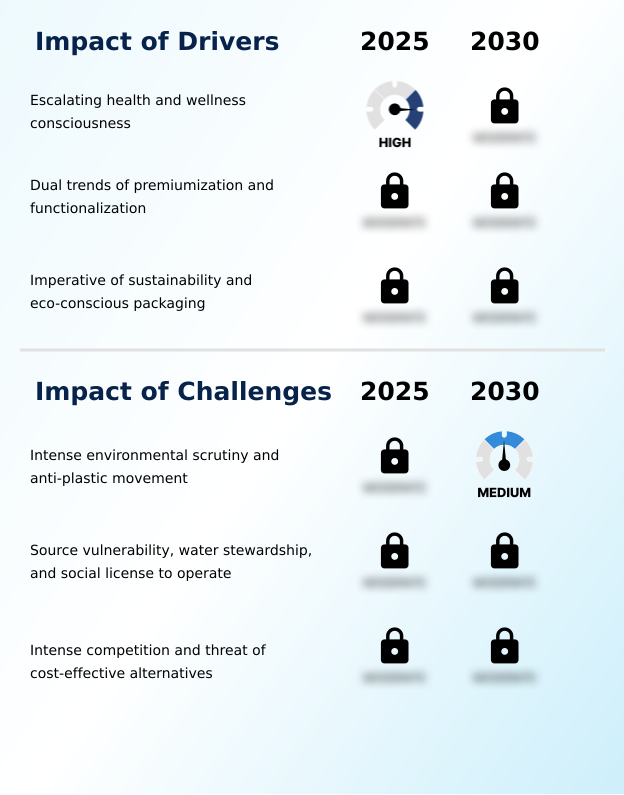
  • Escalating consumer consciousness surrounding health and wellness serves as a primary driver, fueling market expansion by shifting preferences toward natural and unprocessed beverage options.

  • The market's expansion is fundamentally propelled by health and wellness consumption trends and a strong clean-label ingredient preference. Consumers are actively choosing beverages that offer more than basic hydration, fueling the growth of the value-added beverage category.
  • This has led to a surge in functional beverage infusion, where spring water with a pure natural mineral composition is enhanced with vitamins and electrolytes.
  • The premium hospitality channel has been instrumental in this shift, showcasing products from artesian aquifer sourcing that feature unique properties like volcanic rock filtration or are marketed as alkaline spring water.
  • This premiumization has increased average unit revenue by 12% in key urban markets. The non-alcoholic beverage market is seeing spring water serve as a base for innovation, directly competing with less healthy alternatives and driving significant value growth.

What are the market trends shaping the Spring Water Industry?

  • The growing adoption of sustainable packaging and the integration of circular economy principles are emerging as a defining market trend, influencing corporate strategy and consumer preference.

  • A defining trend is the industry's wholesale strategic realignment toward a circular economy principles. This is driven by intense anti-plastic consumer sentiment and regulatory frameworks like the single-use plastics directive. The aggressive adoption of a closed-loop recycling system has become a benchmark, with leading brands achieving 100% recycled content in their bottles.
  • This shift has improved recycled PET (rPET) supply chain efficiency by over 15%. Beyond plastics, sustainable packaging materials such as aluminum and aseptic carton packaging made from plant-based renewable materials are gaining traction. This beverage packaging innovation has captured a new consumer segment, increasing market reach by 10%.
  • The establishment of beverage container deposit systems in new regions is further accelerating this transition, making sustainability a non-negotiable aspect of market strategy.

What challenges does the Spring Water Industry face during its growth?

  • The market faces a significant challenge from intense environmental scrutiny and a growing anti-plastic movement, which affects brand perception and operational strategies.

  • A formidable challenge is managing source water vulnerability and maintaining the social license to operate. This requires significant investment in hydrogeological research to ensure aquifer replenishment rates are not negatively impacted, a key component of source water protection. Navigating community opposition and stringent extended producer responsibility (epr) schemes adds layers of operational complexity.
  • In the broader food and beverage industry, competition is intense, not only from private-label brand competition but also from the consolidation of major players. This beverage industry consolidation creates entities with immense scale, making it difficult for smaller brands to compete.
  • For example, brands with strong consumer brand loyalty demonstrate 30% more pricing stability in the face of private-label pressure, highlighting the importance of brand equity as a defense against commoditization and competitive threats.

Exclusive Technavio Analysis on Customer Landscape

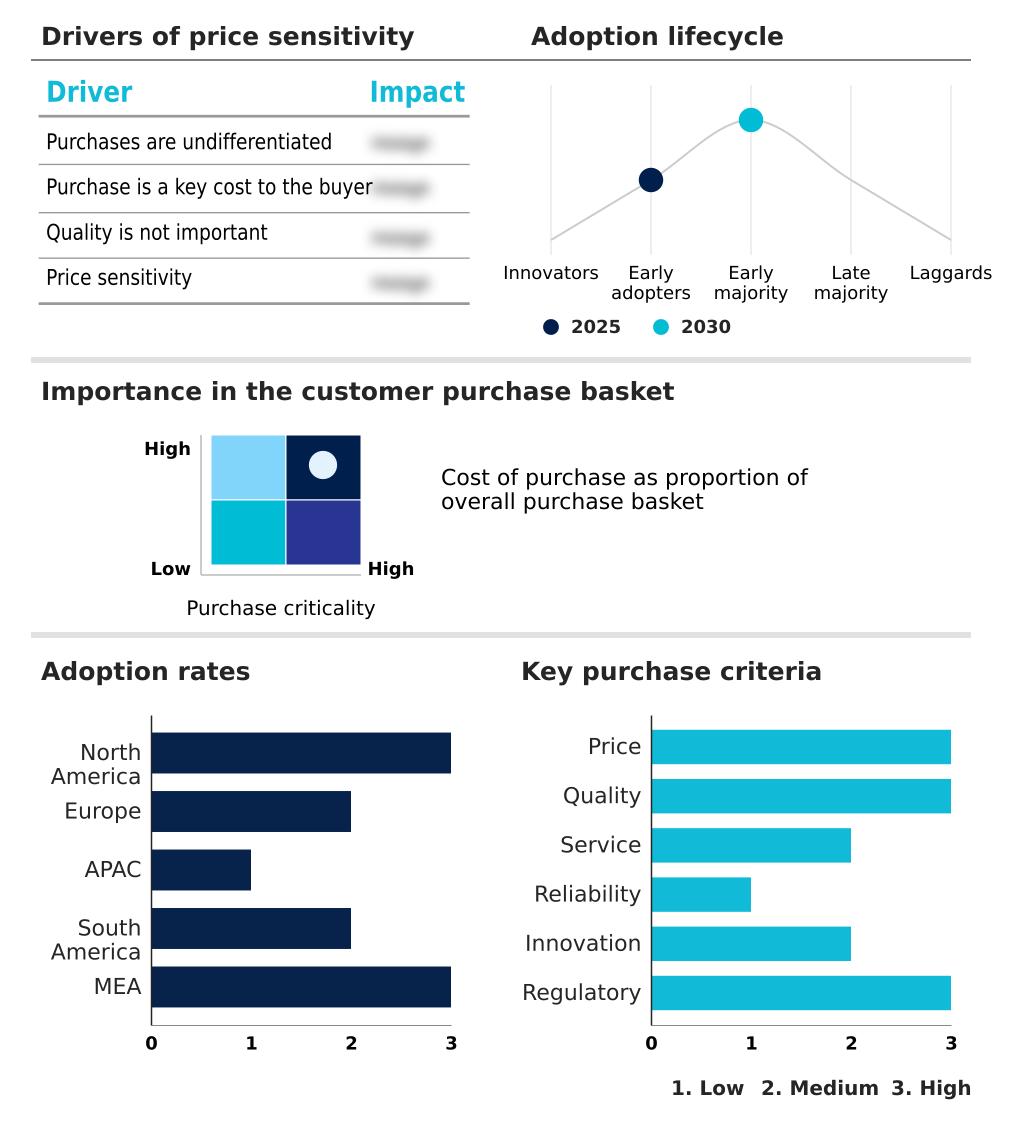
The spring water market forecasting report includes the adoption lifecycle of the market, covering from the innovator’s stage to the laggard’s stage. It focuses on adoption rates in different regions based on penetration. Furthermore, the spring water market report also includes key purchase criteria and drivers of price sensitivity to help companies evaluate and develop their market growth analysis strategies.

Customer Landscape of Spring Water Industry

Competitive Landscape

Companies are implementing various strategies, such as strategic alliances, spring water market forecast, partnerships, mergers and acquisitions, geographical expansion, and product/service launches, to enhance their presence in the industry.

ACQUA PANNA - Key offerings are defined by their natural mineral composition, providing a pure and authentic hydration choice derived directly from protected underground sources without alteration.

The industry research and growth report includes detailed analyses of the competitive landscape of the market and information about key companies, including:

  • ACQUA PANNA
  • BlueTriton
  • Crystal Geyser
  • Danone Espana
  • Danone S.A.
  • FIJI Water Company LLC
  • Gerolsteiner Brunnen GmbH
  • Highland Spring Ltd
  • Icelandic Glacial Inc.
  • Mountain Valley Spring Co. LLC
  • Nestle SA
  • Nongfu Spring Co. Ltd.
  • PepsiCo Inc.
  • The Coca Cola Co.
  • VOSS Global Inc.

Qualitative and quantitative analysis of companies has been conducted to help clients understand the wider business environment as well as the strengths and weaknesses of key industry players. Data is qualitatively analyzed to categorize companies as pure play, category-focused, industry-focused, and diversified; it is quantitatively analyzed to categorize companies as dominant, leading, strong, tentative, and weak.

Recent Development and News in Spring water market

  • In August, 2024, Flow Beverage Corp. announced a new line of sparkling mineral spring water packaged in aluminum bottles, made from 70% recycled material, to meet consumer demand for sustainable alternatives.
  • In November, 2024, Nestle announced its plan to spin off its water division into a standalone business, a move designed to enhance strategic focus on its premium water brands.
  • In January, 2025, VOSS Global Inc. launched a new 250ml bottle in the United Arab Emirates made from 100% recycled PET to meet regional demand for sustainable luxury products.
  • In February, 2025, Danone S.A. signaled its intent to leverage strong cash flow from its established water division to pursue strategic acquisitions in the health and nutrition sector.

Dive into Technavio’s robust research methodology, blending expert interviews, extensive data synthesis, and validated models for unparalleled Spring Water Market insights. See full methodology.

Market Scope
Page number 298
Base year 2025
Historic period 2020-2024
Forecast period 2026-2030
Growth momentum & CAGR Accelerate at a CAGR of 9.5%
Market growth 2026-2030 USD 26438.5 million
Market structure Fragmented
YoY growth 2025-2026(%) 9.1%
Key countries US, Canada, Mexico, Germany, UK, France, Italy, Spain, The Netherlands, China, Japan, India, South Korea, Australia, Indonesia, Brazil, Argentina, Colombia, Saudi Arabia, UAE, South Africa, Israel and Turkey
Competitive landscape Leading Companies, Market Positioning of Companies, Competitive Strategies, and Industry Risks

Request Free Sample

Research Analyst Overview

  • The spring water market is driven by an intricate interplay of consumer demand for purity and intense operational pressures related to sustainability. A core boardroom-level decision revolves around water stewardship programs and securing a social license to operate, which directly impacts long-term source water vulnerability.
  • The industry is moving beyond simple hydration, leveraging terroir-driven marketing to emphasize natural mineral composition and volcanic rock filtration. Innovations in packaging are paramount, with a clear pivot toward a closed-loop recycling system supported by recycled PET (rPET) supply and beverage packaging innovation. This includes bottle lightweighting technology and exploring alternatives like aseptic carton packaging made from plant-based renewable materials.
  • Boardroom discussions now center on compliance with regulations like the single-use plastics directive and managing extended producer responsibility (epr) schemes. Sourcing strategies are increasingly complex, focusing on artesian aquifer sourcing for premium alkaline spring water and ensuring a stable supply of food-grade recycled pet.
  • For example, companies adopting carbon neutral certification have documented a 20% improvement in brand perception among key demographics. The effectiveness of a direct-to-consumer (DTC) model and home and office delivery (hod) is also being re-evaluated to capture market share.

What are the Key Data Covered in this Spring Water Market Research and Growth Report?

  • What is the expected growth of the Spring Water Market between 2026 and 2030?

    • USD 26.44 billion, at a CAGR of 9.5%

  • What segmentation does the market report cover?

    • The report is segmented by Category (Plain water, and Flavored water), Distribution Channel (Hypermarkets, Specialty stores, and Online), Application (PET bottles, Glass bottles, Cans, and Others) and Geography (North America, Europe, APAC, South America, Middle East and Africa)

  • Which regions are analyzed in the report?

    • North America, Europe, APAC, South America and Middle East and Africa

  • What are the key growth drivers and market challenges?

    • Escalating health and wellness consciousness, Intense environmental scrutiny and anti-plastic movement

  • Who are the major players in the Spring Water Market?

    • ACQUA PANNA, BlueTriton, Crystal Geyser, Danone Espana, Danone S.A., FIJI Water Company LLC, Gerolsteiner Brunnen GmbH, Highland Spring Ltd, Icelandic Glacial Inc., Mountain Valley Spring Co. LLC, Nestle SA, Nongfu Spring Co. Ltd., PepsiCo Inc., The Coca Cola Co. and VOSS Global Inc.

Market Research Insights

  • Market dynamics are defined by a strategic response to evolving consumer values. A pronounced clean-label ingredient preference and focus on health and wellness consumption underpins the shift away from less healthy options. The online retail channel growth has expanded access to a wider variety of brands, intensifying competition.
  • For instance, brands that successfully create a differentiated brand narrative based on source purity have seen a 25% higher rate of consumer brand loyalty compared to those competing on price alone. Concurrently, beverage industry consolidation is reshaping the competitive landscape, with larger entities better positioned to manage supply chain optimization.
  • Effective environmental stewardship commitment is now a key performance indicator, with companies adopting sustainable packaging materials achieving up to a 10% reduction in packaging-related costs through material efficiency.

We can help! Our analysts can customize this spring water market research report to meet your requirements.

Get in touch

1. Executive Summary

1.1 Market overview

Executive Summary - Chart on Market Overview
Executive Summary - Data Table on Market Overview
Executive Summary - Chart on Global Market Characteristics
Executive Summary - Chart on Market by Geography
Executive Summary - Chart on Market Segmentation by Category
Executive Summary - Chart on Market Segmentation by Distribution Channel
Executive Summary - Chart on Market Segmentation by Application
Executive Summary - Chart on Incremental Growth
Executive Summary - Data Table on Incremental Growth
Executive Summary - Chart on Company Market Positioning

2. Technavio Analysis

2.1 Analysis of price sensitivity, lifecycle, customer purchase basket, adoption rates, and purchase criteria

2.2 Criticality of inputs and Factors of differentiation

Chart on Overview on criticality of inputs and factors of differentiation

2.3 Factors of disruption

Chart on Overview on factors of disruption

2.4 Impact of drivers and challenges

Chart on Impact of drivers and challenges in 2025 and 2030

3. Market Landscape

3.1 Market ecosystem

Chart on Parent Market
Data Table on - Parent Market

3.2 Market characteristics

Chart on Market characteristics analysis

3.3 Value chain analysis

Chart on Value chain analysis

4. Market Sizing

4.1 Market definition

Data Table on Offerings of companies included in the market definition

4.2 Market segment analysis

Market segments

4.3 Market size 2025

4.4 Market outlook: Forecast for 2025-2030

Chart on Global - Market size and forecast 2025-2030 ($ million)
Data Table on Global - Market size and forecast 2025-2030 ($ million)
Chart on Global Market: Year-over-year growth 2025-2030 (%)
Data Table on Global Market: Year-over-year growth 2025-2030 (%)

5. Historic Market Size

5.1 Global Spring Water Market 2020 - 2024

Historic Market Size - Data Table on Global Spring Water Market 2020 - 2024 ($ million)

5.2 Category segment analysis 2020 - 2024

Historic Market Size - Category Segment 2020 - 2024 ($ million)

5.3 Distribution Channel segment analysis 2020 - 2024

Historic Market Size - Distribution Channel Segment 2020 - 2024 ($ million)

5.4 Application segment analysis 2020 - 2024

Historic Market Size - Application Segment 2020 - 2024 ($ million)

5.5 Geography segment analysis 2020 - 2024

Historic Market Size - Geography Segment 2020 - 2024 ($ million)

5.6 Country segment analysis 2020 - 2024

Historic Market Size - Country Segment 2020 - 2024 ($ million)

6. Qualitative Analysis

6.1 The AI impact on global spring water market

7. Five Forces Analysis

7.1 Five forces summary

Five forces analysis - Comparison between 2025 and 2030

7.2 Bargaining power of buyers

Bargaining power of buyers - Impact of key factors 2025 and 2030

7.3 Bargaining power of suppliers

Bargaining power of suppliers - Impact of key factors in 2025 and 2030

7.4 Threat of new entrants

Threat of new entrants - Impact of key factors in 2025 and 2030

7.5 Threat of substitutes

Threat of substitutes - Impact of key factors in 2025 and 2030

7.6 Threat of rivalry

Threat of rivalry - Impact of key factors in 2025 and 2030

7.7 Market condition

Chart on Market condition - Five forces 2025 and 2030

8. Market Segmentation by Category

8.1 Market segments

Chart on Market Segmentation by Category - Market share 2025-2030 (%)
Data Table on Market Segmentation by Category - Market share 2025-2030 (%)

8.2 Comparison by Market Segmentation by Category

Chart on Comparison by Market Segmentation by Category
Data Table on Comparison by Market Segmentation by Category

8.3 Plain water - Market size and forecast 2025-2030

Chart on Plain water - Market size and forecast 2025-2030 ($ million)
Data Table on Plain water - Market size and forecast 2025-2030 ($ million)
Chart on Plain water - Year-over-year growth 2025-2030 (%)
Data Table on Plain water - Year-over-year growth 2025-2030 (%)

8.4 Flavored water - Market size and forecast 2025-2030

Chart on Flavored water - Market size and forecast 2025-2030 ($ million)
Data Table on Flavored water - Market size and forecast 2025-2030 ($ million)
Chart on Flavored water - Year-over-year growth 2025-2030 (%)
Data Table on Flavored water - Year-over-year growth 2025-2030 (%)

8.5 Market opportunity by Market Segmentation by Category

Market opportunity by Market Segmentation by Category ($ million)
Data Table on Market opportunity by Market Segmentation by Category ($ million)

9. Market Segmentation by Distribution Channel

9.1 Market segments

Chart on Distribution Channel - Market share 2025-2030 (%)
Data Table on Distribution Channel - Market share 2025-2030 (%)

9.2 Comparison by Distribution Channel

Chart on Comparison by Distribution Channel
Data Table on Comparison by Distribution Channel

9.3 Hypermarkets - Market size and forecast 2025-2030

Chart on Hypermarkets - Market size and forecast 2025-2030 ($ million)
Data Table on Hypermarkets - Market size and forecast 2025-2030 ($ million)
Chart on Hypermarkets - Year-over-year growth 2025-2030 (%)
Data Table on Hypermarkets - Year-over-year growth 2025-2030 (%)

9.4 Specialty stores - Market size and forecast 2025-2030

Chart on Specialty stores - Market size and forecast 2025-2030 ($ million)
Data Table on Specialty stores - Market size and forecast 2025-2030 ($ million)
Chart on Specialty stores - Year-over-year growth 2025-2030 (%)
Data Table on Specialty stores - Year-over-year growth 2025-2030 (%)

9.5 Online - Market size and forecast 2025-2030

Chart on Online - Market size and forecast 2025-2030 ($ million)
Data Table on Online - Market size and forecast 2025-2030 ($ million)
Chart on Online - Year-over-year growth 2025-2030 (%)
Data Table on Online - Year-over-year growth 2025-2030 (%)

9.6 Market opportunity by Distribution Channel

Market opportunity by Distribution Channel ($ million)
Data Table on Market opportunity by Distribution Channel ($ million)

10. Market Segmentation by Application

10.1 Market segments

Chart on Application - Market share 2025-2030 (%)
Data Table on Application - Market share 2025-2030 (%)

10.2 Comparison by Application

Chart on Comparison by Application
Data Table on Comparison by Application

10.3 PET bottles - Market size and forecast 2025-2030

Chart on PET bottles - Market size and forecast 2025-2030 ($ million)
Data Table on PET bottles - Market size and forecast 2025-2030 ($ million)
Chart on PET bottles - Year-over-year growth 2025-2030 (%)
Data Table on PET bottles - Year-over-year growth 2025-2030 (%)

10.4 Glass bottles - Market size and forecast 2025-2030

Chart on Glass bottles - Market size and forecast 2025-2030 ($ million)
Data Table on Glass bottles - Market size and forecast 2025-2030 ($ million)
Chart on Glass bottles - Year-over-year growth 2025-2030 (%)
Data Table on Glass bottles - Year-over-year growth 2025-2030 (%)

10.5 Cans - Market size and forecast 2025-2030

Chart on Cans - Market size and forecast 2025-2030 ($ million)
Data Table on Cans - Market size and forecast 2025-2030 ($ million)
Chart on Cans - Year-over-year growth 2025-2030 (%)
Data Table on Cans - Year-over-year growth 2025-2030 (%)

10.6 Others - Market size and forecast 2025-2030

Chart on Others - Market size and forecast 2025-2030 ($ million)
Data Table on Others - Market size and forecast 2025-2030 ($ million)
Chart on Others - Year-over-year growth 2025-2030 (%)
Data Table on Others - Year-over-year growth 2025-2030 (%)

10.7 Market opportunity by Application

Market opportunity by Application ($ million)
Data Table on Market opportunity by Application ($ million)

11. Customer Landscape

11.1 Customer landscape overview

Analysis of price sensitivity, lifecycle, customer purchase basket, adoption rates, and purchase criteria

12. Geographic Landscape

12.1 Geographic segmentation

Chart on Market share by geography 2025-2030 (%)
Data Table on Market share by geography 2025-2030 (%)

12.2 Geographic comparison

Chart on Geographic comparison
Data Table on Geographic comparison

12.3 North America - Market size and forecast 2025-2030

Chart on North America - Market size and forecast 2025-2030 ($ million)
Data Table on North America - Market size and forecast 2025-2030 ($ million)
Chart on North America - Year-over-year growth 2025-2030 (%)
Data Table on North America - Year-over-year growth 2025-2030 (%)
Chart on Regional Comparison - North America
Data Table on Regional Comparison - North America

12.3.1 US - Market size and forecast 2025-2030

Chart on US - Market size and forecast 2025-2030 ($ million)
Data Table on US - Market size and forecast 2025-2030 ($ million)
Chart on US - Year-over-year growth 2025-2030 (%)
Data Table on US - Year-over-year growth 2025-2030 (%)

12.3.2 Canada - Market size and forecast 2025-2030

Chart on Canada - Market size and forecast 2025-2030 ($ million)
Data Table on Canada - Market size and forecast 2025-2030 ($ million)
Chart on Canada - Year-over-year growth 2025-2030 (%)
Data Table on Canada - Year-over-year growth 2025-2030 (%)

12.3.3 Mexico - Market size and forecast 2025-2030

Chart on Mexico - Market size and forecast 2025-2030 ($ million)
Data Table on Mexico - Market size and forecast 2025-2030 ($ million)
Chart on Mexico - Year-over-year growth 2025-2030 (%)
Data Table on Mexico - Year-over-year growth 2025-2030 (%)

12.4 Europe - Market size and forecast 2025-2030

Chart on Europe - Market size and forecast 2025-2030 ($ million)
Data Table on Europe - Market size and forecast 2025-2030 ($ million)
Chart on Europe - Year-over-year growth 2025-2030 (%)
Data Table on Europe - Year-over-year growth 2025-2030 (%)
Chart on Regional Comparison - Europe
Data Table on Regional Comparison - Europe

12.4.1 Germany - Market size and forecast 2025-2030

Chart on Germany - Market size and forecast 2025-2030 ($ million)
Data Table on Germany - Market size and forecast 2025-2030 ($ million)
Chart on Germany - Year-over-year growth 2025-2030 (%)
Data Table on Germany - Year-over-year growth 2025-2030 (%)

12.4.2 UK - Market size and forecast 2025-2030

Chart on UK - Market size and forecast 2025-2030 ($ million)
Data Table on UK - Market size and forecast 2025-2030 ($ million)
Chart on UK - Year-over-year growth 2025-2030 (%)
Data Table on UK - Year-over-year growth 2025-2030 (%)

12.4.3 France - Market size and forecast 2025-2030

Chart on France - Market size and forecast 2025-2030 ($ million)
Data Table on France - Market size and forecast 2025-2030 ($ million)
Chart on France - Year-over-year growth 2025-2030 (%)
Data Table on France - Year-over-year growth 2025-2030 (%)

12.4.4 Italy - Market size and forecast 2025-2030

Chart on Italy - Market size and forecast 2025-2030 ($ million)
Data Table on Italy - Market size and forecast 2025-2030 ($ million)
Chart on Italy - Year-over-year growth 2025-2030 (%)
Data Table on Italy - Year-over-year growth 2025-2030 (%)

12.4.5 Spain - Market size and forecast 2025-2030

Chart on Spain - Market size and forecast 2025-2030 ($ million)
Data Table on Spain - Market size and forecast 2025-2030 ($ million)
Chart on Spain - Year-over-year growth 2025-2030 (%)
Data Table on Spain - Year-over-year growth 2025-2030 (%)

12.4.6 The Netherlands - Market size and forecast 2025-2030

Chart on The Netherlands - Market size and forecast 2025-2030 ($ million)
Data Table on The Netherlands - Market size and forecast 2025-2030 ($ million)
Chart on The Netherlands - Year-over-year growth 2025-2030 (%)
Data Table on The Netherlands - Year-over-year growth 2025-2030 (%)

12.5 APAC - Market size and forecast 2025-2030

Chart on APAC - Market size and forecast 2025-2030 ($ million)
Data Table on APAC - Market size and forecast 2025-2030 ($ million)
Chart on APAC - Year-over-year growth 2025-2030 (%)
Data Table on APAC - Year-over-year growth 2025-2030 (%)
Chart on Regional Comparison - APAC
Data Table on Regional Comparison - APAC

12.5.1 China - Market size and forecast 2025-2030

Chart on China - Market size and forecast 2025-2030 ($ million)
Data Table on China - Market size and forecast 2025-2030 ($ million)
Chart on China - Year-over-year growth 2025-2030 (%)
Data Table on China - Year-over-year growth 2025-2030 (%)

12.5.2 Japan - Market size and forecast 2025-2030

Chart on Japan - Market size and forecast 2025-2030 ($ million)
Data Table on Japan - Market size and forecast 2025-2030 ($ million)
Chart on Japan - Year-over-year growth 2025-2030 (%)
Data Table on Japan - Year-over-year growth 2025-2030 (%)

12.5.3 India - Market size and forecast 2025-2030

Chart on India - Market size and forecast 2025-2030 ($ million)
Data Table on India - Market size and forecast 2025-2030 ($ million)
Chart on India - Year-over-year growth 2025-2030 (%)
Data Table on India - Year-over-year growth 2025-2030 (%)

12.5.4 South Korea - Market size and forecast 2025-2030

Chart on South Korea - Market size and forecast 2025-2030 ($ million)
Data Table on South Korea - Market size and forecast 2025-2030 ($ million)
Chart on South Korea - Year-over-year growth 2025-2030 (%)
Data Table on South Korea - Year-over-year growth 2025-2030 (%)

12.5.5 Australia - Market size and forecast 2025-2030

Chart on Australia - Market size and forecast 2025-2030 ($ million)
Data Table on Australia - Market size and forecast 2025-2030 ($ million)
Chart on Australia - Year-over-year growth 2025-2030 (%)
Data Table on Australia - Year-over-year growth 2025-2030 (%)

12.5.6 Indonesia - Market size and forecast 2025-2030

Chart on Indonesia - Market size and forecast 2025-2030 ($ million)
Data Table on Indonesia - Market size and forecast 2025-2030 ($ million)
Chart on Indonesia - Year-over-year growth 2025-2030 (%)
Data Table on Indonesia - Year-over-year growth 2025-2030 (%)

12.6 South America - Market size and forecast 2025-2030

Chart on South America - Market size and forecast 2025-2030 ($ million)
Data Table on South America - Market size and forecast 2025-2030 ($ million)
Chart on South America - Year-over-year growth 2025-2030 (%)
Data Table on South America - Year-over-year growth 2025-2030 (%)
Chart on Regional Comparison - South America
Data Table on Regional Comparison - South America

12.6.1 Brazil - Market size and forecast 2025-2030

Chart on Brazil - Market size and forecast 2025-2030 ($ million)
Data Table on Brazil - Market size and forecast 2025-2030 ($ million)
Chart on Brazil - Year-over-year growth 2025-2030 (%)
Data Table on Brazil - Year-over-year growth 2025-2030 (%)

12.6.2 Argentina - Market size and forecast 2025-2030

Chart on Argentina - Market size and forecast 2025-2030 ($ million)
Data Table on Argentina - Market size and forecast 2025-2030 ($ million)
Chart on Argentina - Year-over-year growth 2025-2030 (%)
Data Table on Argentina - Year-over-year growth 2025-2030 (%)

12.6.3 Colombia - Market size and forecast 2025-2030

Chart on Colombia - Market size and forecast 2025-2030 ($ million)
Data Table on Colombia - Market size and forecast 2025-2030 ($ million)
Chart on Colombia - Year-over-year growth 2025-2030 (%)
Data Table on Colombia - Year-over-year growth 2025-2030 (%)

12.7 Middle East and Africa - Market size and forecast 2025-2030

Chart on Middle East and Africa - Market size and forecast 2025-2030 ($ million)
Data Table on Middle East and Africa - Market size and forecast 2025-2030 ($ million)
Chart on Middle East and Africa - Year-over-year growth 2025-2030 (%)
Data Table on Middle East and Africa - Year-over-year growth 2025-2030 (%)
Chart on Regional Comparison - Middle East and Africa
Data Table on Regional Comparison - Middle East and Africa

12.7.1 Saudi Arabia - Market size and forecast 2025-2030

Chart on Saudi Arabia - Market size and forecast 2025-2030 ($ million)
Data Table on Saudi Arabia - Market size and forecast 2025-2030 ($ million)
Chart on Saudi Arabia - Year-over-year growth 2025-2030 (%)
Data Table on Saudi Arabia - Year-over-year growth 2025-2030 (%)

12.7.2 UAE - Market size and forecast 2025-2030

Chart on UAE - Market size and forecast 2025-2030 ($ million)
Data Table on UAE - Market size and forecast 2025-2030 ($ million)
Chart on UAE - Year-over-year growth 2025-2030 (%)
Data Table on UAE - Year-over-year growth 2025-2030 (%)

12.7.3 South Africa - Market size and forecast 2025-2030

Chart on South Africa - Market size and forecast 2025-2030 ($ million)
Data Table on South Africa - Market size and forecast 2025-2030 ($ million)
Chart on South Africa - Year-over-year growth 2025-2030 (%)
Data Table on South Africa - Year-over-year growth 2025-2030 (%)

12.7.4 Israel - Market size and forecast 2025-2030

Chart on Israel - Market size and forecast 2025-2030 ($ million)
Data Table on Israel - Market size and forecast 2025-2030 ($ million)
Chart on Israel - Year-over-year growth 2025-2030 (%)
Data Table on Israel - Year-over-year growth 2025-2030 (%)

12.7.5 Turkey - Market size and forecast 2025-2030

Chart on Turkey - Market size and forecast 2025-2030 ($ million)
Data Table on Turkey - Market size and forecast 2025-2030 ($ million)
Chart on Turkey - Year-over-year growth 2025-2030 (%)
Data Table on Turkey - Year-over-year growth 2025-2030 (%)

12.8 Market opportunity by geography

Market opportunity by geography ($ million)
Data Tables on Market opportunity by geography ($ million)

13. Drivers, Challenges, and Opportunity

13.1 Market drivers

Escalating health and wellness consciousness
Dual trends of premiumization and functionalization
Imperative of sustainability and eco-conscious packaging

13.2 Market challenges

Intense environmental scrutiny and anti-plastic movement
Source vulnerability, water stewardship, and social license to operate
Intense competition and threat of cost-effective alternatives

13.3 Impact of drivers and challenges

Impact of drivers and challenges in 2025 and 2030

13.4 Market opportunities

Ubiquity of sustainable packaging and circular economy
Blurring lines between hydration and functional wellness
Hyper-localization and power of terroir-driven marketing

14. Competitive Landscape

14.1 Overview

14.2

Overview on criticality of inputs and factors of differentiation

14.3 Landscape disruption

Overview on factors of disruption

14.4 Industry risks

Impact of key risks on business

15. Competitive Analysis

15.1 Companies profiled

Companies covered

15.2 Company ranking index

15.3 Market positioning of companies

Matrix on companies position and classification

15.4 ACQUA PANNA

ACQUA PANNA - Overview
ACQUA PANNA - Product / Service
ACQUA PANNA - Key offerings
SWOT

15.5 BlueTriton

BlueTriton - Overview
BlueTriton - Product / Service
BlueTriton - Key offerings
SWOT

15.6 Crystal Geyser

Crystal Geyser - Overview
Crystal Geyser - Product / Service
Crystal Geyser - Key offerings
SWOT

15.7 Danone Espana

Danone Espana - Overview
Danone Espana - Product / Service
Danone Espana - Key offerings
SWOT

15.8 Danone S.A.

Danone S.A. - Overview
Danone S.A. - Business segments
Danone S.A. - Key news
Danone S.A. - Key offerings
Danone S.A. - Segment focus
SWOT

15.9 FIJI Water Company LLC

FIJI Water Company LLC - Overview
FIJI Water Company LLC - Product / Service
FIJI Water Company LLC - Key offerings
SWOT

15.10 Gerolsteiner Brunnen GmbH

Gerolsteiner Brunnen GmbH - Overview
Gerolsteiner Brunnen GmbH - Product / Service
Gerolsteiner Brunnen GmbH - Key offerings
SWOT

15.11 Highland Spring Ltd

Highland Spring Ltd - Overview
Highland Spring Ltd - Product / Service
Highland Spring Ltd - Key offerings
SWOT

15.12 Icelandic Glacial Inc.

Icelandic Glacial Inc. - Overview
Icelandic Glacial Inc. - Product / Service
Icelandic Glacial Inc. - Key offerings
SWOT

15.13 Mountain Valley Spring Co. LLC

Mountain Valley Spring Co. LLC - Overview
Mountain Valley Spring Co. LLC - Product / Service
Mountain Valley Spring Co. LLC - Key offerings
SWOT

15.14 Nestle SA

Nestle SA - Overview
Nestle SA - Business segments
Nestle SA - Key news
Nestle SA - Key offerings
Nestle SA - Segment focus
SWOT

15.15 Nongfu Spring Co. Ltd.

Nongfu Spring Co. Ltd. - Overview
Nongfu Spring Co. Ltd. - Business segments
Nongfu Spring Co. Ltd. - Key offerings
Nongfu Spring Co. Ltd. - Segment focus
SWOT

15.16 PepsiCo Inc.

PepsiCo Inc. - Overview
PepsiCo Inc. - Business segments
PepsiCo Inc. - Key news
PepsiCo Inc. - Key offerings
PepsiCo Inc. - Segment focus
SWOT

15.17 The Coca Cola Co.

The Coca Cola Co. - Overview
The Coca Cola Co. - Business segments
The Coca Cola Co. - Key news
The Coca Cola Co. - Key offerings
The Coca Cola Co. - Segment focus
SWOT

15.18 VOSS Global Inc.

VOSS Global Inc. - Overview
VOSS Global Inc. - Product / Service
VOSS Global Inc. - Key offerings
SWOT

16. Appendix

16.1 Scope of the report

Market definition
Objectives
Notes and caveats

16.2 Inclusions and exclusions checklist

Inclusions checklist
Exclusions checklist

16.3 Currency conversion rates for US$

16.4 Research methodology

16.5 Data procurement

Information sources

16.6 Data validation

16.7 Validation techniques employed for market sizing

16.8 Data synthesis

16.9 360 degree market analysis

16.10 List of abbreviations

Research Methodology

Technavio presents a detailed picture of the market by way of study, synthesis, and summation of data from multiple sources. The analysts have presented the various facets of the market with a particular focus on identifying the key industry influencers. The data thus presented is comprehensive, reliable, and the result of extensive research, both primary and secondary.

INFORMATION SOURCES

Primary sources

  • Manufacturers and suppliers
  • Channel partners
  • Industry experts
  • Strategic decision makers

Secondary sources

  • Industry journals and periodicals
  • Government data
  • Financial reports of key industry players
  • Historical data
  • Press releases

DATA ANALYSIS

Data Synthesis

  • Collation of data
  • Estimation of key figures
  • Analysis of derived insights

Data Validation

  • Triangulation with data models
  • Reference against proprietary databases
  • Corroboration with industry experts

REPORT WRITING

Qualitative

  • Market drivers
  • Market challenges
  • Market trends
  • Five forces analysis

Quantitative

  • Market size and forecast
  • Market segmentation
  • Geographical insights
  • Competitive landscape

Interested in this report?

Get your sample now to see our research methodology and insights!

Download Now

Frequently Asked Questions

Spring Water market growth will increase by USD 26438.5 million during 2026-2030 .

The Spring Water market is expected to grow at a CAGR of 9.5% during 2026-2030 .

Spring Water market is segmented by Category (Plain water, Flavored water) Distribution channel (Hypermarkets, Specialty stores, Online) Application (PET bottles, Glass bottles, Cans, Others)

ACQUA PANNA, BlueTriton, Crystal Geyser, Danone Espana, Danone S.A., FIJI Water Company LLC, Gerolsteiner Brunnen GmbH, Highland Spring Ltd, Icelandic Glacial Inc., Mountain Valley Spring Co. LLC, Nestle SA, Nongfu Spring Co. Ltd., PepsiCo Inc., The Coca Cola Co., VOSS Global Inc. are a few of the key vendors in the Spring Water market.

North America will register the highest growth rate of 37.5% among the other regions. Therefore, the Spring Water market in North America is expected to garner significant business opportunities for the vendors during the forecast period.

US, Canada, Mexico, Germany, UK, France, Italy, Spain, The Netherlands, China, Japan, India, South Korea, Australia, Indonesia, Brazil, Argentina, Colombia, Saudi Arabia, UAE, South Africa, Israel, Turkey

  • Escalating health and wellness consciousness is the driving factor this market.

The Spring Water market vendors should focus on grabbing business opportunities from the Category segment as it accounted for the largest market share in the base year.