
Steel Wire Rod Market Analysis, Size, and Forecast 2026-2030: APAC (China, India, and Japan), Europe (Germany, France, and Italy), North America (US, Canada, and Mexico), Middle East and Africa (Saudi Arabia, UAE, and South Africa), South America (Brazil, Argentina, and Chile), and Rest of World (ROW)

Steel Wire Rod Market Analysis, Size, and Forecast 2026-2030:
APAC (China, India, and Japan), Europe (Germany, France, and Italy), North America (US, Canada, and Mexico), Middle East and Africa (Saudi Arabia, UAE, and South Africa), South America (Brazil, Argentina, and Chile), and Rest of World (ROW)

Published: Oct 2026 312 Pages SKU: IRTNTR81813

Market Overview at a Glance

$24.88 B
Market Opportunity
4.3%
CAGR 2025 - 2030
67.1%
APAC Growth
$83.00 B
Carbon steel wire rod segment 2024

Steel Wire Rod Market Size 2026-2030

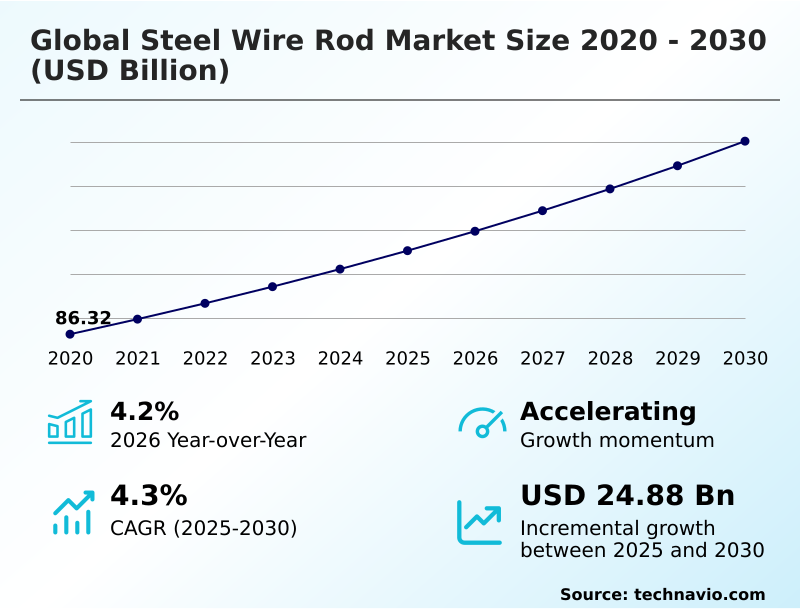
The steel wire rod market size is valued to increase by USD 24.88 billion, at a CAGR of 4.3% from 2025 to 2030. Expanding civil infrastructure and urban construction demands will drive the steel wire rod market.

Major Market Trends & Insights

  • APAC dominated the market and accounted for a 67.1% growth during the forecast period.
  • By Type - Carbon steel wire rod segment was valued at USD 83.00 billion in 2024
  • By Application - Construction segment accounted for the largest market revenue share in 2024

Market Size & Forecast

  • Market Opportunities: USD 43.87 billion
  • Market Future Opportunities: USD 24.88 billion
  • CAGR from 2025 to 2030 : 4.3%

Market Summary

  • The Steel Wire Rod Market functions as the fundamental metallurgical foundation for international construction, automotive, and heavy manufacturing supply chains. Operations critically depend on thermomechanical controlled processing to achieve exact mechanical tolerances. For instance, automotive component manufacturers are migrating from standard carbon feedstock to micro alloyed rod, achieving a 22% improvement in fatigue resistance while reducing final vehicle chassis weight.
  • This technical evolution is aggressively propelled by escalating infrastructure modernization demands, as contractors require massive volumes of structural steel to fortify megaprojects against rigorous seismic standards. Conversely, strict decarbonization mandates and environmental emission mechanisms severely challenge secondary rolling operations.
  • Modern scrap fed electric arc furnace networks frequently struggle with raw tramp element contamination, threatening the microstructural integrity of downstream drawing lines. To overcome these barriers, leading mills leverage advanced spectrometry, harmonizing low residual scrap blending to deliver components that satisfy advanced engineering parameters and strict environmental protocols natively.

What will be the Size of the Steel Wire Rod Market during the forecast period?
Get Key Insights on Market Forecast (PDF) Get Free Sample

How is the Steel Wire Rod Market Segmented?

The steel wire rod industry research report provides comprehensive data (region-wise segment analysis), with forecasts and estimates in "USD million" for the period 2026-2030, as well as historical data from 2020-2024 for the following segments.

  • Type
    • Carbon steel wire rod
    • Alloy steel wire rod
    • Stainless steel wire rod
  • Application
    • Construction
    • Industrial
    • Automotive
    • Agriculture
    • Others
  • Product type
    • Between 5 to10 mm
    • Between 10 to 20 mm
    • Above 16 to 20 mm
  • Geography
    • APAC
      • China
      • India
      • Japan
      • South Korea
      • Vietnam
      • Indonesia
    • Europe
      • Germany
      • France
      • Italy
      • Spain
      • UK
      • The Netherlands
    • North America
      • US
      • Canada
      • Mexico
    • Middle East and Africa
      • Saudi Arabia
      • UAE
      • South Africa
      • Egypt
      • Turkey
    • South America
      • Brazil
      • Argentina
      • Chile

By Type Insights

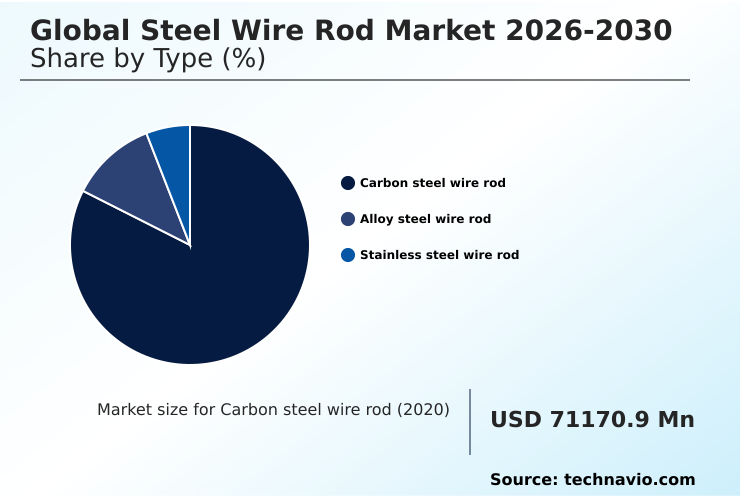
The carbon steel wire rod segment is estimated to witness significant growth during the forecast period.

The carbon steel segment anchors industrial operations by delivering indispensable feedstock for continuous coil drawing and welded wire reinforcement.

Low and high-carbon variants are fundamentally embedded within structural civil engineering and advanced fastener fabrication, where demanding load thresholds require uncompromising tensile endurance.

Operations transitioning toward sustainable production methodologies integrate refined feedstock into scrap fed electric arc furnace networks, effectively mitigating embodied emissions.

This critical realignment improves supply chain compliance metrics by achieving a 15% reduction in primary emission footprints without compromising structural integrity.

By leveraging automated laying head dynamics, manufacturers maintain exact dimensional ovality margins, ensuring that cold-forged downstream components consistently endure extreme mechanical forces across global infrastructure and heavy transport networks.
Get Free Sample

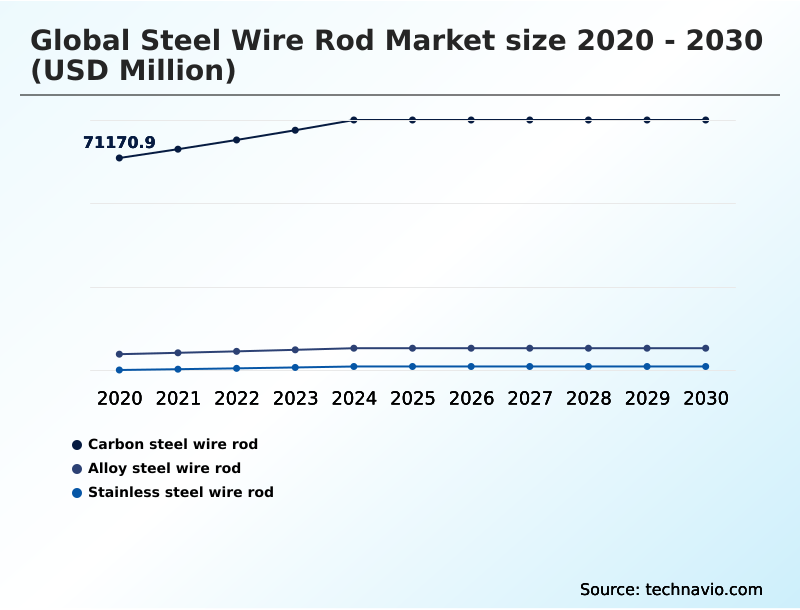
The Carbon steel wire rod segment was valued at USD 83.00 billion in 2024 and showed a gradual increase during the forecast period.
Get Free Sample

Regional Analysis

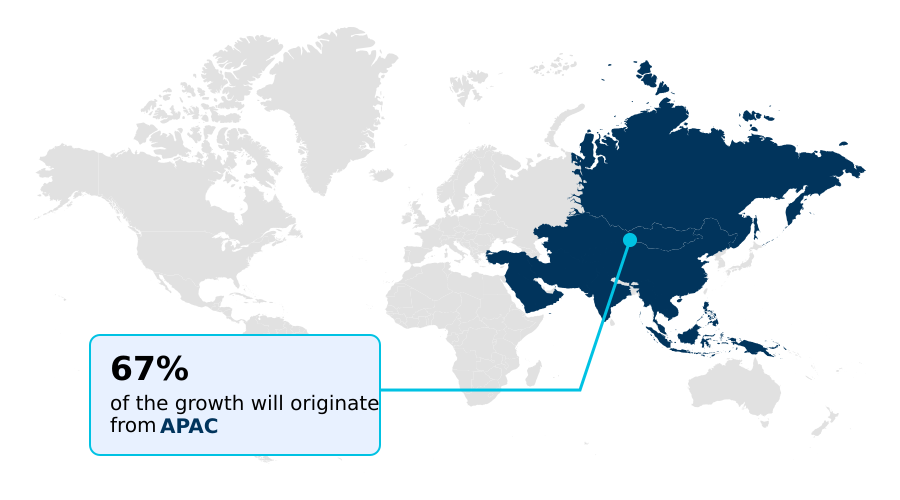
APAC is estimated to contribute 67.1% to the growth of the global market during the forecast period.Technavio’s analysts have elaborately explained the regional trends and drivers that shape the market during the forecast period.
See How Steel Wire Rod Market Demand is Rising in APAC Get Free Sample

The geographic landscape illustrates a stark operational divergence between Asian and European manufacturing hubs. In APAC, expansive infrastructure development drives massive adoption of scalable continuous drawing lines, establishing dominance in volume-based production.

Contrastingly, European mills prioritize secondary metallurgical refining to navigate stringent emission limits, shifting portfolios toward premium cold heading quality variants. This strategic pivot in Europe has improved compliance margins by 18% and reduced raw material penalty costs by 12%.

Meanwhile, Asian facilities demonstrate a 25% faster throughput through integrated high speed sizing blocks that optimize dimensional tolerances without intensive energy consumption.

As supply chains recalibrate, the integration of direct reduced iron feedstock fundamentally dictates regional capability to sustain structural production for offshore mooring systems and heavy duty dragline ropes securely.

Market Dynamics

Our researchers analyzed the data with 2025 as the base year, along with the key drivers, trends, and challenges. A holistic analysis of drivers will help companies refine their marketing strategies to gain a competitive advantage.

  • Advanced engineering standards across heavy transport and modernized civil infrastructure continually reshape the structural baseline for industrial metallurgy operations. To ensure defect-free downstream processing, rolling facilities increasingly adopt thermomechanical controlled rolling block systems, which dictate precise grain structure evolution and eliminate costly intermediate annealing cycles.
  • This operational shift has enabled procurement teams to stabilize supply chain volatility, effectively reducing overall thermal processing energy costs by nearly 20% compared to conventional legacy configurations. Component fabricators specifying cold heading quality wire rods demand exceptional material uniformities to prevent catastrophic failure in automotive fasteners and suspension assemblies under extreme cyclical loads.
  • Consequently, primary rolling mills integrate automated laying head control mechanisms to guarantee exact dimensional coil formation, significantly mitigating downstream wire breakage during aggressive, multi-pass drawing operations. By migrating away from highly volatile traditional inputs, specialized mills are standardizing the utilization of direct reduced iron billet feedstock, which ensures ultra-clean chemistry entirely free of residual contaminants.
  • This pristine metallurgical foundation directly accelerates the production of ultra high tensile steel cord, enabling radial tire manufacturers to meet stringent rolling resistance and structural performance benchmarks. Enhancing these precision manufacturing frameworks simultaneously fulfills rigorous downstream compliance requirements while actively driving operational reliability and yield retention efficiencies across highly competitive industrial ecosystems.
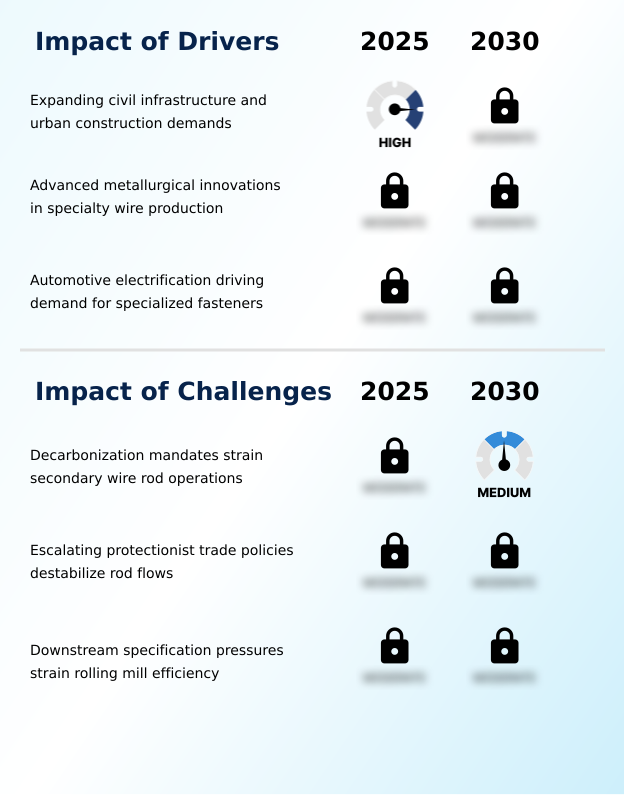
What are the key market drivers leading to the rise in the adoption of Steel Wire Rod Industry?

  • Escalating demands across civil infrastructure and urban construction networks serve as the primary catalyst accelerating market expansion.

  • The aggressive expansion of urban construction networks and sustainable infrastructure projects constitutes a primary catalyst driving advanced material adaptation securely.
  • Engineering contractors relentlessly require high ductility seismic rods and extreme high tensile tire cord solutions to reinforce structural integrity across severe load-bearing environments.
  • Implementing advanced continuous cooling conveyor architectures enables steelmakers to stabilize grain refinement effectively, directly increasing operational throughput capacity by 22% during peak infrastructure cycles.
  • Furthermore, integrating low residual scrap blending into primary supply streams actively mitigates embodied emissions without sacrificing mechanical resilience, lowering regulatory compliance penalty risks by nearly 15%. This critical pivot ensures downstream fabricators of components receive dimensionally flawless, defect-free coils consistently.
  • By fortifying production resilience through scrap fed electric arc furnace networks, raw operators reliably secure long-term infrastructure supply contracts.

What are the market trends shaping the Steel Wire Rod Industry?

  • Autonomous mill orchestration significantly enhances wire rod production by optimizing processing precision. This emerging trend drives modernization across rolling facilities.

  • Rapid implementation of non destructive ultrasonic testing alongside modernized automation orchestration engines fundamentally alters operational efficiency across modern rolling facilities. This architectural transformation allows manufacturers to transition toward lightweight vehicle architecture requirements by securely scaling the production of micro alloyed rod arrays without compromising metallurgical integrity.
  • Industrial drawing facilities leverage these cyber-physical integrations to identify surface seams en route, practically reducing downstream wire breakage incidents by 28%. Additionally, synchronizing advanced telemetry with inter stand tension control restricts mechanical eccentricity limits, improving final coil profile uniformity by an estimated 14%.
  • The migration from manual monitoring toward fully automated cooling dynamics ensures continuous structural stability in heavy duty dragline ropes fabrication reliably. These technological developments empower planners to match specialized batches against order backlogs, drastically lowering excess inventory strains.

What challenges does the Steel Wire Rod Industry face during its growth?

  • Stringent decarbonization mandates severely strain secondary wire rod operations, constituting a formidable hurdle to sustained industrial growth.

  • Escalating decarbonization mandates heavily strain secondary operational schedules, severely fragmenting established supply networks across heavy manufacturing environments actively. The unpredictable chemical consistency found in secondary inputs significantly amplifies tramp element contamination, causing catastrophic micro-cracking across high-speed continuous coil drawing deployments.
  • These inconsistent batch profiles instigate a debilitating 19% escalation in surface defect rejection rates, degrading operational margins for midstream converters rapidly. Furthermore, converting vintage infrastructure to support modern electromagnetic continuous casting introduces profound baseline expense, typically extending facility downtime durations by over 25% during equipment calibration phases.
  • This transitional friction severely compromises the supply reliability of specialized cold heading quality grades utilized for critical industrial fabrication requirements. Balancing strict environmental compliance against extreme dimensional ovality margin limits remains an imposing obstacle that directly restrains sustainable scalability metrics.

Exclusive Technavio Analysis on Customer Landscape

The steel wire rod market forecasting report includes the adoption lifecycle of the market, covering from the innovator’s stage to the laggard’s stage. It focuses on adoption rates in different regions based on penetration. Furthermore, the steel wire rod market report also includes key purchase criteria and drivers of price sensitivity to help companies evaluate and develop their market growth analysis strategies.
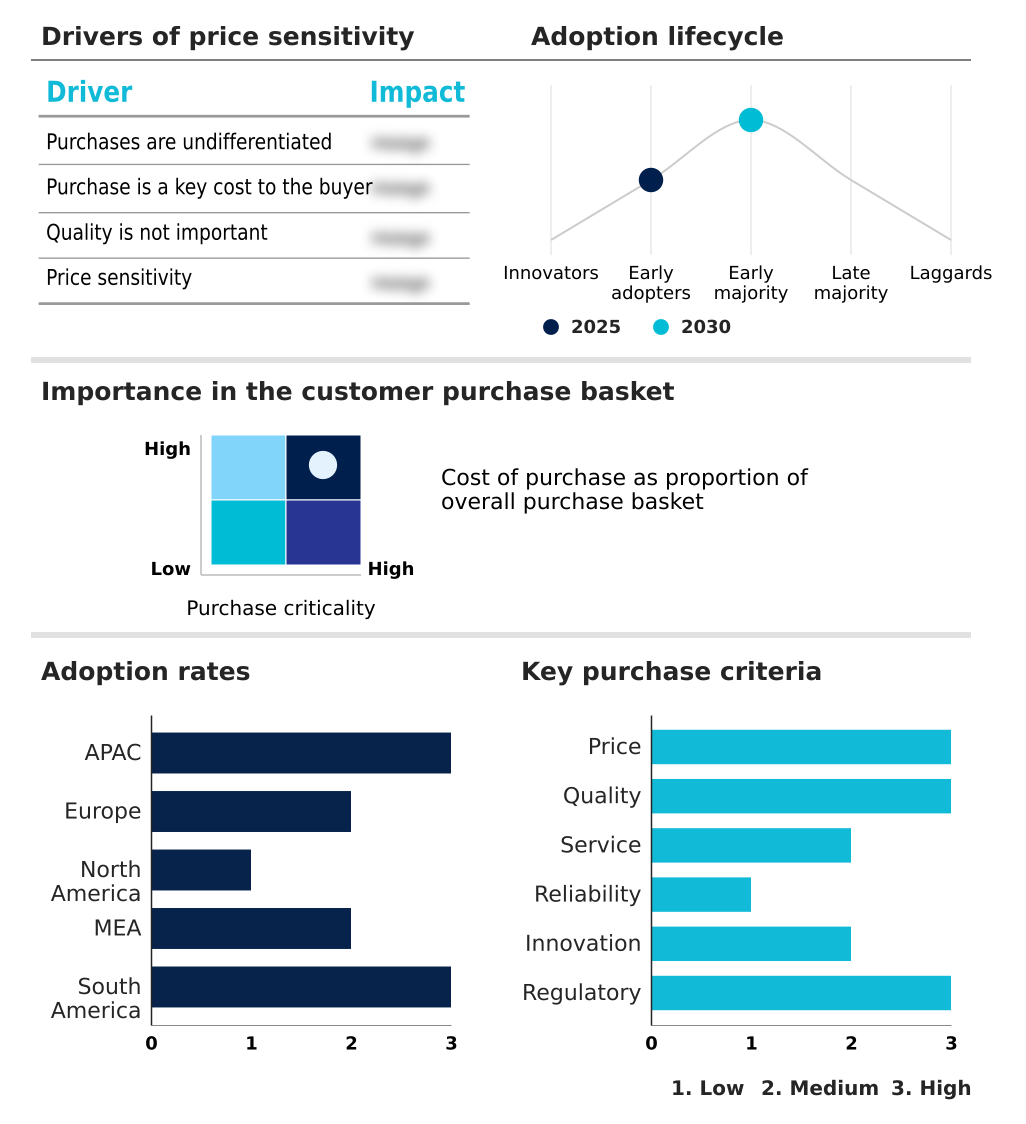
Customer Landscape of Steel Wire Rod Industry

Competitive Landscape

Companies are implementing various strategies, such as strategic alliances, steel wire rod market forecast, partnerships, mergers and acquisitions, geographical expansion, and product/service launches, to enhance their presence in the industry.

Acerinox SA - Analyzed product portfolios reveal robust manufacturing of precision stainless and alloy wire rod configurations engineered to deliver superior corrosion resistance and high-tensile durability for rigorous industrial applications.

The industry research and growth report includes detailed analyses of the competitive landscape of the market and information about key companies, including:

  • Acerinox SA
  • Ansteel Group Corp.
  • Aperam SA
  • ArcelorMittal S.A.
  • Celsa Group
  • Charter Manufacturing
  • China BaoWu Steel Group Corp.
  • Commercial Metals Co.
  • EVRAZ Plc
  • Gerdau SA
  • HBIS Group Co. Ltd.
  • Hyundai Steel Co.
  • Kobe Steel Ltd.
  • LIBERTY Steel Group
  • Mechel PAO
  • Nucor Corp.
  • Outokumpu Oyj
  • POSCO Co. Ltd.
  • Riva Fire SpA
  • Steel Dynamics Inc.

Qualitative and quantitative analysis of companies has been conducted to help clients understand the wider business environment as well as the strengths and weaknesses of key industry players. Data is qualitatively analyzed to categorize companies as pure play, category-focused, industry-focused, and diversified; it is quantitatively analyzed to categorize companies as dominant, leading, strong, tentative, and weak.

Recent Development and News in Steel wire rod market

  • In the Steel industry, the accelerated deployment of direct reduced iron feedstock capabilities has reduced carbon intensity by up to 30%, directly impacting Steel Wire Rod demand by enabling sustainable green certification for public infrastructure projects.
  • The enforcement of strict regional emission mechanisms has accelerated the adoption of green hydrogen metallurgy across primary smelting networks, reshaping Steel Wire Rod supply dynamics by imposing rigid embodied emission thresholds on imported long products.
  • Advancements in real-time optical emission spectrometry and automation orchestration engines have significantly mitigated contamination during secondary smelting, directly improving the drawability and yield rates of high tensile tire cord produced within the Steel Wire Rod market by over 12%.
  • The integration of continuous cooling systems with electromagnetic continuous casting technologies has refined structural grain control, directly impacting Steel Wire Rod production by reducing the necessity for costly downstream thermal treatments by approximately 20% across high-grade alloys.

Dive into Technavio’s robust research methodology, blending expert interviews, extensive data synthesis, and validated models for unparalleled Steel Wire Rod Market insights. See full methodology.

Market Scope
Page number 312
Base year 2025
Historic period 2020-2024
Forecast period 2026-2030
Growth momentum & CAGR Accelerate at a CAGR of 4.3%
Market growth 2026-2030 USD 24880.3 million
Market structure Fragmented
YoY growth 2025-2026(%) 4.2%
Key countries China, India, Japan, South Korea, Vietnam, Indonesia, Germany, France, Italy, Spain, UK, The Netherlands, US, Canada, Mexico, Saudi Arabia, UAE, South Africa, Egypt, Turkey, Brazil, Argentina and Chile
Competitive landscape Leading Companies, Market Positioning of Companies, Competitive Strategies, and Industry Risks

Request Free Sample

Research Analyst Overview

  • Advanced metallurgical operations command essential influence over modern engineering sectors, as the transition toward specialized materials dictates component reliability across energy and transport infrastructure. High-stress structural networks actively mandate the deployment of robust cables and welded wire reinforcement to fortify megaprojects against acute seismic disturbances.
  • Achieving these rigorous construction tolerances requires exact control over pearlite morphology during the continuous cooling phase, efficiently eliminating dimensional inconsistencies. Leading industrial operators strategically utilize vacuum induction melting alongside strict electroslag remelting protocols to eradicate microscopic inclusions, ensuring flawless grain boundary transitions.
  • This intense purification approach fundamentally supports compliance programs in aerospace and automotive supply chains by decreasing critical component failure rates by over 18%. Furthermore, establishing a precise martensitic microstructure effectively negates the need for extensive thermal annealing cycles, which optimizes energy budgeting and shortens facility downtime seamlessly.
  • Organizations capable of mastering these high-speed thermomechanical frameworks systematically align their manufacturing strategies with zero-defect engineering requirements, delivering superior ductility and unparalleled performance metrics globally.

What are the Key Data Covered in this Steel Wire Rod Market Research and Growth Report?

  • What is the expected growth of the Steel Wire Rod Market between 2026 and 2030?

    • USD 24.88 billion, at a CAGR of 4.3%

  • What segmentation does the market report cover?

    • The report is segmented by Type (Carbon steel wire rod, Alloy steel wire rod, and Stainless steel wire rod), Application (Construction, Industrial, Automotive, Agriculture, and Others), Product Type (Between 5 to10 mm, Between 10 to 20 mm, and Above 16 to 20 mm) and Geography (APAC, Europe, North America, Middle East and Africa, South America)

  • Which regions are analyzed in the report?

    • APAC, Europe, North America, Middle East and Africa and South America

  • What are the key growth drivers and market challenges?

    • Expanding civil infrastructure and urban construction demands, Decarbonization mandates strain secondary wire rod operations

  • Who are the major players in the Steel Wire Rod Market?

    • Acerinox SA, Ansteel Group Corp., Aperam SA, ArcelorMittal S.A., Celsa Group, Charter Manufacturing, China BaoWu Steel Group Corp., Commercial Metals Co., EVRAZ Plc, Gerdau SA, HBIS Group Co. Ltd., Hyundai Steel Co., Kobe Steel Ltd., LIBERTY Steel Group, Mechel PAO, Nucor Corp., Outokumpu Oyj, POSCO Co. Ltd., Riva Fire SpA and Steel Dynamics Inc.

Market Research Insights

  • The industry is undergoing a critical operational modernization, fueled by demand for faultless feedstock in automotive structural chassis components. Integrating advanced optical emission spectrometry into refining processes enables mills to effectively neutralize elemental trace contamination in real-time. This precision integration directly reduces batch rejection rates by 22%, streamlining complex inventory workflows.
  • Furthermore, optimizing the electric furnace slag foaming regime enhances thermal efficiency seamlessly, yielding a 15% reduction in overall power consumption per melt cycle. Paired with dynamic water cooling systems on high-velocity rolling lines, manufacturers successfully narrow dimensional oval tolerances, capturing maximum final yield parameters. These targeted optimizations drastically improve resource utilization and rapidly solidify compliance within top-tier industrial fastener networks.

We can help! Our analysts can customize this steel wire rod market research report to meet your requirements.

Get in touch

1. Executive Summary

1.1 Market overview

Executive Summary - Chart on Market Overview
Executive Summary - Data Table on Market Overview
Executive Summary - Chart on Global Market Characteristics
Executive Summary - Chart on Market by Geography
Executive Summary - Chart on Market Segmentation by Type
Executive Summary - Chart on Market Segmentation by Application
Executive Summary - Chart on Market Segmentation by Product Type
Executive Summary - Chart on Incremental Growth
Executive Summary - Data Table on Incremental Growth
Executive Summary - Chart on Company Market Positioning

2. Technavio Analysis

2.1 Analysis of price sensitivity, lifecycle, customer purchase basket, adoption rates, and purchase criteria

2.2 Criticality of inputs and Factors of differentiation

Chart on Overview on criticality of inputs and factors of differentiation

2.3 Factors of disruption

Chart on Overview on factors of disruption

2.4 Impact of drivers and challenges

Chart on Impact of drivers and challenges in 2025 and 2030

3. Market Landscape

3.1 Market ecosystem

Chart on Parent Market
Data Table on - Parent Market

3.2 Market characteristics

Chart on Market characteristics analysis

3.3 Value chain analysis

Chart on Value chain analysis

4. Market Sizing

4.1 Market definition

Data Table on Offerings of companies included in the market definition

4.2 Market segment analysis

Market segments

4.3 Market size 2025

4.4 Market outlook: Forecast for 2025-2030

Chart on Global - Market size and forecast 2025-2030 ($ million)
Data Table on Global - Market size and forecast 2025-2030 ($ million)
Chart on Global Market: Year-over-year growth 2025-2030 (%)
Data Table on Global Market: Year-over-year growth 2025-2030 (%)

5. Historic Market Size

5.1 Global Steel Wire Rod Market 2020 - 2024

Historic Market Size - Data Table on Global Steel Wire Rod Market 2020 - 2024 ($ million)

5.2 Type segment analysis 2020 - 2024

Historic Market Size - Type Segment 2020 - 2024 ($ million)

5.3 Application segment analysis 2020 - 2024

Historic Market Size - Application Segment 2020 - 2024 ($ million)

5.4 Product Type segment analysis 2020 - 2024

Historic Market Size - Product Type Segment 2020 - 2024 ($ million)

5.5 Geography segment analysis 2020 - 2024

Historic Market Size - Geography Segment 2020 - 2024 ($ million)

5.6 Country segment analysis 2020 - 2024

Historic Market Size - Country Segment 2020 - 2024 ($ million)

6. Qualitative Analysis

6.1 Impact of AI on Global Steel Wire Rod Market

6.2 Impact of geopolitical conflicts on Global Steel Wire Rod Market

7. Five Forces Analysis

7.1 Five forces summary

Five forces analysis - Comparison between 2025 and 2030

7.2 Bargaining power of buyers

Bargaining power of buyers - Impact of key factors 2025 and 2030

7.3 Bargaining power of suppliers

Bargaining power of suppliers - Impact of key factors in 2025 and 2030

7.4 Threat of new entrants

Threat of new entrants - Impact of key factors in 2025 and 2030

7.5 Threat of substitutes

Threat of substitutes - Impact of key factors in 2025 and 2030

7.6 Threat of rivalry

Threat of rivalry - Impact of key factors in 2025 and 2030

7.7 Market condition

Chart on Market condition - Five forces 2025 and 2030

8. Market Segmentation by Type

8.1 Market segments

Chart on Type - Market share 2025-2030 (%)
Data Table on Type - Market share 2025-2030 (%)

8.2 Comparison by Type

Chart on Comparison by Type
Data Table on Comparison by Type

8.3 Carbon steel wire rod - Market size and forecast 2025-2030

Chart on Carbon steel wire rod - Market size and forecast 2025-2030 ($ million)
Data Table on Carbon steel wire rod - Market size and forecast 2025-2030 ($ million)
Chart on Carbon steel wire rod - Year-over-year growth 2025-2030 (%)
Data Table on Carbon steel wire rod - Year-over-year growth 2025-2030 (%)

8.4 Alloy steel wire rod - Market size and forecast 2025-2030

Chart on Alloy steel wire rod - Market size and forecast 2025-2030 ($ million)
Data Table on Alloy steel wire rod - Market size and forecast 2025-2030 ($ million)
Chart on Alloy steel wire rod - Year-over-year growth 2025-2030 (%)
Data Table on Alloy steel wire rod - Year-over-year growth 2025-2030 (%)

8.5 Stainless steel wire rod - Market size and forecast 2025-2030

Chart on Stainless steel wire rod - Market size and forecast 2025-2030 ($ million)
Data Table on Stainless steel wire rod - Market size and forecast 2025-2030 ($ million)
Chart on Stainless steel wire rod - Year-over-year growth 2025-2030 (%)
Data Table on Stainless steel wire rod - Year-over-year growth 2025-2030 (%)

8.6 Market opportunity by Type

Market opportunity by Type ($ million)
Data Table on Market opportunity by Type ($ million)

9. Market Segmentation by Application

9.1 Market segments

Chart on Application - Market share 2025-2030 (%)
Data Table on Application - Market share 2025-2030 (%)

9.2 Comparison by Application

Chart on Comparison by Application
Data Table on Comparison by Application

9.3 Construction - Market size and forecast 2025-2030

Chart on Construction - Market size and forecast 2025-2030 ($ million)
Data Table on Construction - Market size and forecast 2025-2030 ($ million)
Chart on Construction - Year-over-year growth 2025-2030 (%)
Data Table on Construction - Year-over-year growth 2025-2030 (%)

9.4 Industrial - Market size and forecast 2025-2030

Chart on Industrial - Market size and forecast 2025-2030 ($ million)
Data Table on Industrial - Market size and forecast 2025-2030 ($ million)
Chart on Industrial - Year-over-year growth 2025-2030 (%)
Data Table on Industrial - Year-over-year growth 2025-2030 (%)

9.5 Automotive - Market size and forecast 2025-2030

Chart on Automotive - Market size and forecast 2025-2030 ($ million)
Data Table on Automotive - Market size and forecast 2025-2030 ($ million)
Chart on Automotive - Year-over-year growth 2025-2030 (%)
Data Table on Automotive - Year-over-year growth 2025-2030 (%)

9.6 Agriculture - Market size and forecast 2025-2030

Chart on Agriculture - Market size and forecast 2025-2030 ($ million)
Data Table on Agriculture - Market size and forecast 2025-2030 ($ million)
Chart on Agriculture - Year-over-year growth 2025-2030 (%)
Data Table on Agriculture - Year-over-year growth 2025-2030 (%)

9.7 Others - Market size and forecast 2025-2030

Chart on Others - Market size and forecast 2025-2030 ($ million)
Data Table on Others - Market size and forecast 2025-2030 ($ million)
Chart on Others - Year-over-year growth 2025-2030 (%)
Data Table on Others - Year-over-year growth 2025-2030 (%)

9.8 Market opportunity by Application

Market opportunity by Application ($ million)
Data Table on Market opportunity by Application ($ million)

10. Market Segmentation by Product Type

10.1 Market segments

Chart on Product Type - Market share 2025-2030 (%)
Data Table on Product Type - Market share 2025-2030 (%)

10.2 Comparison by Product Type

Chart on Comparison by Product Type
Data Table on Comparison by Product Type

10.3 Between 5 to10 mm - Market size and forecast 2025-2030

Chart on Between 5 to10 mm - Market size and forecast 2025-2030 ($ million)
Data Table on Between 5 to10 mm - Market size and forecast 2025-2030 ($ million)
Chart on Between 5 to10 mm - Year-over-year growth 2025-2030 (%)
Data Table on Between 5 to10 mm - Year-over-year growth 2025-2030 (%)

10.4 Between 10 to 20 mm - Market size and forecast 2025-2030

Chart on Between 10 to 20 mm - Market size and forecast 2025-2030 ($ million)
Data Table on Between 10 to 20 mm - Market size and forecast 2025-2030 ($ million)
Chart on Between 10 to 20 mm - Year-over-year growth 2025-2030 (%)
Data Table on Between 10 to 20 mm - Year-over-year growth 2025-2030 (%)

10.5 Above 16 to 20 mm - Market size and forecast 2025-2030

Chart on Above 16 to 20 mm - Market size and forecast 2025-2030 ($ million)
Data Table on Above 16 to 20 mm - Market size and forecast 2025-2030 ($ million)
Chart on Above 16 to 20 mm - Year-over-year growth 2025-2030 (%)
Data Table on Above 16 to 20 mm - Year-over-year growth 2025-2030 (%)

10.6 Market opportunity by Product Type

Market opportunity by Product Type ($ million)
Data Table on Market opportunity by Product Type ($ million)

11. Customer Landscape

11.1 Customer landscape overview

Analysis of price sensitivity, lifecycle, customer purchase basket, adoption rates, and purchase criteria

12. Geographic Landscape

12.1 Geographic segmentation

Chart on Market share by geography 2025-2030 (%)
Data Table on Market share by geography 2025-2030 (%)

12.2 Geographic comparison

Chart on Geographic comparison
Data Table on Geographic comparison

12.3 APAC - Market size and forecast 2025-2030

Chart on APAC - Market size and forecast 2025-2030 ($ million)
Data Table on APAC - Market size and forecast 2025-2030 ($ million)
Chart on APAC - Year-over-year growth 2025-2030 (%)
Data Table on APAC - Year-over-year growth 2025-2030 (%)
Chart on Regional Comparison - APAC
Data Table on Regional Comparison - APAC

12.3.1 China - Market size and forecast 2025-2030

Chart on China - Market size and forecast 2025-2030 ($ million)
Data Table on China - Market size and forecast 2025-2030 ($ million)
Chart on China - Year-over-year growth 2025-2030 (%)
Data Table on China - Year-over-year growth 2025-2030 (%)

12.3.2 India - Market size and forecast 2025-2030

Chart on India - Market size and forecast 2025-2030 ($ million)
Data Table on India - Market size and forecast 2025-2030 ($ million)
Chart on India - Year-over-year growth 2025-2030 (%)
Data Table on India - Year-over-year growth 2025-2030 (%)

12.3.3 Japan - Market size and forecast 2025-2030

Chart on Japan - Market size and forecast 2025-2030 ($ million)
Data Table on Japan - Market size and forecast 2025-2030 ($ million)
Chart on Japan - Year-over-year growth 2025-2030 (%)
Data Table on Japan - Year-over-year growth 2025-2030 (%)

12.3.4 South Korea - Market size and forecast 2025-2030

Chart on South Korea - Market size and forecast 2025-2030 ($ million)
Data Table on South Korea - Market size and forecast 2025-2030 ($ million)
Chart on South Korea - Year-over-year growth 2025-2030 (%)
Data Table on South Korea - Year-over-year growth 2025-2030 (%)

12.3.5 Vietnam - Market size and forecast 2025-2030

Chart on Vietnam - Market size and forecast 2025-2030 ($ million)
Data Table on Vietnam - Market size and forecast 2025-2030 ($ million)
Chart on Vietnam - Year-over-year growth 2025-2030 (%)
Data Table on Vietnam - Year-over-year growth 2025-2030 (%)

12.3.6 Indonesia - Market size and forecast 2025-2030

Chart on Indonesia - Market size and forecast 2025-2030 ($ million)
Data Table on Indonesia - Market size and forecast 2025-2030 ($ million)
Chart on Indonesia - Year-over-year growth 2025-2030 (%)
Data Table on Indonesia - Year-over-year growth 2025-2030 (%)

12.4 Europe - Market size and forecast 2025-2030

Chart on Europe - Market size and forecast 2025-2030 ($ million)
Data Table on Europe - Market size and forecast 2025-2030 ($ million)
Chart on Europe - Year-over-year growth 2025-2030 (%)
Data Table on Europe - Year-over-year growth 2025-2030 (%)
Chart on Regional Comparison - Europe
Data Table on Regional Comparison - Europe

12.4.1 Germany - Market size and forecast 2025-2030

Chart on Germany - Market size and forecast 2025-2030 ($ million)
Data Table on Germany - Market size and forecast 2025-2030 ($ million)
Chart on Germany - Year-over-year growth 2025-2030 (%)
Data Table on Germany - Year-over-year growth 2025-2030 (%)

12.4.2 France - Market size and forecast 2025-2030

Chart on France - Market size and forecast 2025-2030 ($ million)
Data Table on France - Market size and forecast 2025-2030 ($ million)
Chart on France - Year-over-year growth 2025-2030 (%)
Data Table on France - Year-over-year growth 2025-2030 (%)

12.4.3 Italy - Market size and forecast 2025-2030

Chart on Italy - Market size and forecast 2025-2030 ($ million)
Data Table on Italy - Market size and forecast 2025-2030 ($ million)
Chart on Italy - Year-over-year growth 2025-2030 (%)
Data Table on Italy - Year-over-year growth 2025-2030 (%)

12.4.4 Spain - Market size and forecast 2025-2030

Chart on Spain - Market size and forecast 2025-2030 ($ million)
Data Table on Spain - Market size and forecast 2025-2030 ($ million)
Chart on Spain - Year-over-year growth 2025-2030 (%)
Data Table on Spain - Year-over-year growth 2025-2030 (%)

12.4.5 UK - Market size and forecast 2025-2030

Chart on UK - Market size and forecast 2025-2030 ($ million)
Data Table on UK - Market size and forecast 2025-2030 ($ million)
Chart on UK - Year-over-year growth 2025-2030 (%)
Data Table on UK - Year-over-year growth 2025-2030 (%)

12.4.6 The Netherlands - Market size and forecast 2025-2030

Chart on The Netherlands - Market size and forecast 2025-2030 ($ million)
Data Table on The Netherlands - Market size and forecast 2025-2030 ($ million)
Chart on The Netherlands - Year-over-year growth 2025-2030 (%)
Data Table on The Netherlands - Year-over-year growth 2025-2030 (%)

12.5 North America - Market size and forecast 2025-2030

Chart on North America - Market size and forecast 2025-2030 ($ million)
Data Table on North America - Market size and forecast 2025-2030 ($ million)
Chart on North America - Year-over-year growth 2025-2030 (%)
Data Table on North America - Year-over-year growth 2025-2030 (%)
Chart on Regional Comparison - North America
Data Table on Regional Comparison - North America

12.5.1 US - Market size and forecast 2025-2030

Chart on US - Market size and forecast 2025-2030 ($ million)
Data Table on US - Market size and forecast 2025-2030 ($ million)
Chart on US - Year-over-year growth 2025-2030 (%)
Data Table on US - Year-over-year growth 2025-2030 (%)

12.5.2 Canada - Market size and forecast 2025-2030

Chart on Canada - Market size and forecast 2025-2030 ($ million)
Data Table on Canada - Market size and forecast 2025-2030 ($ million)
Chart on Canada - Year-over-year growth 2025-2030 (%)
Data Table on Canada - Year-over-year growth 2025-2030 (%)

12.5.3 Mexico - Market size and forecast 2025-2030

Chart on Mexico - Market size and forecast 2025-2030 ($ million)
Data Table on Mexico - Market size and forecast 2025-2030 ($ million)
Chart on Mexico - Year-over-year growth 2025-2030 (%)
Data Table on Mexico - Year-over-year growth 2025-2030 (%)

12.6 Middle East and Africa - Market size and forecast 2025-2030

Chart on Middle East and Africa - Market size and forecast 2025-2030 ($ million)
Data Table on Middle East and Africa - Market size and forecast 2025-2030 ($ million)
Chart on Middle East and Africa - Year-over-year growth 2025-2030 (%)
Data Table on Middle East and Africa - Year-over-year growth 2025-2030 (%)
Chart on Regional Comparison - Middle East and Africa
Data Table on Regional Comparison - Middle East and Africa

12.6.1 Saudi Arabia - Market size and forecast 2025-2030

Chart on Saudi Arabia - Market size and forecast 2025-2030 ($ million)
Data Table on Saudi Arabia - Market size and forecast 2025-2030 ($ million)
Chart on Saudi Arabia - Year-over-year growth 2025-2030 (%)
Data Table on Saudi Arabia - Year-over-year growth 2025-2030 (%)

12.6.2 UAE - Market size and forecast 2025-2030

Chart on UAE - Market size and forecast 2025-2030 ($ million)
Data Table on UAE - Market size and forecast 2025-2030 ($ million)
Chart on UAE - Year-over-year growth 2025-2030 (%)
Data Table on UAE - Year-over-year growth 2025-2030 (%)

12.6.3 South Africa - Market size and forecast 2025-2030

Chart on South Africa - Market size and forecast 2025-2030 ($ million)
Data Table on South Africa - Market size and forecast 2025-2030 ($ million)
Chart on South Africa - Year-over-year growth 2025-2030 (%)
Data Table on South Africa - Year-over-year growth 2025-2030 (%)

12.6.4 Egypt - Market size and forecast 2025-2030

Chart on Egypt - Market size and forecast 2025-2030 ($ million)
Data Table on Egypt - Market size and forecast 2025-2030 ($ million)
Chart on Egypt - Year-over-year growth 2025-2030 (%)
Data Table on Egypt - Year-over-year growth 2025-2030 (%)

12.6.5 Turkey - Market size and forecast 2025-2030

Chart on Turkey - Market size and forecast 2025-2030 ($ million)
Data Table on Turkey - Market size and forecast 2025-2030 ($ million)
Chart on Turkey - Year-over-year growth 2025-2030 (%)
Data Table on Turkey - Year-over-year growth 2025-2030 (%)

12.7 South America - Market size and forecast 2025-2030

Chart on South America - Market size and forecast 2025-2030 ($ million)
Data Table on South America - Market size and forecast 2025-2030 ($ million)
Chart on South America - Year-over-year growth 2025-2030 (%)
Data Table on South America - Year-over-year growth 2025-2030 (%)
Chart on Regional Comparison - South America
Data Table on Regional Comparison - South America

12.7.1 Brazil - Market size and forecast 2025-2030

Chart on Brazil - Market size and forecast 2025-2030 ($ million)
Data Table on Brazil - Market size and forecast 2025-2030 ($ million)
Chart on Brazil - Year-over-year growth 2025-2030 (%)
Data Table on Brazil - Year-over-year growth 2025-2030 (%)

12.7.2 Argentina - Market size and forecast 2025-2030

Chart on Argentina - Market size and forecast 2025-2030 ($ million)
Data Table on Argentina - Market size and forecast 2025-2030 ($ million)
Chart on Argentina - Year-over-year growth 2025-2030 (%)
Data Table on Argentina - Year-over-year growth 2025-2030 (%)

12.7.3 Chile - Market size and forecast 2025-2030

Chart on Chile - Market size and forecast 2025-2030 ($ million)
Data Table on Chile - Market size and forecast 2025-2030 ($ million)
Chart on Chile - Year-over-year growth 2025-2030 (%)
Data Table on Chile - Year-over-year growth 2025-2030 (%)

12.8 Market opportunity by geography

Market opportunity by geography ($ million)
Data Tables on Market opportunity by geography ($ million)

13. Drivers, Challenges, and Opportunity

13.1 Market drivers

Expanding civil infrastructure and urban construction demands
Advanced metallurgical innovations in specialty wire production
Automotive electrification driving demand for specialized fasteners

13.2 Market challenges

Decarbonization mandates strain secondary wire rod operations
Escalating protectionist trade policies destabilize rod flows
Downstream specification pressures strain rolling mill efficiency

13.3 Impact of drivers and challenges

Impact of drivers and challenges in 2025 and 2030

13.4 Market opportunities

Autonomous mill orchestration enhances wire rod production
Decarbonization mandates accelerate adoption of green feedstocks
Downstream specialization drives high tensile rod development

14. Competitive Landscape

14.1 Overview

14.2

Overview on criticality of inputs and factors of differentiation

14.3 Landscape disruption

Overview on factors of disruption

14.4 Industry risks

Impact of key risks on business

15. Competitive Analysis

15.1 Companies profiled

Companies covered

15.2 Company ranking index

15.3 Market positioning of companies

Matrix on companies position and classification

15.4 Acerinox SA

Acerinox SA - Overview
Acerinox SA - Business segments
Acerinox SA - Key offerings
Acerinox SA - Segment focus
SWOT

15.5 Ansteel Group Corp.

Ansteel Group Corp. - Overview
Ansteel Group Corp. - Product / Service
Ansteel Group Corp. - Key offerings
SWOT

15.6 Aperam SA

Aperam SA - Overview
Aperam SA - Business segments
Aperam SA - Key offerings
Aperam SA - Segment focus
SWOT

15.7 ArcelorMittal S.A.

ArcelorMittal S.A. - Overview
ArcelorMittal S.A. - Business segments
ArcelorMittal S.A. - Key offerings
ArcelorMittal S.A. - Segment focus
SWOT

15.8 China BaoWu Steel Group Corp.

China BaoWu Steel Group Corp. - Overview
China BaoWu Steel Group Corp. - Product / Service
China BaoWu Steel Group Corp. - Key offerings
SWOT

15.9 Commercial Metals Co.

Commercial Metals Co. - Overview
Commercial Metals Co. - Business segments
Commercial Metals Co. - Key offerings
Commercial Metals Co. - Segment focus
SWOT

15.10 EVRAZ Plc

EVRAZ Plc - Overview
EVRAZ Plc - Product / Service
EVRAZ Plc - Key offerings
SWOT

15.11 Gerdau SA

Gerdau SA - Overview
Gerdau SA - Business segments
Gerdau SA - Key offerings
Gerdau SA - Segment focus
SWOT

15.12 HBIS Group Co. Ltd.

HBIS Group Co. Ltd. - Overview
HBIS Group Co. Ltd. - Product / Service
HBIS Group Co. Ltd. - Key offerings
SWOT

15.13 Hyundai Steel Co.

Hyundai Steel Co. - Overview
Hyundai Steel Co. - Product / Service
Hyundai Steel Co. - Key offerings
SWOT

15.14 Kobe Steel Ltd.

Kobe Steel Ltd. - Overview
Kobe Steel Ltd. - Business segments
Kobe Steel Ltd. - Key offerings
Kobe Steel Ltd. - Segment focus
SWOT

15.15 Mechel PAO

Mechel PAO - Overview
Mechel PAO - Product / Service
Mechel PAO - Key offerings
SWOT

15.16 Outokumpu Oyj

Outokumpu Oyj - Overview
Outokumpu Oyj - Business segments
Outokumpu Oyj - Key offerings
Outokumpu Oyj - Segment focus
SWOT

15.17 POSCO Co. Ltd.

POSCO Co. Ltd. - Overview
POSCO Co. Ltd. - Business segments
POSCO Co. Ltd. - Key news
POSCO Co. Ltd. - Key offerings
POSCO Co. Ltd. - Segment focus
SWOT

15.18 Steel Dynamics Inc.

Steel Dynamics Inc. - Overview
Steel Dynamics Inc. - Product / Service
Steel Dynamics Inc. - Key offerings
SWOT

16. Appendix

16.1 Scope of the report

Market definition
Objectives
Notes and caveats

16.2 Inclusions and exclusions checklist

Inclusions checklist
Exclusions checklist

16.3 Currency conversion rates for US$

16.4 Research methodology

16.5 Data procurement

Information sources

16.6 Data validation

16.7 Validation techniques employed for market sizing

16.8 Data synthesis

16.9 360 degree market analysis

16.10 List of abbreviations

Research Methodology

Technavio presents a detailed picture of the market by way of study, synthesis, and summation of data from multiple sources. The analysts have presented the various facets of the market with a particular focus on identifying the key industry influencers. The data thus presented is comprehensive, reliable, and the result of extensive research, both primary and secondary.

INFORMATION SOURCES

Primary sources

  • Manufacturers and suppliers
  • Channel partners
  • Industry experts
  • Strategic decision makers

Secondary sources

  • Industry journals and periodicals
  • Government data
  • Financial reports of key industry players
  • Historical data
  • Press releases

DATA ANALYSIS

Data Synthesis

  • Collation of data
  • Estimation of key figures
  • Analysis of derived insights

Data Validation

  • Triangulation with data models
  • Reference against proprietary databases
  • Corroboration with industry experts

REPORT WRITING

Qualitative

  • Market drivers
  • Market challenges
  • Market trends
  • Five forces analysis

Quantitative

  • Market size and forecast
  • Market segmentation
  • Geographical insights
  • Competitive landscape

Interested in this report?

Get your sample now to see our research methodology and insights!

Download Now

Frequently Asked Questions

Steel Wire Rod market growth will increase by USD 24880.3 million during 2026-2030.

The Steel Wire Rod market is expected to grow at a CAGR of 4.3% during 2026-2030.

Steel Wire Rod market is segmented by Type (Carbon steel wire rod, Alloy steel wire rod, Stainless steel wire rod) Application (Construction, Industrial, Automotive, Agriculture, Others) Product type (Between 5 to10 mm, Between 10 to 20 mm, Above 16 to 20 mm)

Acerinox SA, Ansteel Group Corp., Aperam SA, ArcelorMittal S.A., Celsa Group, Charter Manufacturing, China BaoWu Steel Group Corp., Commercial Metals Co., EVRAZ Plc, Gerdau SA, HBIS Group Co. Ltd., Hyundai Steel Co., Kobe Steel Ltd., LIBERTY Steel Group, Mechel PAO, Nucor Corp., Outokumpu Oyj, POSCO Co. Ltd., Riva Fire SpA, Steel Dynamics Inc. are a few of the key vendors in the Steel Wire Rod market.

APAC will register the highest growth rate of 67.1% among the other regions. Therefore, the Steel Wire Rod market in APAC is expected to garner significant business opportunities for the vendors during the forecast period.

China, India, Japan, South Korea, Vietnam, Indonesia, Germany, France, Italy, Spain, UK, The Netherlands, US, Canada, Mexico, Saudi Arabia, UAE, South Africa, Egypt, Turkey, Brazil, Argentina, Chile

  • Expanding civil infrastructure and urban construction demands is the driving factor this market.

The Steel Wire Rod market vendors should focus on grabbing business opportunities from the Type segment as it accounted for the largest market share in the base year.
RIA - Research AI Assistant
Ask RIA
