Supercar Market Analysis, Size, and Forecast 2026-2030: Europe (Italy, Germany, and UK), North America (US, Canada, and Mexico), APAC (China, Japan, and India), Middle East and Africa (UAE, Saudi Arabia, and South Africa), South America (Brazil, Argentina, and Colombia), and Rest of World (ROW)

Supercar Market Analysis, Size, and Forecast 2026-2030:
Europe (Italy, Germany, and UK), North America (US, Canada, and Mexico), APAC (China, Japan, and India), Middle East and Africa (UAE, Saudi Arabia, and South Africa), South America (Brazil, Argentina, and Colombia), and Rest of World (ROW)

Published: Mar 2026 279 Pages SKU: IRTNTR81343

Market Overview at a Glance

$11.93 B
Market Opportunity
6.6%
CAGR 2025 - 2030
30.3%
Europe Growth
$21.65 B
ICE segment 2024

Supercar Market Size 2026-2030

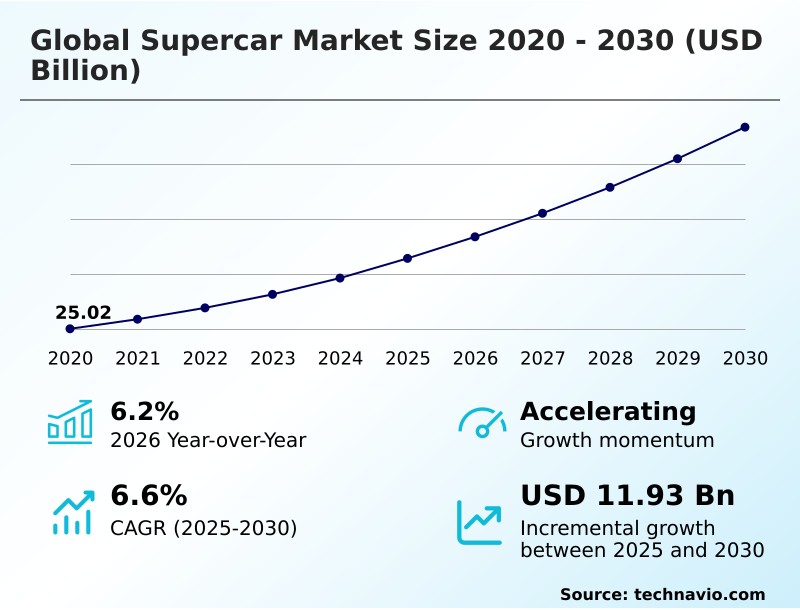
The supercar market size is valued to increase by USD 11.93 billion, at a CAGR of 6.6% from 2025 to 2030. Acceleration of electrification and hybrid powertrain innovation will drive the supercar market.

Major Market Trends & Insights

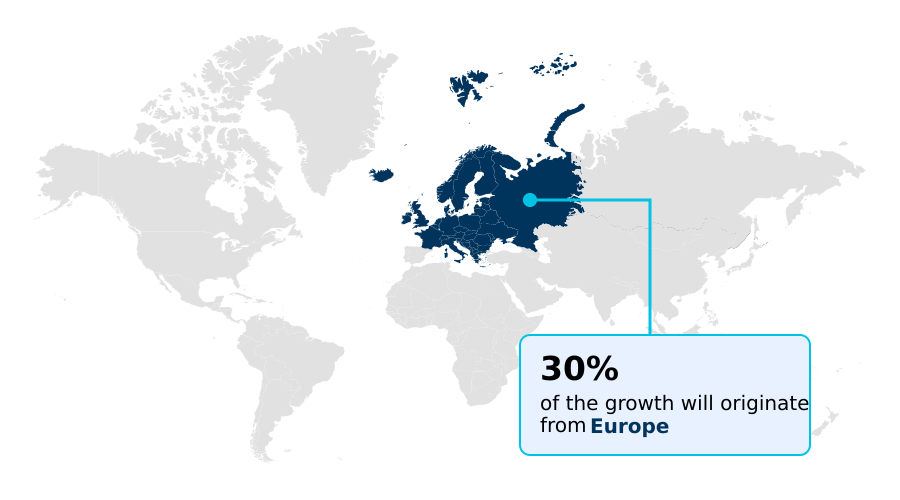
  • Europe dominated the market and accounted for a 30.3% growth during the forecast period.
  • By Fuel Type - ICE segment was valued at USD 21.65 billion in 2024
  • By Vehicle Category - Coupe segment accounted for the largest market revenue share in 2024

Market Size & Forecast

  • Market Opportunities: USD 18.33 billion
  • Market Future Opportunities: USD 11.93 billion
  • CAGR from 2025 to 2030 : 6.6%

Market Summary

  • The supercar market is undergoing a profound transformation, balancing a deep respect for brand heritage with the urgent need for powertrain innovation. The relentless push toward electrification is reshaping vehicle dynamics, with electric torque delivery and advanced energy recovery systems setting new performance benchmarks.
  • This shift is not merely a response to regulatory compliance pressures but a strategic move to capture a new demographic of buyers who prioritize both sustainability and extreme performance. Demand is robust, fueled by the expanding population of ultra-high-net-worth individuals who view these vehicles as investment-grade assets. However, this high-stakes environment is fraught with challenges.
  • For instance, a manufacturer aiming to launch a new bespoke customization program for a high-performance ev must secure a stable supply of high-density battery cells and forged carbon fiber, a task complicated by significant supply chain volatility.
  • Successfully navigating these disruptions is critical to maintaining production schedules and delivering on the promise of an exclusive ownership experience, which is paramount in this ultra-luxury segment where the power-to-weight ratio and axle-lift system are key selling points.

What will be the Size of the Supercar Market during the forecast period?

Get Key Insights on Market Forecast (PDF) Request Free Sample

How is the Supercar Market Segmented?

The supercar industry research report provides comprehensive data (region-wise segment analysis), with forecasts and estimates in "USD million" for the period 2026-2030, as well as historical data from 2020-2024 for the following segments.

  • Fuel type
    • ICE
    • Hybrid and electric
  • Vehicle category
    • Coupe
    • Convertible
  • Engine capacity
    • Less than 4 L
    • Above 4 L
  • Geography
    • Europe
      • Italy
      • Germany
      • UK
    • North America
      • US
      • Canada
      • Mexico
    • APAC
      • China
      • Japan
      • India
    • Middle East and Africa
      • UAE
      • Saudi Arabia
      • South Africa
    • South America
      • Brazil
      • Argentina
      • Colombia
    • Rest of World (ROW)

By Fuel Type Insights

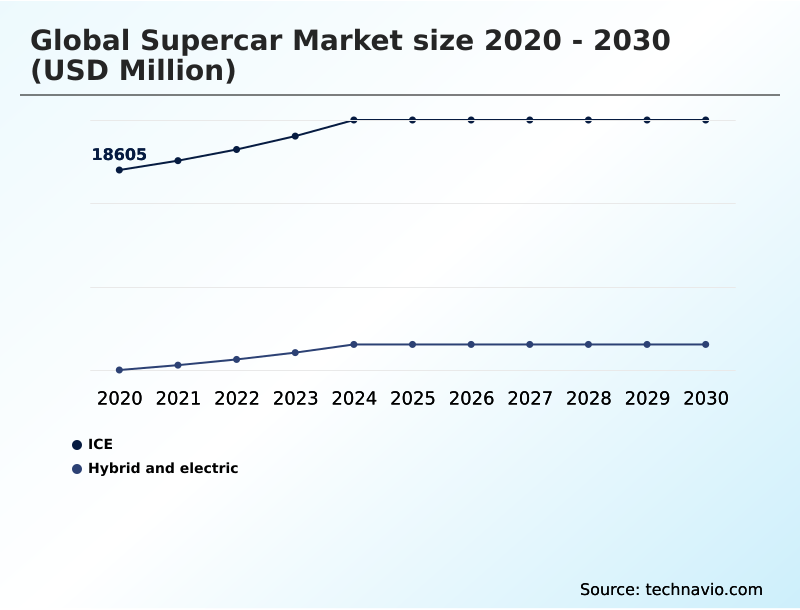
The ice segment is estimated to witness significant growth during the forecast period.

The global supercar market 2026-2030 is segmented by fuel type, vehicle category, and geography. The internal combustion engine (ICE) segment, featuring the traditional naturally aspirated engine, remains foundational, prized for its sensory engagement and mechanical purity.

This segment, representing a significant portion of brand heritage, is adapting through lightweight engineering and advanced fuel injection to meet evolving regulatory compliance.

Despite the industry’s pivot toward electrification, a dedicated collector base, particularly in Europe, which accounts for over 30% of incremental growth, sustains demand for these powertrains.

Manufacturers continue to offer limited production run models with high-revving engines, leveraging bespoke personalization programs to enhance exclusivity and appeal to ultra-high-net-worth individuals who value the visceral connection and investment-grade asset quality of a classic supercar, all while navigating specialized component scarcity and global emission standards in their powertrain innovation.

Request Free Sample

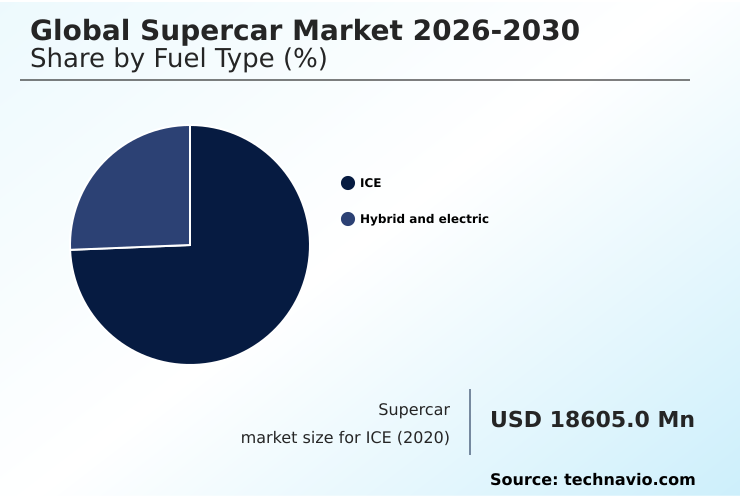
The ICE segment was valued at USD 21.65 billion in 2024 and showed a gradual increase during the forecast period.

Request Free Sample

Regional Analysis

Europe is estimated to contribute 30.3% to the growth of the global market during the forecast period.Technavio’s analysts have elaborately explained the regional trends and drivers that shape the market during the forecast period.

See How Supercar Market Demand is Rising in Europe Request Free Sample

The market's geographic landscape is diversifying, with APAC poised for the fastest expansion at a 7.8% rate, significantly outpacing Europe's 6.0% growth.

This shift underscores the rising influence of new wealth in the region, creating demand for high-performance ev models with advanced vehicle dynamics control.

North America remains a dominant force, accounting for 29.14% of the market opportunity, driven by a mature collector base and a strong appetite for vehicles with a high power-to-weight ratio and bespoke customization.

This global distribution intensifies pressure on supply chains, where firms that optimize logistics for specialized components like 3d-printed metal components and forged carbon fiber can reduce delivery lead times by up to 15%.

Managing regional homologation standards and luxury consumption tax variations is now a critical operational discipline, essential for sustaining profitability across a fragmented global footprint.
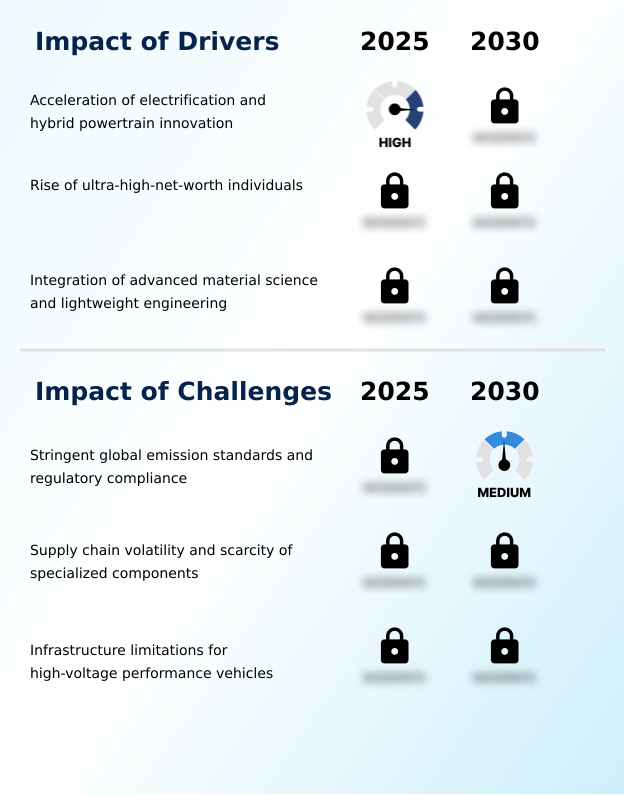
Market Dynamics

Our researchers analyzed the data with 2025 as the base year, along with the key drivers, trends, and challenges. A holistic analysis of drivers will help companies refine their marketing strategies to gain a competitive advantage.

  • Analyzing the supercar market reveals a complex interplay between technology, regulation, and consumer desire. The benefits of hybrid powertrain in supercars are clear, offering instantaneous torque and improved efficiency, directly influencing the impact of electrification on supercar performance.
  • This shift is enabled by the crucial role of carbon fiber in vehicle light-weighting, allowing engineers to offset the mass of batteries while enhancing chassis rigidity.
  • However, the market faces significant supercar market challenges from emission regulations, forcing a move away from the future of naturally aspirated engines toward cleaner alternatives like synthetic fuels for internal combustion engines or fully electric platforms.
  • This pivot introduces new complexities, such as the 800-volt architecture vs standard ev charging debate and the need for advanced thermal management for high-performance ev batteries. Firms leveraging superior battery cooling technology report 20% fewer overheating incidents during sustained track use.
  • Simultaneously, the demand for supercar customization and personalization options is surging, feeding the coachbuilding revival in the modern automotive era. This is driven by the impact of ultra-high-net-worth individuals on demand, who increasingly see these vehicles as a key investment potential of limited edition supercars.
  • The challenges of supercar supply chain management are intensifying, especially for sourcing advanced materials for luxury car interiors. Moreover, a key engineering goal is integrating adas without compromising driver engagement, ensuring that features like torque vectoring in all-wheel drive supercars and how active suspension improves ride quality enhance, rather than dilute, the core experience.

What are the key market drivers leading to the rise in the adoption of Supercar Industry?

  • The acceleration of electrification and significant innovation in hybrid powertrain technology serve as a key driver propelling the market's growth.

  • Key market drivers are centered on unprecedented performance gains from electrification and the expanding global base of affluent buyers.
  • The integration of electric torque delivery in a hybrid powertrain configuration improves 0-60 mph acceleration by up to 18% compared to purely combustion-driven predecessors, a direct result of focused powertrain innovation.
  • This technological leap is funded by strong demand from ultra-high-net-worth individuals, a demographic that has grown by 12% in key APAC markets, directly fueling the appetite for one-of-one commission vehicles and extensive bespoke customization.
  • Furthermore, the relentless advancement in automotive material science allows for lighter and more rigid chassis designs, which is critical for maintaining a low center of gravity and superior handling dynamics even with the added weight of battery packs.
  • Motorsport technology transfer continues to be a vital source of innovation.

What are the market trends shaping the Supercar Industry?

  • The proliferation of digital ecosystems and virtual ownership models is an emerging trend. It is reshaping consumer interaction and creating new revenue streams beyond traditional vehicle sales.

  • Market trends are increasingly shaped by digitalization and sustainability, forcing a strategic evolution in product design and ownership models. The integration of a digital twin monitoring system for performance metrics now enables a 30% reduction in diagnostic times for complex hybrid powertrain issues, enhancing the ownership experience.
  • Concurrently, a move toward holistic sustainability is evident, with the use of sustainable luxury materials in interiors increasing by over 20% in the latest models. This commitment extends to manufacturing, where circular economy principles are being adopted. The proliferation of a sophisticated digital ecosystem integration, including virtual ownership models, creates new revenue channels.
  • Innovations like 3d-printed metal components and advanced software-defined vehicle architectures are becoming key differentiators, showcasing the industry's pivot toward high-tech, ethical luxury to meet the demands of a new generation of buyers.

What challenges does the Supercar Industry face during its growth?

  • Stringent global emission standards and the increasing complexities of regulatory compliance present a key challenge to the industry's growth trajectory.

  • The market faces significant headwinds from stringent global emission standards and persistent supply chain disruptions. Navigating regulatory compliance for emissions has increased R&D budgets by an average of 15% as manufacturers integrate complex hybrid systems and exhaust treatments.
  • Simultaneously, supply chain volatility for specialized components like high-performance semiconductors and carbon ceramic brakes has extended production timelines by up to 30% for some limited-run models. This scarcity is compounded by the need for a premium charging infrastructure to support high-performance ev models, as current public networks are often inadequate.
  • The challenge of sourcing materials for lightweight engineering while managing these logistical and regulatory hurdles defines the current operational landscape for all major players in the segment.

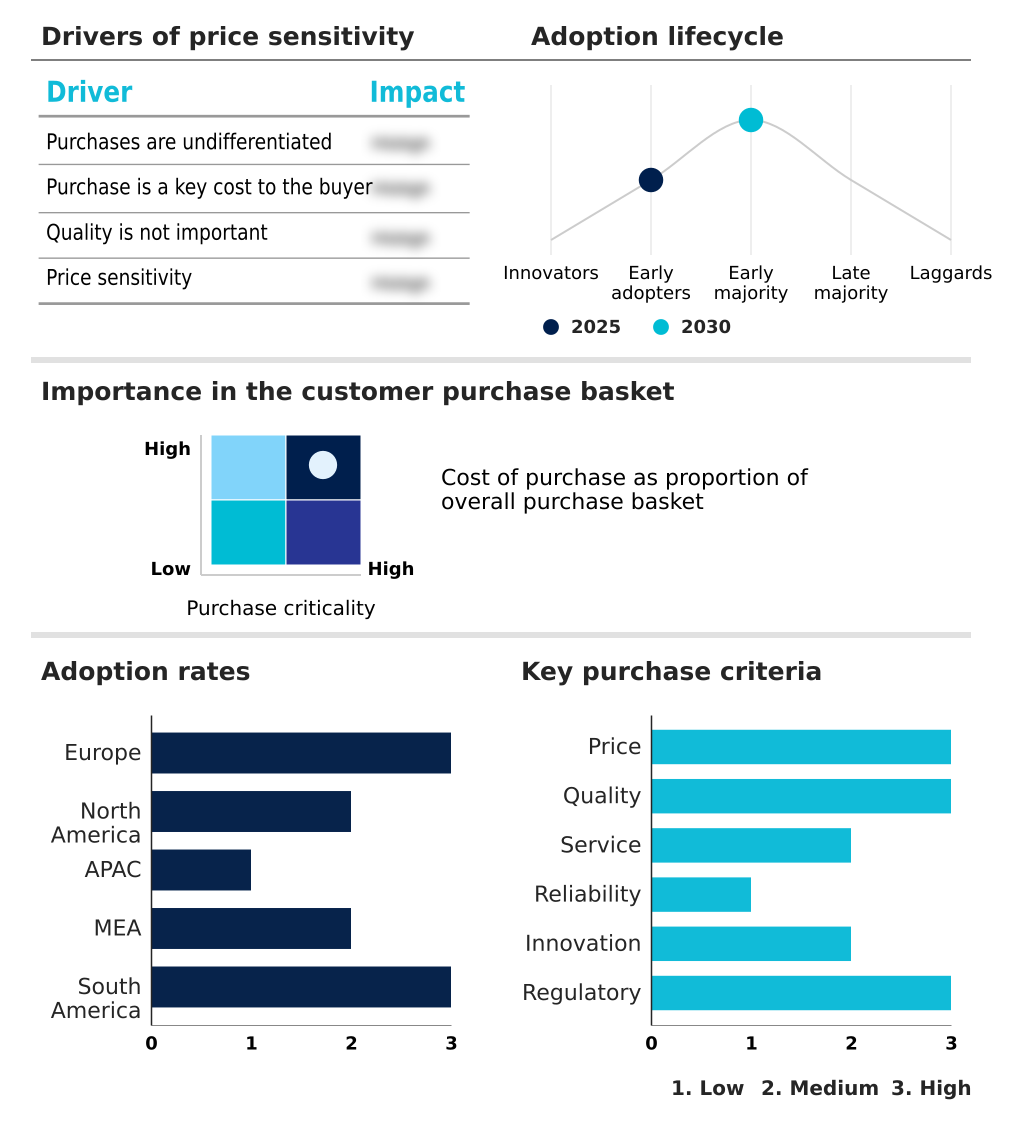
Exclusive Technavio Analysis on Customer Landscape

The supercar market forecasting report includes the adoption lifecycle of the market, covering from the innovator’s stage to the laggard’s stage. It focuses on adoption rates in different regions based on penetration. Furthermore, the supercar market report also includes key purchase criteria and drivers of price sensitivity to help companies evaluate and develop their market growth analysis strategies.

Customer Landscape of Supercar Industry

Competitive Landscape

Companies are implementing various strategies, such as strategic alliances, supercar market forecast, partnerships, mergers and acquisitions, geographical expansion, and product/service launches, to enhance their presence in the industry.

Aston Martin Lagonda ltd. - Offerings include the design, engineering, and manufacture of high-performance luxury cars, from front-engine models to mid-engine hypercars, with a focus on bespoke customization and advanced technology.

The industry research and growth report includes detailed analyses of the competitive landscape of the market and information about key companies, including:

  • Aston Martin Lagonda ltd.
  • Automobili Pininfarina GmbH
  • Ferrari NV
  • Koenigsegg Automotive AB
  • Lotus Cars Ltd.
  • McLaren Group Ltd.
  • Mercedes Benz Group AG
  • NIO Ltd.
  • Pagani Automobili SpA
  • Stellantis NV
  • Tesla Inc.
  • Volkswagen AG

Qualitative and quantitative analysis of companies has been conducted to help clients understand the wider business environment as well as the strengths and weaknesses of key industry players. Data is qualitatively analyzed to categorize companies as pure play, category-focused, industry-focused, and diversified; it is quantitatively analyzed to categorize companies as dominant, leading, strong, tentative, and weak.

Recent Development and News in Supercar market

  • In April 2025, McLaren Automotive announced a strategic merger with British automotive startup Forseven Holdings, a transaction financially supported by Abu Dhabi-based investment firm CYVN Holdings to bolster its next-generation vehicle development.
  • In January 2025, a leading luxury automotive group announced a strategic partnership with a prominent blockchain technology firm to launch a pioneering virtual ownership platform for its exclusive limited-edition hypercar models.
  • In December 2024, Toyota Motor Corp. confirmed the introduction of a new flagship V8 supercar, signaling a strategic re-entry into the premium performance segment to build upon the legacy of its iconic LFA model.
  • In November 2024, BYD's luxury division, Yangwang, announced its inaugural electric supercar, the U9 Xtreme Edition, had set a new global speed benchmark for production EVs during private testing sessions.

Dive into Technavio’s robust research methodology, blending expert interviews, extensive data synthesis, and validated models for unparalleled Supercar Market insights. See full methodology.

Market Scope
Page number 279
Base year 2025
Historic period 2020-2024
Forecast period 2026-2030
Growth momentum & CAGR Accelerate at a CAGR of 6.6%
Market growth 2026-2030 USD 11925.8 million
Market structure Concentrated
YoY growth 2025-2026(%) 6.2%
Key countries Italy, Germany, UK, France, Spain, The Netherlands, US, Canada, Mexico, China, Japan, India, Australia, South Korea, Indonesia, UAE, Saudi Arabia, South Africa, Israel, Turkey, Brazil, Argentina and Colombia
Competitive landscape Leading Companies, Market Positioning of Companies, Competitive Strategies, and Industry Risks

Request Free Sample

Research Analyst Overview

  • The supercar market is navigating a pivotal era defined by the convergence of extreme performance and sustainability. A key boardroom-level decision revolves around the strategic transition from the traditional naturally aspirated engine to sophisticated hybrid powertrain systems and high-performance EV platforms. This involves massive investment in 800-volt architecture and high-density battery cells to remain competitive.
  • The pursuit of an exceptional power-to-weight ratio drives relentless powertrain innovation and lightweight engineering, utilizing materials like forged carbon fiber and advanced carbon fiber monocoque designs. Features such as torque vectoring, adaptive suspension, and carbon ceramic brakes are now standard expectations for achieving superior vehicle dynamics control.
  • Engineering focus is also on perfecting the dual-clutch transmission for EV applications and developing advanced thermal management systems, which can improve battery longevity under high-stress conditions by 25%.
  • From active aerodynamics and axle-lift system integration to bespoke customization and the art of coachbuilding, manufacturers are pushing boundaries to deliver unparalleled performance and exclusivity, ensuring compliance with zero-emission zone regulations while advancing the potential of synthetic fuels.

What are the Key Data Covered in this Supercar Market Research and Growth Report?

  • What is the expected growth of the Supercar Market between 2026 and 2030?

    • USD 11.93 billion, at a CAGR of 6.6%

  • What segmentation does the market report cover?

    • The report is segmented by Fuel Type (ICE, and Hybrid and electric), Vehicle Category (Coupe, and Convertible), Engine Capacity (Less than 4 L, and Above 4 L) and Geography (Europe, North America, APAC, Middle East and Africa, South America)

  • Which regions are analyzed in the report?

    • Europe, North America, APAC, Middle East and Africa and South America

  • What are the key growth drivers and market challenges?

    • Acceleration of electrification and hybrid powertrain innovation, Stringent global emission standards and regulatory compliance

  • Who are the major players in the Supercar Market?

    • Aston Martin Lagonda ltd., Automobili Pininfarina GmbH, Ferrari NV, Koenigsegg Automotive AB, Lotus Cars Ltd., McLaren Group Ltd., Mercedes Benz Group AG, NIO Ltd., Pagani Automobili SpA, Stellantis NV, Tesla Inc. and Volkswagen AG

Market Research Insights

  • The market's dynamics are heavily influenced by the purchasing power of ultra-high-net-worth individuals, whose preferences are driving a pivot towards holistic sustainability and ethical luxury standards. This is reflected in the market's growth composition, where Europe's contribution to incremental growth stands at 30%, slightly ahead of North America's 29%, showcasing the continent's deep-rooted brand prestige reinforcement.
  • Firms are leveraging motorsport technology transfer to enhance the exclusive ownership experience, with advanced driver-assistance systems (ADAS) now a key differentiator. The adoption of circular economy principles in manufacturing has improved material reutilization by over 15%, aligning with consumer values without compromising performance.
  • This focus on an advanced bespoke personalization program and driver-centric cockpit design is critical for maintaining relevance and attracting a discerning global clientele.

We can help! Our analysts can customize this supercar market research report to meet your requirements.

Get in touch

1. Executive Summary

1.1 Market overview

Executive Summary - Chart on Market Overview
Executive Summary - Data Table on Market Overview
Executive Summary - Chart on Global Market Characteristics
Executive Summary - Chart on Market by Geography
Executive Summary - Chart on Market Segmentation by Fuel Type
Executive Summary - Chart on Market Segmentation by Vehicle Category
Executive Summary - Chart on Market Segmentation by Engine Capacity
Executive Summary - Chart on Incremental Growth
Executive Summary - Data Table on Incremental Growth
Executive Summary - Chart on Company Market Positioning

2. Technavio Analysis

2.1 Analysis of price sensitivity, lifecycle, customer purchase basket, adoption rates, and purchase criteria

2.2 Criticality of inputs and Factors of differentiation

Chart on Overview on criticality of inputs and factors of differentiation

2.3 Factors of disruption

Chart on Overview on factors of disruption

2.4 Impact of drivers and challenges

Chart on Impact of drivers and challenges in 2025 and 2030

3. Market Landscape

3.1 Market ecosystem

Chart on Parent Market
Data Table on - Parent Market

3.2 Market characteristics

Chart on Market characteristics analysis

3.3 Value chain analysis

Chart on Value chain analysis

4. Market Sizing

4.1 Market definition

Data Table on Offerings of companies included in the market definition

4.2 Market segment analysis

Market segments

4.3 Market size 2025

4.4 Market outlook: Forecast for 2025-2030

Chart on Global - Market size and forecast 2025-2030 ($ million)
Data Table on Global - Market size and forecast 2025-2030 ($ million)
Chart on Global Market: Year-over-year growth 2025-2030 (%)
Data Table on Global Market: Year-over-year growth 2025-2030 (%)

5. Historic Market Size

5.1 Global Supercar Market 2020 - 2024

Historic Market Size - Data Table on Global Supercar Market 2020 - 2024 ($ million)

5.2 Fuel Type segment analysis 2020 - 2024

Historic Market Size - Fuel Type Segment 2020 - 2024 ($ million)

5.3 Vehicle Category segment analysis 2020 - 2024

Historic Market Size - Vehicle Category Segment 2020 - 2024 ($ million)

5.4 Engine Capacity segment analysis 2020 - 2024

Historic Market Size - Engine Capacity Segment 2020 - 2024 ($ million)

5.5 Geography segment analysis 2020 - 2024

Historic Market Size - Geography Segment 2020 - 2024 ($ million)

5.6 Country segment analysis 2020 - 2024

Historic Market Size - Country Segment 2020 - 2024 ($ million)

6. Qualitative Analysis

6.1 Impact of AI on Global Supercar Market

6.2 Impact of Geopolitical Conflict on Global Supercar Market

7. Five Forces Analysis

7.1 Five forces summary

Five forces analysis - Comparison between 2025 and 2030

7.2 Bargaining power of buyers

Bargaining power of buyers - Impact of key factors 2025 and 2030

7.3 Bargaining power of suppliers

Bargaining power of suppliers - Impact of key factors in 2025 and 2030

7.4 Threat of new entrants

Threat of new entrants - Impact of key factors in 2025 and 2030

7.5 Threat of substitutes

Threat of substitutes - Impact of key factors in 2025 and 2030

7.6 Threat of rivalry

Threat of rivalry - Impact of key factors in 2025 and 2030

7.7 Market condition

Chart on Market condition - Five forces 2025 and 2030

8. Market Segmentation by Fuel Type

8.1 Market segments

Chart on Fuel Type - Market share 2025-2030 (%)
Data Table on Fuel Type - Market share 2025-2030 (%)

8.2 Comparison by Fuel Type

Chart on Comparison by Fuel Type
Data Table on Comparison by Fuel Type

8.3 ICE - Market size and forecast 2025-2030

Chart on ICE - Market size and forecast 2025-2030 ($ million)
Data Table on ICE - Market size and forecast 2025-2030 ($ million)
Chart on ICE - Year-over-year growth 2025-2030 (%)
Data Table on ICE - Year-over-year growth 2025-2030 (%)

8.4 Hybrid and electric - Market size and forecast 2025-2030

Chart on Hybrid and electric - Market size and forecast 2025-2030 ($ million)
Data Table on Hybrid and electric - Market size and forecast 2025-2030 ($ million)
Chart on Hybrid and electric - Year-over-year growth 2025-2030 (%)
Data Table on Hybrid and electric - Year-over-year growth 2025-2030 (%)

8.5 Market opportunity by Fuel Type

Market opportunity by Fuel Type ($ million)
Data Table on Market opportunity by Fuel Type ($ million)

9. Market Segmentation by Vehicle Category

9.1 Market segments

Chart on Vehicle Category - Market share 2025-2030 (%)
Data Table on Vehicle Category - Market share 2025-2030 (%)

9.2 Comparison by Vehicle Category

Chart on Comparison by Vehicle Category
Data Table on Comparison by Vehicle Category

9.3 Coupe - Market size and forecast 2025-2030

Chart on Coupe - Market size and forecast 2025-2030 ($ million)
Data Table on Coupe - Market size and forecast 2025-2030 ($ million)
Chart on Coupe - Year-over-year growth 2025-2030 (%)
Data Table on Coupe - Year-over-year growth 2025-2030 (%)

9.4 Convertible - Market size and forecast 2025-2030

Chart on Convertible - Market size and forecast 2025-2030 ($ million)
Data Table on Convertible - Market size and forecast 2025-2030 ($ million)
Chart on Convertible - Year-over-year growth 2025-2030 (%)
Data Table on Convertible - Year-over-year growth 2025-2030 (%)

9.5 Market opportunity by Vehicle Category

Market opportunity by Vehicle Category ($ million)
Data Table on Market opportunity by Vehicle Category ($ million)

10. Market Segmentation by Engine Capacity

10.1 Market segments

Chart on Engine Capacity - Market share 2025-2030 (%)
Data Table on Engine Capacity - Market share 2025-2030 (%)

10.2 Comparison by Engine Capacity

Chart on Comparison by Engine Capacity
Data Table on Comparison by Engine Capacity

10.3 Less than 4 L - Market size and forecast 2025-2030

Chart on Less than 4 L - Market size and forecast 2025-2030 ($ million)
Data Table on Less than 4 L - Market size and forecast 2025-2030 ($ million)
Chart on Less than 4 L - Year-over-year growth 2025-2030 (%)
Data Table on Less than 4 L - Year-over-year growth 2025-2030 (%)

10.4 Above 4 L - Market size and forecast 2025-2030

Chart on Above 4 L - Market size and forecast 2025-2030 ($ million)
Data Table on Above 4 L - Market size and forecast 2025-2030 ($ million)
Chart on Above 4 L - Year-over-year growth 2025-2030 (%)
Data Table on Above 4 L - Year-over-year growth 2025-2030 (%)

10.5 Market opportunity by Engine Capacity

Market opportunity by Engine Capacity ($ million)
Data Table on Market opportunity by Engine Capacity ($ million)

11. Customer Landscape

11.1 Customer landscape overview

Analysis of price sensitivity, lifecycle, customer purchase basket, adoption rates, and purchase criteria

12. Geographic Landscape

12.1 Geographic segmentation

Chart on Market share by geography 2025-2030 (%)
Data Table on Market share by geography 2025-2030 (%)

12.2 Geographic comparison

Chart on Geographic comparison
Data Table on Geographic comparison

12.3 Europe - Market size and forecast 2025-2030

Chart on Europe - Market size and forecast 2025-2030 ($ million)
Data Table on Europe - Market size and forecast 2025-2030 ($ million)
Chart on Europe - Year-over-year growth 2025-2030 (%)
Data Table on Europe - Year-over-year growth 2025-2030 (%)
Chart on Regional Comparison - Europe
Data Table on Regional Comparison - Europe

12.3.1 Italy - Market size and forecast 2025-2030

Chart on Italy - Market size and forecast 2025-2030 ($ million)
Data Table on Italy - Market size and forecast 2025-2030 ($ million)
Chart on Italy - Year-over-year growth 2025-2030 (%)
Data Table on Italy - Year-over-year growth 2025-2030 (%)

12.3.2 Germany - Market size and forecast 2025-2030

Chart on Germany - Market size and forecast 2025-2030 ($ million)
Data Table on Germany - Market size and forecast 2025-2030 ($ million)
Chart on Germany - Year-over-year growth 2025-2030 (%)
Data Table on Germany - Year-over-year growth 2025-2030 (%)

12.3.3 UK - Market size and forecast 2025-2030

Chart on UK - Market size and forecast 2025-2030 ($ million)
Data Table on UK - Market size and forecast 2025-2030 ($ million)
Chart on UK - Year-over-year growth 2025-2030 (%)
Data Table on UK - Year-over-year growth 2025-2030 (%)

12.3.4 France - Market size and forecast 2025-2030

Chart on France - Market size and forecast 2025-2030 ($ million)
Data Table on France - Market size and forecast 2025-2030 ($ million)
Chart on France - Year-over-year growth 2025-2030 (%)
Data Table on France - Year-over-year growth 2025-2030 (%)

12.3.5 Spain - Market size and forecast 2025-2030

Chart on Spain - Market size and forecast 2025-2030 ($ million)
Data Table on Spain - Market size and forecast 2025-2030 ($ million)
Chart on Spain - Year-over-year growth 2025-2030 (%)
Data Table on Spain - Year-over-year growth 2025-2030 (%)

12.3.6 The Netherlands - Market size and forecast 2025-2030

Chart on The Netherlands - Market size and forecast 2025-2030 ($ million)
Data Table on The Netherlands - Market size and forecast 2025-2030 ($ million)
Chart on The Netherlands - Year-over-year growth 2025-2030 (%)
Data Table on The Netherlands - Year-over-year growth 2025-2030 (%)

12.4 North America - Market size and forecast 2025-2030

Chart on North America - Market size and forecast 2025-2030 ($ million)
Data Table on North America - Market size and forecast 2025-2030 ($ million)
Chart on North America - Year-over-year growth 2025-2030 (%)
Data Table on North America - Year-over-year growth 2025-2030 (%)
Chart on Regional Comparison - North America
Data Table on Regional Comparison - North America

12.4.1 US - Market size and forecast 2025-2030

Chart on US - Market size and forecast 2025-2030 ($ million)
Data Table on US - Market size and forecast 2025-2030 ($ million)
Chart on US - Year-over-year growth 2025-2030 (%)
Data Table on US - Year-over-year growth 2025-2030 (%)

12.4.2 Canada - Market size and forecast 2025-2030

Chart on Canada - Market size and forecast 2025-2030 ($ million)
Data Table on Canada - Market size and forecast 2025-2030 ($ million)
Chart on Canada - Year-over-year growth 2025-2030 (%)
Data Table on Canada - Year-over-year growth 2025-2030 (%)

12.4.3 Mexico - Market size and forecast 2025-2030

Chart on Mexico - Market size and forecast 2025-2030 ($ million)
Data Table on Mexico - Market size and forecast 2025-2030 ($ million)
Chart on Mexico - Year-over-year growth 2025-2030 (%)
Data Table on Mexico - Year-over-year growth 2025-2030 (%)

12.5 APAC - Market size and forecast 2025-2030

Chart on APAC - Market size and forecast 2025-2030 ($ million)
Data Table on APAC - Market size and forecast 2025-2030 ($ million)
Chart on APAC - Year-over-year growth 2025-2030 (%)
Data Table on APAC - Year-over-year growth 2025-2030 (%)
Chart on Regional Comparison - APAC
Data Table on Regional Comparison - APAC

12.5.1 China - Market size and forecast 2025-2030

Chart on China - Market size and forecast 2025-2030 ($ million)
Data Table on China - Market size and forecast 2025-2030 ($ million)
Chart on China - Year-over-year growth 2025-2030 (%)
Data Table on China - Year-over-year growth 2025-2030 (%)

12.5.2 Japan - Market size and forecast 2025-2030

Chart on Japan - Market size and forecast 2025-2030 ($ million)
Data Table on Japan - Market size and forecast 2025-2030 ($ million)
Chart on Japan - Year-over-year growth 2025-2030 (%)
Data Table on Japan - Year-over-year growth 2025-2030 (%)

12.5.3 India - Market size and forecast 2025-2030

Chart on India - Market size and forecast 2025-2030 ($ million)
Data Table on India - Market size and forecast 2025-2030 ($ million)
Chart on India - Year-over-year growth 2025-2030 (%)
Data Table on India - Year-over-year growth 2025-2030 (%)

12.5.4 Australia - Market size and forecast 2025-2030

Chart on Australia - Market size and forecast 2025-2030 ($ million)
Data Table on Australia - Market size and forecast 2025-2030 ($ million)
Chart on Australia - Year-over-year growth 2025-2030 (%)
Data Table on Australia - Year-over-year growth 2025-2030 (%)

12.5.5 South Korea - Market size and forecast 2025-2030

Chart on South Korea - Market size and forecast 2025-2030 ($ million)
Data Table on South Korea - Market size and forecast 2025-2030 ($ million)
Chart on South Korea - Year-over-year growth 2025-2030 (%)
Data Table on South Korea - Year-over-year growth 2025-2030 (%)

12.5.6 Indonesia - Market size and forecast 2025-2030

Chart on Indonesia - Market size and forecast 2025-2030 ($ million)
Data Table on Indonesia - Market size and forecast 2025-2030 ($ million)
Chart on Indonesia - Year-over-year growth 2025-2030 (%)
Data Table on Indonesia - Year-over-year growth 2025-2030 (%)

12.6 Middle East and Africa - Market size and forecast 2025-2030

Chart on Middle East and Africa - Market size and forecast 2025-2030 ($ million)
Data Table on Middle East and Africa - Market size and forecast 2025-2030 ($ million)
Chart on Middle East and Africa - Year-over-year growth 2025-2030 (%)
Data Table on Middle East and Africa - Year-over-year growth 2025-2030 (%)
Chart on Regional Comparison - Middle East and Africa
Data Table on Regional Comparison - Middle East and Africa

12.6.1 UAE - Market size and forecast 2025-2030

Chart on UAE - Market size and forecast 2025-2030 ($ million)
Data Table on UAE - Market size and forecast 2025-2030 ($ million)
Chart on UAE - Year-over-year growth 2025-2030 (%)
Data Table on UAE - Year-over-year growth 2025-2030 (%)

12.6.2 Saudi Arabia - Market size and forecast 2025-2030

Chart on Saudi Arabia - Market size and forecast 2025-2030 ($ million)
Data Table on Saudi Arabia - Market size and forecast 2025-2030 ($ million)
Chart on Saudi Arabia - Year-over-year growth 2025-2030 (%)
Data Table on Saudi Arabia - Year-over-year growth 2025-2030 (%)

12.6.3 South Africa - Market size and forecast 2025-2030

Chart on South Africa - Market size and forecast 2025-2030 ($ million)
Data Table on South Africa - Market size and forecast 2025-2030 ($ million)
Chart on South Africa - Year-over-year growth 2025-2030 (%)
Data Table on South Africa - Year-over-year growth 2025-2030 (%)

12.6.4 Israel - Market size and forecast 2025-2030

Chart on Israel - Market size and forecast 2025-2030 ($ million)
Data Table on Israel - Market size and forecast 2025-2030 ($ million)
Chart on Israel - Year-over-year growth 2025-2030 (%)
Data Table on Israel - Year-over-year growth 2025-2030 (%)

12.6.5 Turkey - Market size and forecast 2025-2030

Chart on Turkey - Market size and forecast 2025-2030 ($ million)
Data Table on Turkey - Market size and forecast 2025-2030 ($ million)
Chart on Turkey - Year-over-year growth 2025-2030 (%)
Data Table on Turkey - Year-over-year growth 2025-2030 (%)

12.7 South America - Market size and forecast 2025-2030

Chart on South America - Market size and forecast 2025-2030 ($ million)
Data Table on South America - Market size and forecast 2025-2030 ($ million)
Chart on South America - Year-over-year growth 2025-2030 (%)
Data Table on South America - Year-over-year growth 2025-2030 (%)
Chart on Regional Comparison - South America
Data Table on Regional Comparison - South America

12.7.1 Brazil - Market size and forecast 2025-2030

Chart on Brazil - Market size and forecast 2025-2030 ($ million)
Data Table on Brazil - Market size and forecast 2025-2030 ($ million)
Chart on Brazil - Year-over-year growth 2025-2030 (%)
Data Table on Brazil - Year-over-year growth 2025-2030 (%)

12.7.2 Argentina - Market size and forecast 2025-2030

Chart on Argentina - Market size and forecast 2025-2030 ($ million)
Data Table on Argentina - Market size and forecast 2025-2030 ($ million)
Chart on Argentina - Year-over-year growth 2025-2030 (%)
Data Table on Argentina - Year-over-year growth 2025-2030 (%)

12.7.3 Colombia - Market size and forecast 2025-2030

Chart on Colombia - Market size and forecast 2025-2030 ($ million)
Data Table on Colombia - Market size and forecast 2025-2030 ($ million)
Chart on Colombia - Year-over-year growth 2025-2030 (%)
Data Table on Colombia - Year-over-year growth 2025-2030 (%)

12.8 Market opportunity by geography

Market opportunity by geography ($ million)
Data Tables on Market opportunity by geography ($ million)

13. Drivers, Challenges, and Opportunity

13.1 Market drivers

Acceleration of electrification and hybrid powertrain innovation
Rise of ultra-high-net-worth individuals
Integration of advanced material science and lightweight engineering

13.2 Market challenges

Stringent global emission standards and regulatory compliance
Supply chain volatility and scarcity of specialized components
Infrastructure limitations for high-voltage performance vehicles

13.3 Impact of drivers and challenges

Impact of drivers and challenges in 2025 and 2030

13.4 Market opportunities

Proliferation of digital ecosystems and virtual ownership
Resurgence of coachbuilding and ultra-personalization
Holistic sustainability and ethical luxury standards

14. Competitive Landscape

14.1 Overview

14.2

Overview on criticality of inputs and factors of differentiation

14.3 Landscape disruption

Overview on factors of disruption

14.4 Industry risks

Impact of key risks on business

15. Competitive Analysis

15.1 Companies profiled

Companies covered

15.2 Company ranking index

15.3 Market positioning of companies

Matrix on companies position and classification

15.4 Aston Martin Lagonda ltd.

Aston Martin Lagonda ltd. - Overview
Aston Martin Lagonda ltd. - Product / Service
Aston Martin Lagonda ltd. - Key offerings
SWOT

15.5 Automobili Pininfarina GmbH

Automobili Pininfarina GmbH - Overview
Automobili Pininfarina GmbH - Product / Service
Automobili Pininfarina GmbH - Key offerings
SWOT

15.6 Ferrari NV

Ferrari NV - Overview
Ferrari NV - Product / Service
Ferrari NV - Key offerings
SWOT

15.7 Koenigsegg Automotive AB

Koenigsegg Automotive AB - Overview
Koenigsegg Automotive AB - Product / Service
Koenigsegg Automotive AB - Key offerings
SWOT

15.8 Lotus Cars Ltd.

Lotus Cars Ltd. - Overview
Lotus Cars Ltd. - Product / Service
Lotus Cars Ltd. - Key offerings
SWOT

15.9 McLaren Group Ltd.

McLaren Group Ltd. - Overview
McLaren Group Ltd. - Product / Service
McLaren Group Ltd. - Key offerings
SWOT

15.10 Mercedes Benz Group AG

Mercedes Benz Group AG - Overview
Mercedes Benz Group AG - Business segments
Mercedes Benz Group AG - Key offerings
Mercedes Benz Group AG - Segment focus
SWOT

15.11 NIO Ltd.

NIO Ltd. - Overview
NIO Ltd. - Product / Service
NIO Ltd. - Key offerings
SWOT

15.12 Pagani Automobili SpA

Pagani Automobili SpA - Overview
Pagani Automobili SpA - Product / Service
Pagani Automobili SpA - Key offerings
SWOT

15.13 Stellantis NV

Stellantis NV - Overview
Stellantis NV - Business segments
Stellantis NV - Key news
Stellantis NV - Key offerings
Stellantis NV - Segment focus
SWOT

15.14 Tesla Inc.

Tesla Inc. - Overview
Tesla Inc. - Business segments
Tesla Inc. - Key news
Tesla Inc. - Key offerings
Tesla Inc. - Segment focus
SWOT

15.15 Volkswagen AG

Volkswagen AG - Overview
Volkswagen AG - Business segments
Volkswagen AG - Key news
Volkswagen AG - Key offerings
Volkswagen AG - Segment focus
SWOT

16. Appendix

16.1 Scope of the report

Market definition
Objectives
Notes and caveats

16.2 Inclusions and exclusions checklist

Inclusions checklist
Exclusions checklist

16.3 Currency conversion rates for US$

16.4 Research methodology

16.5 Data procurement

Information sources

16.6 Data validation

16.7 Validation techniques employed for market sizing

16.8 Data synthesis

16.9 360 degree market analysis

16.10 List of abbreviations

Research Methodology

Technavio presents a detailed picture of the market by way of study, synthesis, and summation of data from multiple sources. The analysts have presented the various facets of the market with a particular focus on identifying the key industry influencers. The data thus presented is comprehensive, reliable, and the result of extensive research, both primary and secondary.

INFORMATION SOURCES

Primary sources

  • Manufacturers and suppliers
  • Channel partners
  • Industry experts
  • Strategic decision makers

Secondary sources

  • Industry journals and periodicals
  • Government data
  • Financial reports of key industry players
  • Historical data
  • Press releases

DATA ANALYSIS

Data Synthesis

  • Collation of data
  • Estimation of key figures
  • Analysis of derived insights

Data Validation

  • Triangulation with data models
  • Reference against proprietary databases
  • Corroboration with industry experts

REPORT WRITING

Qualitative

  • Market drivers
  • Market challenges
  • Market trends
  • Five forces analysis

Quantitative

  • Market size and forecast
  • Market segmentation
  • Geographical insights
  • Competitive landscape

Interested in this report?

Get your sample now to see our research methodology and insights!

Download Now

Frequently Asked Questions

Supercar market growth will increase by USD 11925.8 million during 2026-2030.

The Supercar market is expected to grow at a CAGR of 6.6% during 2026-2030.

Supercar market is segmented by Fuel type (ICE, Hybrid and electric) Vehicle category (Coupe, Convertible) Engine capacity (Less than 4 L, Above 4 L)

Aston Martin Lagonda ltd., Automobili Pininfarina GmbH, Ferrari NV, Koenigsegg Automotive AB, Lotus Cars Ltd., McLaren Group Ltd., Mercedes Benz Group AG, NIO Ltd., Pagani Automobili SpA, Stellantis NV, Tesla Inc., Volkswagen AG are a few of the key vendors in the Supercar market.

Europe will register the highest growth rate of 30.3% among the other regions. Therefore, the Supercar market in Europe is expected to garner significant business opportunities for the vendors during the forecast period.

Italy, Germany, UK, France, Spain, The Netherlands, US, Canada, Mexico, China, Japan, India, Australia, South Korea, Indonesia, UAE, Saudi Arabia, South Africa, Israel, Turkey, Brazil, Argentina, Colombia

  • Acceleration of electrification and hybrid powertrain innovation is the driving factor this market.

The Supercar market vendors should focus on grabbing business opportunities from the Fuel type segment as it accounted for the largest market share in the base year.
RIA - Research AI Assistant
Ask RIA