Surface Disinfectants Market Size 2026-2030
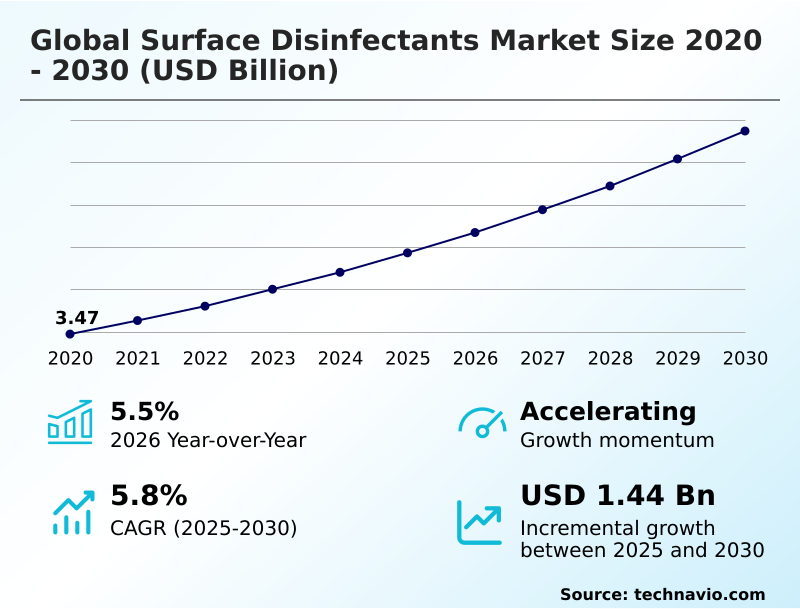
The surface disinfectants market size is valued to increase by USD 1.44 billion, at a CAGR of 5.8% from 2025 to 2030. Increasing focus on healthcare associated infection prevention will drive the surface disinfectants market.
Major Market Trends & Insights
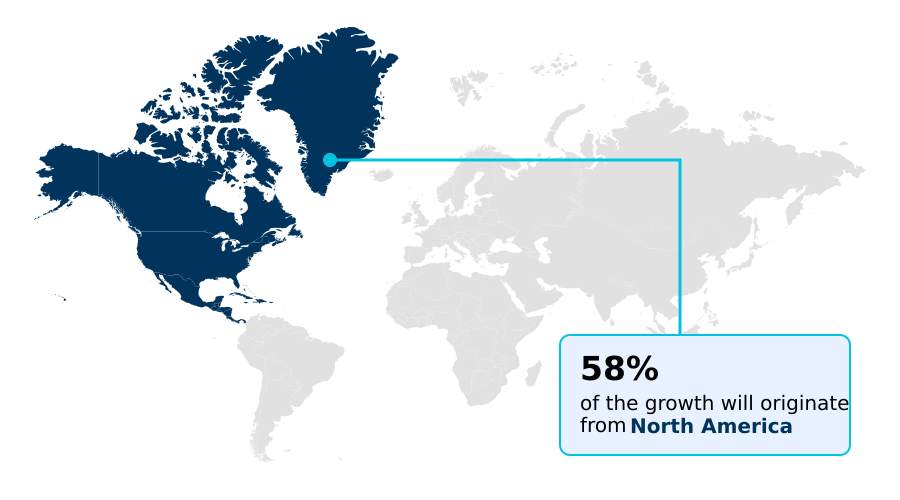
- North America dominated the market and accounted for a 57.8% growth during the forecast period.
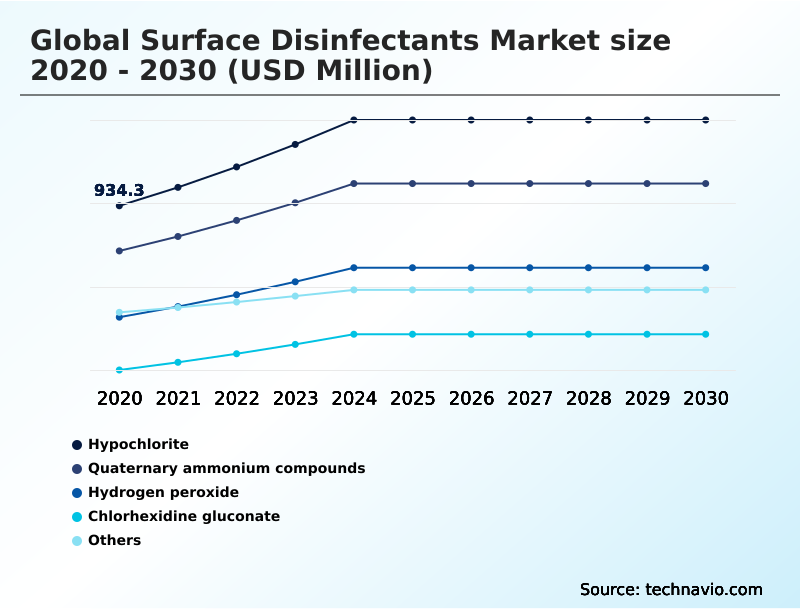
- By Product - Hypochlorite segment was valued at USD 1.18 billion in 2024
- By Type - Liquids segment accounted for the largest market revenue share in 2024
Market Size & Forecast
- Market Opportunities: USD 2.40 billion
- Market Future Opportunities: USD 1.44 billion
- CAGR from 2025 to 2030 : 5.8%
Market Summary
- The surface disinfectants market is defined by a critical need for high-performance solutions that ensure public health safety across healthcare, commercial, and residential sectors. Growth is propelled by an increasing emphasis on healthcare associated infection prevention and a rising consumer preference for sustainable hygiene management.
- Key trends include the integration of iot-enabled disinfectant dispensers and autonomous disinfection robotics to improve efficiency and address labor shortages. For example, a large hospital network can deploy an automated misting hygiene system to perform terminal cleaning procedures in operating rooms overnight, ensuring a sterile operative environment and reducing staff exposure to high-concentration chemicals.
- This approach not only optimizes workforce efficiency optimization but also generates a digital compliance audit trail, improving hygiene protocol adherence. However, the industry navigates challenges related to stringent biocidal product regulation compliance and the environmental impact of single-use formats, pushing for innovation in green chemistry and residue-free disinfectant formula development.
- The demand for products with a short contact time formulation and non-corrosive surface compatibility remains a constant driver for research and development.
What will be the Size of the Surface Disinfectants Market during the forecast period?
Get Key Insights on Market Forecast (PDF) Get Free Sample
How is the Surface Disinfectants Market Segmented?
The surface disinfectants industry research report provides comprehensive data (region-wise segment analysis), with forecasts and estimates in "USD million" for the period 2026-2030, as well as historical data from 2020-2024 for the following segments.
- Product
- Hypochlorite
- Quaternary ammonium compounds
- Hydrogen peroxide
- Chlorhexidine gluconate
- Others
- Type
- Liquids
- Sprays
- Wipes
- Application
- Surface cleaning
- Instruments
- Others
- End-user
- Healthcare
- Households
- Food processing
- Hospitality
- Education
- Geography
- North America
- US
- Canada
- Mexico
- Europe
- Germany
- UK
- France
- APAC
- China
- Japan
- India
- Middle East and Africa
- UAE
- Saudi Arabia
- South Africa
- South America
- Brazil
- Argentina
- Colombia
- Rest of World (ROW)
- North America
By Product Insights
The hypochlorite segment is estimated to witness significant growth during the forecast period.
The hypochlorite segment is fundamental to the surface disinfectants market, but innovation is driving segmentation toward advanced chemistries. Formulations based on quaternary ammonium compound chemistry and accelerated hydrogen peroxide technology are gaining share due to their improved safety profiles.
Demand for products with plant-derived active ingredients and biodegradable disinfectant substrates reflects a push for sustainability and chemical safety in schools. For specialized applications, a sporicidal chemical agent is essential for the cleanroom decontamination process and advanced environmental services hygiene.
The integration of technologies like ultraviolet light disinfection alongside chemical agents has been shown to reduce microbial load detection by up to 99%. This creates a sterile operative environment using a residue-free disinfectant formula and antimicrobial coating technology.
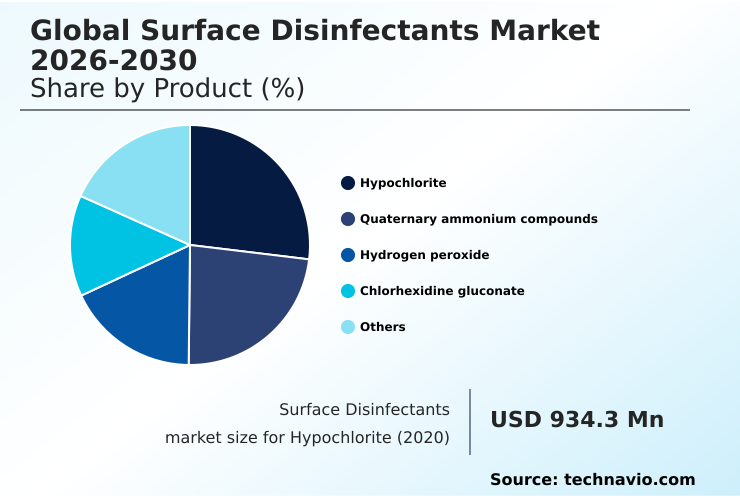
The Hypochlorite segment was valued at USD 1.18 billion in 2024 and showed a gradual increase during the forecast period.
Regional Analysis
North America is estimated to contribute 57.8% to the growth of the global market during the forecast period.Technavio’s analysts have elaborately explained the regional trends and drivers that shape the market during the forecast period.
See How Surface Disinfectants Market Demand is Rising in North America Get Free Sample
The market's geographic landscape reflects varying priorities, from sustainable hygiene management in developed regions to foundational infection prevention and control in emerging economies.
In North America and Europe, there is strong demand for safer choice certified products and eco-friendly cleaning solutions driven by green chemistry innovation, with concentrated refill systems reducing plastic waste by over 50% in some institutions.
In contrast, APAC focuses on accessible sanitizing and disinfection agent options with broad-spectrum microbial efficacy. The food industry globally demands effective food-contact surface sanitizers, such as a peracetic acid based sanitizer, to ensure biosecurity in food processing.
Formulations like antimicrobial surface protectants and phenolic disinfectant compounds are adopted based on regional regulatory and industrial needs.
Market Dynamics
Our researchers analyzed the data with 2025 as the base year, along with the key drivers, trends, and challenges. A holistic analysis of drivers will help companies refine their marketing strategies to gain a competitive advantage.
- The global surface disinfectants market 2026-2030 is increasingly shaped by technical specificity and use-case demands. The efficacy of hydrogen peroxide on surfaces is being re-evaluated as accelerated technologies emerge, offering a sustainable alternative to bleach disinfectants. In food production, the use of quaternary ammonium compounds for food safety is standard, but questions remain about the surface compatibility of peracetic acid.
- Healthcare facilities are leading the charge for biodegradable disinfectant wipes for hospitals, balancing infection control with environmental responsibility. This is especially true where best practices for instrument reprocessing are continuously updated to handle complex devices. A major industry focus is reducing vocs in institutional cleaning, pushing firms toward plant-based disinfectants for childcare and other sensitive environments.
- The rise of automated disinfection systems in healthcare addresses the challenge of managing labor shortages in janitorial services. These systems, sometimes integrating uv-c with chemical disinfection, offer consistent application. However, the cost benefits of concentrated disinfectants remain a strong pull for budget-conscious organizations. The market for surface disinfectant for sensitive electronics is growing rapidly, requiring specialized formulations.
- At the same time, companies face regulatory hurdles for new disinfectants, needing to prove the performance of short contact time sporicidal agents and address the challenges of single-use plastic wipes. The performance of residual antimicrobial coating performance technologies is also under scrutiny.
- Organizations that successfully navigate meeting epa standards for disinfectants are better positioned for growth, with some seeing a 10% faster product-to-market timeline compared to those with less agile compliance strategies.
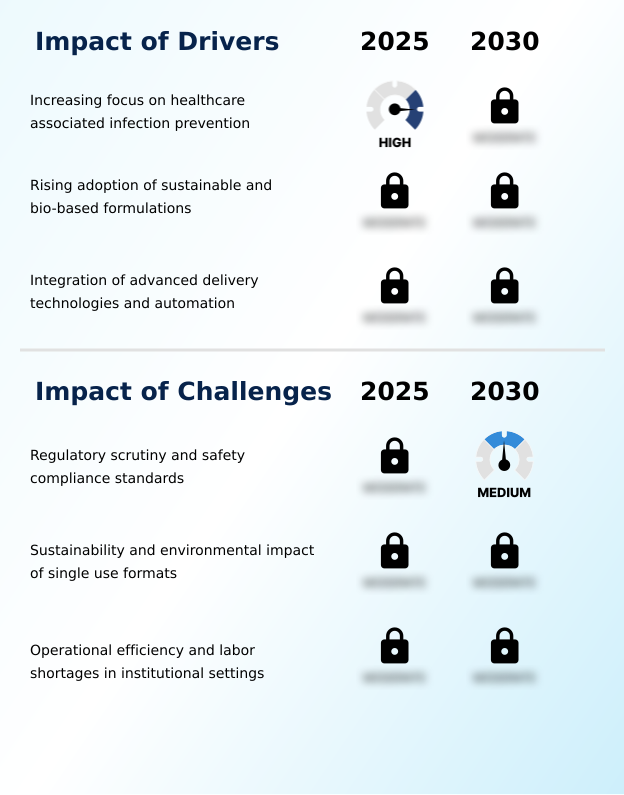
What are the key market drivers leading to the rise in the adoption of Surface Disinfectants Industry?
- An increasing focus on preventing healthcare-associated infections is a primary driver of market growth.
- The primary market driver remains healthcare associated infection prevention, which necessitates strict adherence to high-level disinfection protocols. Hospitals increasingly rely on hospital-grade disinfectant formulations for multi-drug resistant organism control, aiming to achieve a sterile operative environment.
- A robust environmental cleaning program, which includes a thorough terminal cleaning procedure, is critical for pathogen transmission chain disruption. An effective cross-contamination prevention method can improve patient safety outcomes by over 20%.
- Institutional procurement policy now often mandates products that support pathogen outbreak preparedness and align with stringent public health safety standards. As a result, improved hygiene protocol adherence is a key focus for healthcare facilities globally.
What are the market trends shaping the Surface Disinfectants Industry?
- The growing integration of artificial intelligence and autonomous systems for disinfection is an emerging market trend. This shift toward automation enhances precision and operational efficiency in hygiene protocols.
- The market is rapidly adopting advanced technologies to improve hygiene outcomes. The integration of autonomous disinfection robotics and automated misting hygiene systems enables consistent facility coverage, with some users reporting a 35% improvement in workforce efficiency optimization. This shift towards a managed hygiene service model is supported by iot-enabled disinfectant dispensers that provide real-time hygiene analytics.
- Technologies like the electrostatic disinfection sprayer ensure uniform application of formulas with a short contact time formulation, while a digital compliance audit trail validates microbial kill spectra validation. These data-driven hygiene monitoring tools, including touchless dispensing technology, provide facilities with the means to deliver residual antimicrobial protection more effectively and transparently.
What challenges does the Surface Disinfectants Industry face during its growth?
- Stringent regulatory scrutiny and evolving safety compliance standards present a key challenge to industry growth.
- A key challenge is navigating stringent biocidal product regulation compliance, especially concerning volatile organic compound emissions from professional cleaning chemicals. Companies must balance efficacy with non-corrosive surface compatibility, particularly for medical device sterilization and instrument reprocessing solution applications.
- The industry's supply chain resilience strategy is being tested by the push for single-use plastic reduction, leading to innovation in non-woven wipe alternatives. Furthermore, labor shortage mitigation technology is essential for operational cost reduction, as facilities report that automation can lower labor expenses by 15%.
- Effective janitorial staff training on products like enzymatic cleaning solutions is crucial to ensure proper use and maximize safety.
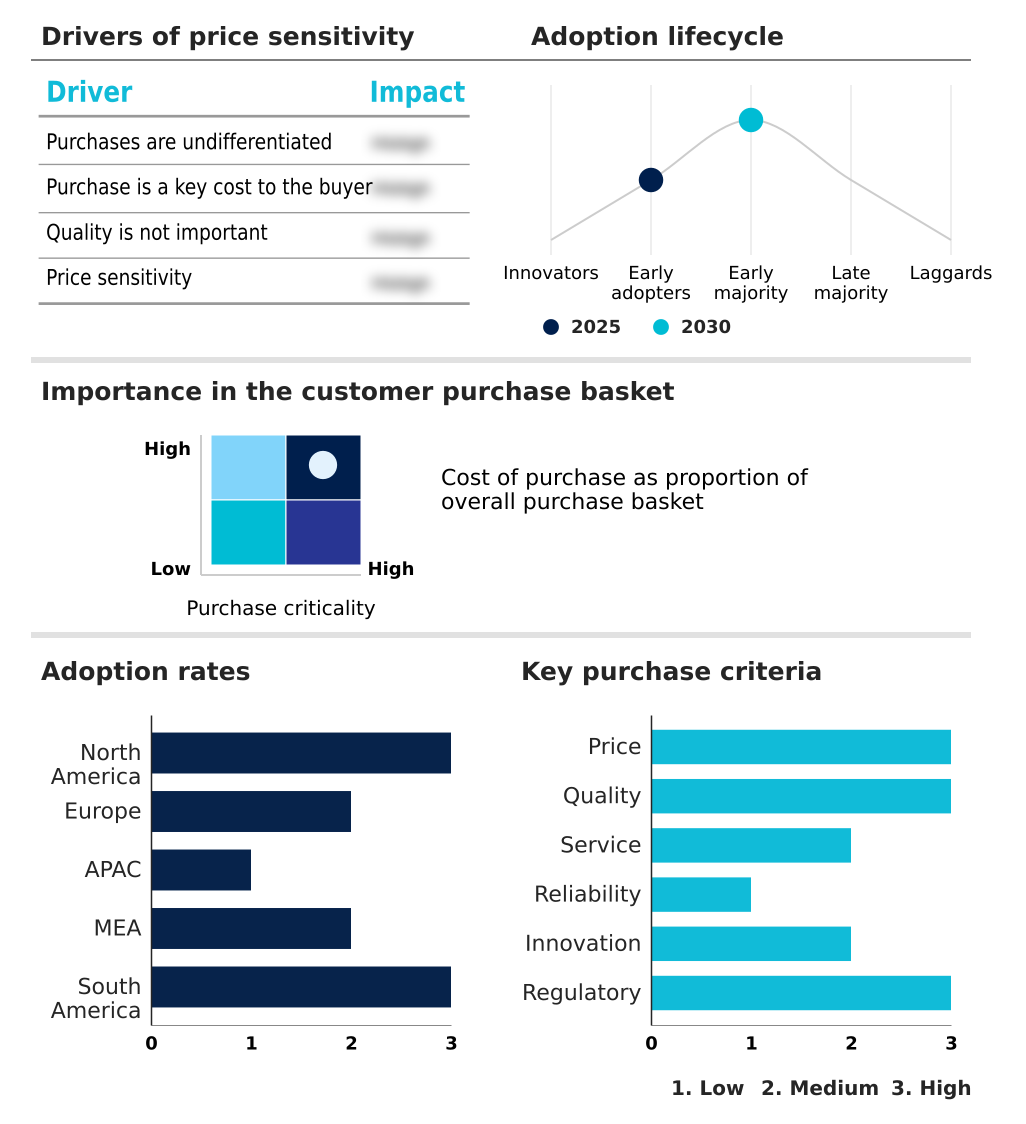
Exclusive Technavio Analysis on Customer Landscape
The surface disinfectants market forecasting report includes the adoption lifecycle of the market, covering from the innovator’s stage to the laggard’s stage. It focuses on adoption rates in different regions based on penetration. Furthermore, the surface disinfectants market report also includes key purchase criteria and drivers of price sensitivity to help companies evaluate and develop their market growth analysis strategies.
Customer Landscape of Surface Disinfectants Industry
Competitive Landscape
Companies are implementing various strategies, such as strategic alliances, surface disinfectants market forecast, partnerships, mergers and acquisitions, geographical expansion, and product/service launches, to enhance their presence in the industry.
3M Co. - A diverse portfolio of surface disinfectant cleaners and sanitizing solutions is provided, addressing various industrial and healthcare hygiene requirements.
The industry research and growth report includes detailed analyses of the competitive landscape of the market and information about key companies, including:
- 3M Co.
- Acuro Organics Ltd.
- BASF SE
- Clariant International Ltd.
- Ecolab Inc.
- Hillyard Inc.
- Kao Corp.
- Kersia Group
- Metrex Research LLC
- Procter and Gamble Co.
- Reckitt Benckiser Group Plc
- Ruhof Corp.
- S.C. Johnson and Son Inc.
- Solenis
- Solvay SA
- STERIS plc
- Tristel Plc
- Unilever PLC
- Whiteley Pty Ltd.
Qualitative and quantitative analysis of companies has been conducted to help clients understand the wider business environment as well as the strengths and weaknesses of key industry players. Data is qualitatively analyzed to categorize companies as pure play, category-focused, industry-focused, and diversified; it is quantitatively analyzed to categorize companies as dominant, leading, strong, tentative, and weak.
Recent Development and News in Surface disinfectants market
- In August, 2024, The Clorox Company expanded its professional portfolio with the shipment of CloroxPro EcoClean Disinfecting Wipes, featuring naturally derived ingredients and a plant-based substrate.
- In September, 2024, Advantech launched the C Rob AMR, an autonomous mobile robot that uses AI to identify objects and adjust its disinfection methods for different surface types.
- In December, 2024, the Virba San surface disinfectant was highlighted for its efficacy in eliminating bacteria, viruses, and fungi within greenhouse environments, adhering to stringent agricultural biosecurity standards.
- In April, 2025, Lonza received formal registration from the European Chemicals Agency for its Sanicid SQ disinfectant, a formulation based on quaternary ammonium compounds, marking a compliance milestone under updated CLP regulations.
Dive into Technavio’s robust research methodology, blending expert interviews, extensive data synthesis, and validated models for unparalleled Surface Disinfectants Market insights. See full methodology.
| Market Scope | |
|---|---|
| Page number | 338 |
| Base year | 2025 |
| Historic period | 2020-2024 |
| Forecast period | 2026-2030 |
| Growth momentum & CAGR | Accelerate at a CAGR of 5.8% |
| Market growth 2026-2030 | USD 1443.0 million |
| Market structure | Fragmented |
| YoY growth 2025-2026(%) | 5.5% |
| Key countries | US, Canada, Mexico, Germany, UK, France, Italy, Spain, The Netherlands, China, Japan, India, South Korea, Australia, Singapore, UAE, Saudi Arabia, South Africa, Qatar, Egypt, Brazil, Argentina and Colombia |
| Competitive landscape | Leading Companies, Market Positioning of Companies, Competitive Strategies, and Industry Risks |
Research Analyst Overview
- The surface disinfectants market is undergoing a critical transformation, moving beyond basic cleaning to sophisticated infection prevention and control. The demand for hospital-grade disinfectant formulations with broad-spectrum microbial efficacy is intensifying, driven by the persistent challenge of healthcare associated infection prevention.
- Boardroom decisions now frequently center on aligning product portfolios with sustainability goals, a shift evident in the development of plant-derived active ingredients and biodegradable disinfectant substrates to reduce environmental impact. For instance, companies are achieving over a 20% reduction in plastic use by promoting concentrated refill systems.
- Innovations in accelerated hydrogen peroxide technology and advanced quaternary ammonium compound chemistry are delivering solutions with a short contact time formulation. This addresses the need for rapid turnover in clinical and commercial settings. The focus on non-corrosive surface compatibility is essential for protecting expensive medical and electronic equipment.
- Ultimately, success hinges on balancing potent sporicidal chemical agent properties with stringent biocidal product regulation compliance and the operational demands of environmental services hygiene.
What are the Key Data Covered in this Surface Disinfectants Market Research and Growth Report?
-
What is the expected growth of the Surface Disinfectants Market between 2026 and 2030?
-
USD 1.44 billion, at a CAGR of 5.8%
-
-
What segmentation does the market report cover?
-
The report is segmented by Product (Hypochlorite, Quaternary ammonium compounds, Hydrogen peroxide, Chlorhexidine gluconate, and Others), Type (Liquids, Sprays, and Wipes), Application (Surface cleaning, Instruments, and Others), End-user (Healthcare, Households, Food processing, Hospitality, and Education) and Geography (North America, Europe, APAC, Middle East and Africa, South America)
-
-
Which regions are analyzed in the report?
-
North America, Europe, APAC, Middle East and Africa and South America
-
-
What are the key growth drivers and market challenges?
-
Increasing focus on healthcare associated infection prevention, Regulatory scrutiny and safety compliance standards
-
-
Who are the major players in the Surface Disinfectants Market?
-
3M Co., Acuro Organics Ltd., BASF SE, Clariant International Ltd., Ecolab Inc., Hillyard Inc., Kao Corp., Kersia Group, Metrex Research LLC, Procter and Gamble Co., Reckitt Benckiser Group Plc, Ruhof Corp., S.C. Johnson and Son Inc., Solenis, Solvay SA, STERIS plc, Tristel Plc, Unilever PLC and Whiteley Pty Ltd.
-
Market Research Insights
- The market's dynamics are shaped by a strong push for sustainable hygiene management and data-driven hygiene monitoring. Institutions are adopting safer choice certified products and green chemistry innovations to align with stringent environmental policies, with facilities reporting up to a 25% reduction in chemical waste through the use of concentrated refill systems.
- The adoption of touchless dispensing technology and real-time hygiene analytics has improved hygiene protocol adherence by over 30% in high-traffic areas. This shift toward a managed hygiene service model optimizes operational cost reduction while enhancing public health safety standards.
- The need to mitigate labor shortages has also accelerated the use of workforce efficiency optimization technologies, creating a more resilient and effective environmental cleaning program.
We can help! Our analysts can customize this surface disinfectants market research report to meet your requirements.
 RIA -
RIA - 
