
Tidal Turbines Market Size 2026-2030
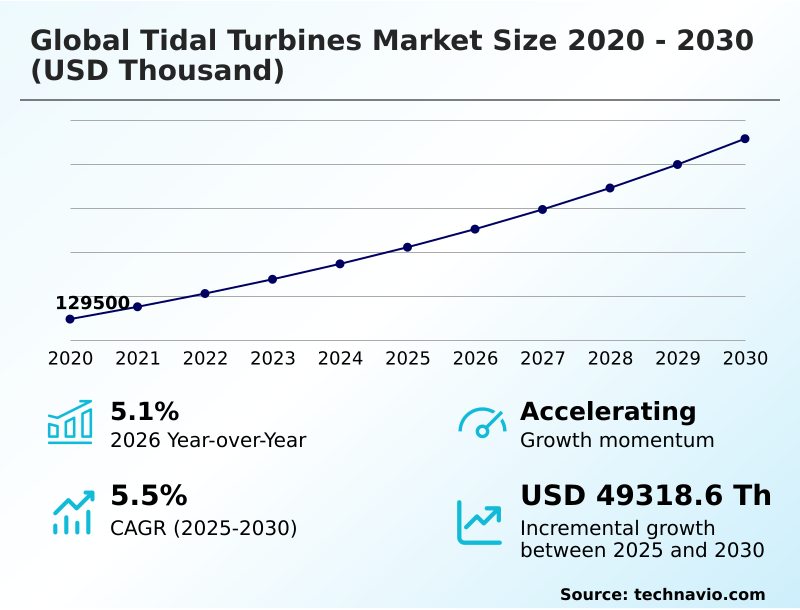
The tidal turbines market size is valued to increase by USD 49.32 million, at a CAGR of 5.5% from 2025 to 2030. Unmatched predictability enhancing grid stability and energy security will drive the tidal turbines market.
Major Market Trends & Insights
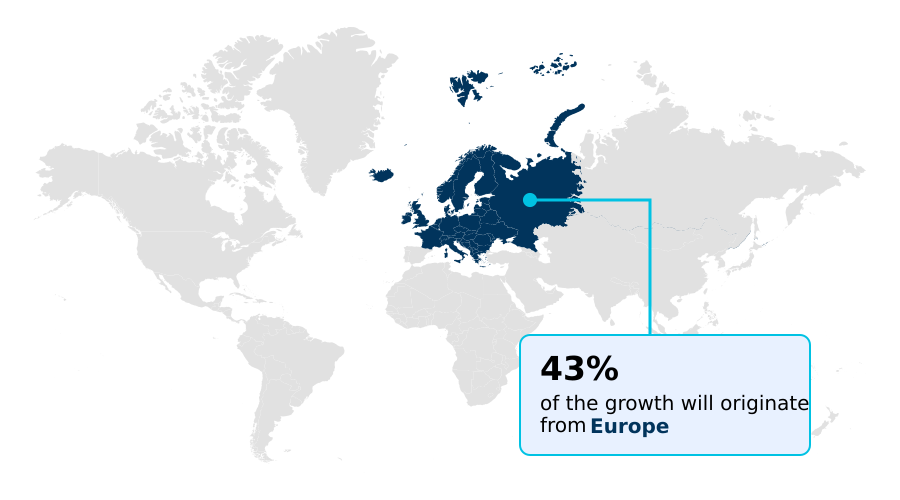
- Europe dominated the market and accounted for a 43.1% growth during the forecast period.
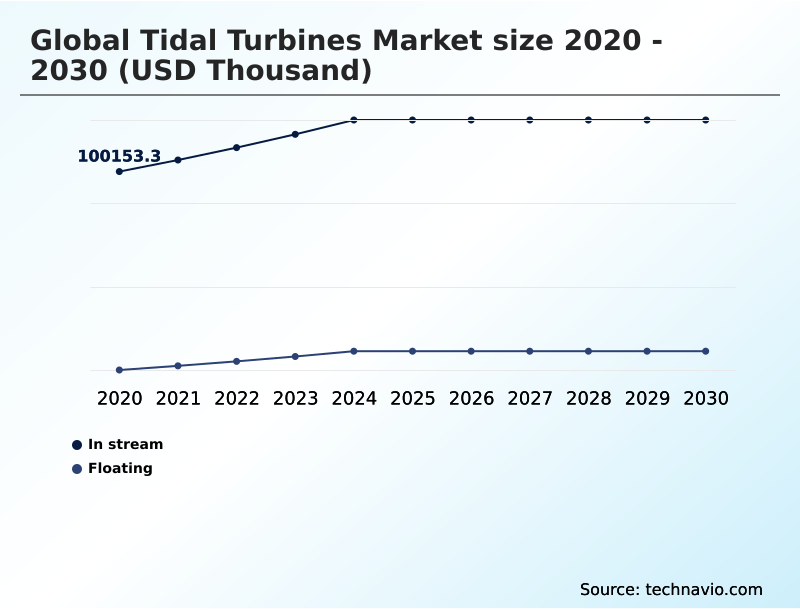
- By Type - In stream segment was valued at USD 118.55 million in 2024
- By Capacity - Large scale segment accounted for the largest market revenue share in 2024
Market Size & Forecast
- Market Opportunities:
- Market Future Opportunities: USD 49.32 million
- CAGR from 2025 to 2030 : 5.5%
Market Summary
- The tidal turbines market is advancing from a demonstration phase toward commercial deployment, driven by the global need for clean and predictable energy. Unlike intermittent renewables, tidal power offers unparalleled forecast accuracy, making it a valuable asset for grid stability.
- Technological progress in areas like multi-megawatt power ratings and the development of floating tidal platforms are key trends aimed at reducing the levelized cost of energy. A primary business application involves powering remote coastal communities and offshore industrial operations, providing a reliable alternative to costly diesel generation.
- However, significant challenges remain, including high upfront capital costs, intense competition from mature renewables like solar and wind, and the logistical complexities of operating in harsh marine environments. The industry's trajectory depends on continued innovation, supportive government policies such as contracts for difference, and successful deployment of commercial-scale tidal arrays to prove long-term economic viability and attract mainstream investment.
What will be the Size of the Tidal Turbines Market during the forecast period?
Get Key Insights on Market Forecast (PDF) Get Free Sample
How is the Tidal Turbines Market Segmented?
The tidal turbines industry research report provides comprehensive data (region-wise segment analysis), with forecasts and estimates in "USD thousand" for the period 2026-2030, as well as historical data from 2020-2024 for the following segments.
- Type
- In stream
- Floating
- Capacity
- Large scale
- Medium scale
- Small scale
- End-user
- Utility sector
- Commercial sector
- Government sector
- Others
- Geography
- Europe
- Germany
- UK
- France
- APAC
- China
- Japan
- India
- North America
- US
- Canada
- Mexico
- Middle East and Africa
- Saudi Arabia
- UAE
- South Africa
- South America
- Brazil
- Argentina
- Colombia
- Rest of World (ROW)
- Europe
By Type Insights
The in stream segment is estimated to witness significant growth during the forecast period.
The in-stream segment, characterized by seabed-mounted systems, is the most established approach in the global tidal turbines market 2026-2030.
These systems utilize gravity base structures or piled foundations to anchor turbines directly to the ocean floor, ensuring robustness against powerful hydrodynamic forces.
This stability is crucial for predictable performance and building investor confidence for tidal stream projects, which is necessary for securing a power purchase agreement. A key advantage is the minimal visual impact and non-interference with surface shipping.
However, the reliance on specialized heavy-lift vessels for installation and complex subsea intervention logistics for maintenance contribute to high expenditures.
Operational data from these deployments, showing power performance consistency, has validated performance models, with some projects demonstrating over 95% forecast accuracy for grid-balancing services.
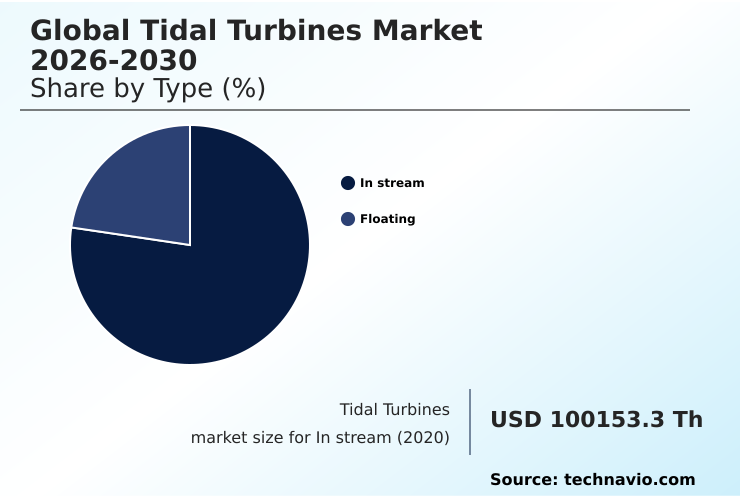
The In stream segment was valued at USD 118.55 million in 2024 and showed a gradual increase during the forecast period.
Regional Analysis
Europe is estimated to contribute 43.1% to the growth of the global market during the forecast period.Technavio’s analysts have elaborately explained the regional trends and drivers that shape the market during the forecast period.
See How Tidal Turbines Market Demand is Rising in Europe Get Free Sample
Europe, particularly the UK and France, leads the global tidal turbines market 2026-2030, benefiting from high-velocity tidal resources and strong policy support that fosters commercial-scale tidal arrays. This region accounts for 43.1% of the global market's incremental growth.
The APAC region is emerging as a significant market, driven by nations like China and South Korea focusing on energy security and leveraging their manufacturing capabilities.
North America, with prime sites in Canada's Bay of Fundy, is advancing through key demonstration projects using advanced hydrodynamic modeling. The development of a robust marine energy supply chain is critical for all regions.
The contrast is stark when compared to markets like South America, where development is in a nascent, research-driven phase, representing less than 3% of the growth opportunity due to a lack of dedicated policy for tidal resource assessment and subsea intervention logistics.
Market Dynamics
Our researchers analyzed the data with 2025 as the base year, along with the key drivers, trends, and challenges. A holistic analysis of drivers will help companies refine their marketing strategies to gain a competitive advantage.
- The future of tidal energy technology hinges on reducing the lcoe in tidal energy projects. A central debate is the floating vs seabed mounted turbine cost comparison, where floating platforms aim to lower operational expenses by simplifying maintenance.
- A key strategy for enhancing value is integrating tidal power with energy storage, transforming it into a dispatchable asset and maximizing its grid-balancing value. However, the challenges in harsh marine environments persist, demanding robust engineering and operational maintenance for subsea turbines.
- The commercial viability of tidal stream arrays depends heavily on securing financing, which is influenced by policy support for marine energy development. For niche applications, such as tidal turbines for remote community power, the technology offers a clean alternative to diesel, improving island grid stability.
- The push for multi megawatt turbine economies of scale, often utilizing direct drive generators, is critical for utility-scale success. The predictability of tidal power generation is its core advantage, but tidal turbine installation logistics remain a significant cost factor, requiring a specialized supply chain for tidal energy conversion.
- Data shows projects that integrate advanced maintenance planning reduce downtime by over 20% compared to those with reactive strategies, directly impacting financial returns and proving the business case for technological advancements in tidal turbine design.
What are the key market drivers leading to the rise in the adoption of Tidal Turbines Industry?
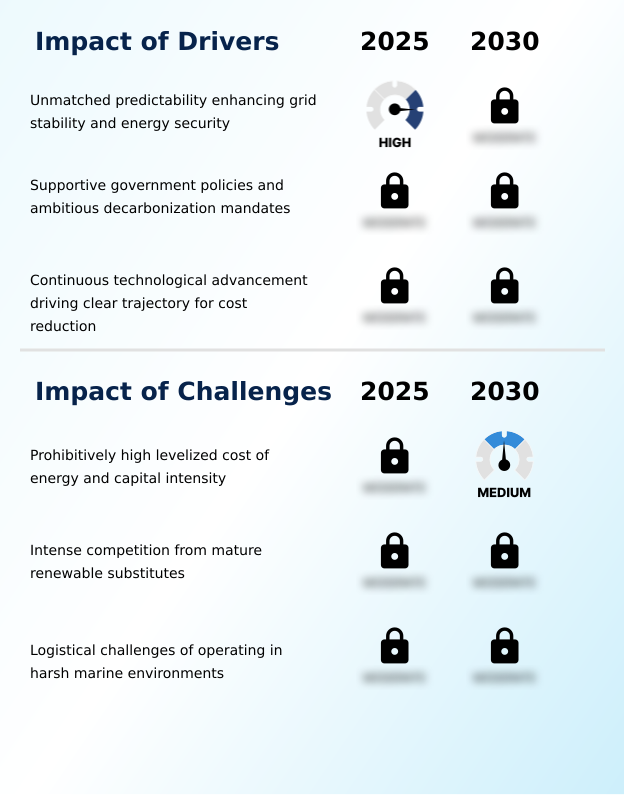
- The unmatched predictability of tidal power is a key driver, enhancing grid stability and energy security by providing a forecastable, firm renewable energy source.
- The primary driver for the global tidal turbines market 2026-2030 is its unparalleled predictability, which offers a valuable grid-balancing service that enhances energy security solutions.
- Unlike variable renewables, tidal power allows for precise energy dispatch scheduling, reducing the need for costly ancillary services from fossil fuels by over 30% in some grid simulations.
- This reliability is a powerful incentive for governments to enact supportive decarbonization mandates and policies like contracts for difference, which de-risk capital-intensive energy projects.
- Continuous technological advancement, particularly in developing firm renewable generation, provides a clear trajectory for cost reduction, building investor confidence.
- The strategic value of this predictable renewable energy source is escalating as grids integrate more intermittent power, positioning tidal energy as a critical component for future stability.
What are the market trends shaping the Tidal Turbines Industry?
- The emergence of floating tidal platforms represents a transformative trend, aiming to overcome significant cost and logistical barriers associated with first-generation, fixed-bottom designs.
- Key trends are redefining the global tidal turbines market 2026-2030, with a strategic shift toward floating tidal platforms designed to simplify subsea intervention logistics and reduce reliance on specialized heavy-lift vessels. This innovation, coupled with the upscaling to multi-megawatt power ratings, is critical for achieving economies of scale.
- Firms are reporting that towable anchoring systems can cut installation costs by up to 40%. The growing emphasis on offshore wind hybridization and battery energy storage integration creates a more valuable grid asset, with integrated systems demonstrating a 24/7 power availability profile, a significant improvement over standalone intermittent sources.
- This evolution underscores the industry's focus on solving core economic challenges to unlock the full potential of high-velocity tidal resources and expand the marine energy supply chain.
What challenges does the Tidal Turbines Industry face during its growth?
- The prohibitively high levelized cost of energy and significant capital intensity present a key challenge to the industry's growth and widespread commercialization.
- The global tidal turbines market 2026-2030 faces significant hurdles, primarily the high levelized cost of energy and intense competition from mature renewables. The technology's capital intensity, driven by the need for robust subsea export cables and bespoke manufacturing, makes securing a power purchase agreement difficult without substantial subsidies.
- Logistical challenges in harsh marine environments, requiring specialized heavy-lift vessels and navigating complex regulatory and permitting processes, further inflate costs. Operational data shows that unscheduled maintenance can increase project costs by 15-20% over its lifecycle.
- Overcoming these challenges requires not only technological innovation in areas like horizontal-axis tidal turbines and power conversion electronics but also policies that properly value the grid stability enhancement provided by this predictable power source.
Exclusive Technavio Analysis on Customer Landscape
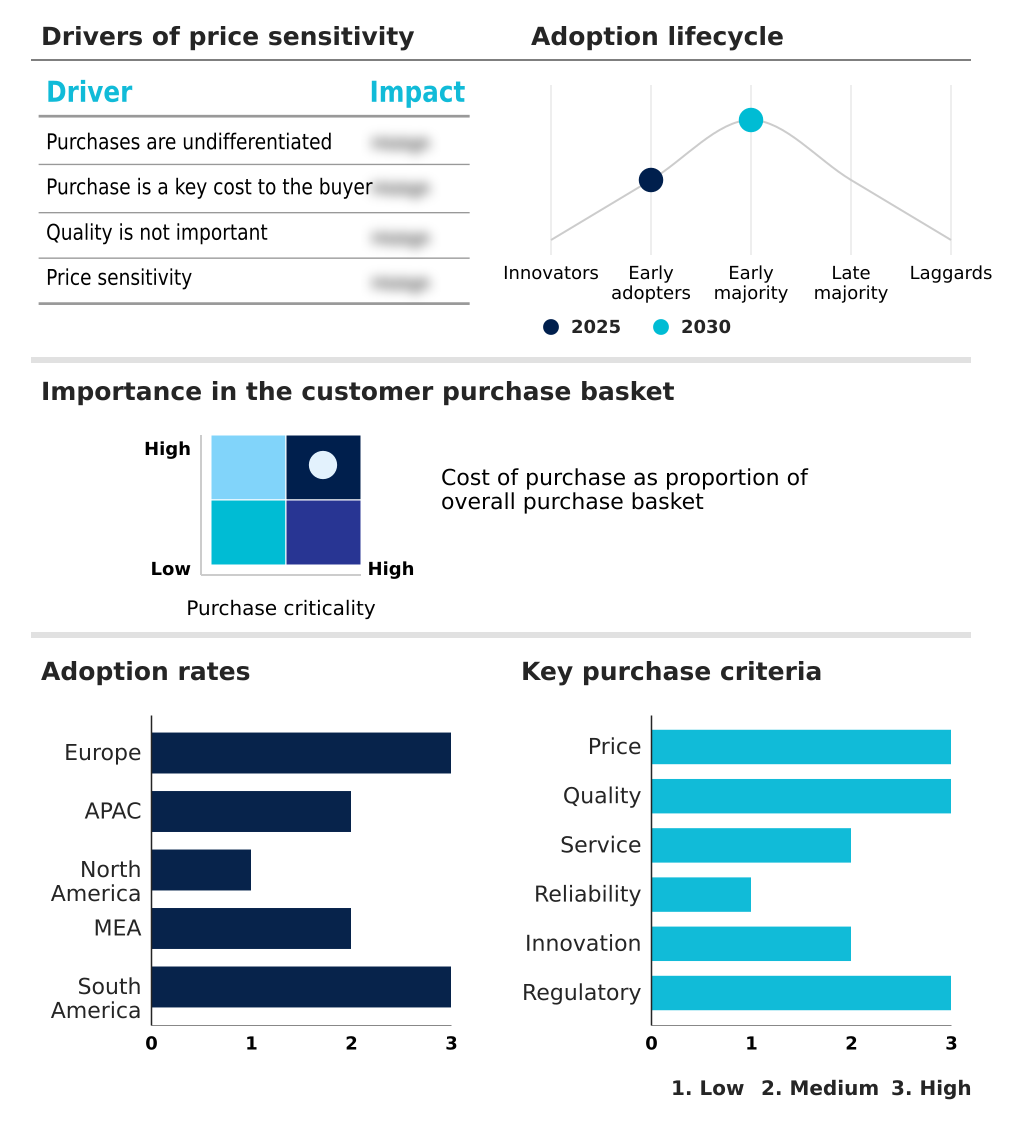
The tidal turbines market forecasting report includes the adoption lifecycle of the market, covering from the innovator’s stage to the laggard’s stage. It focuses on adoption rates in different regions based on penetration. Furthermore, the tidal turbines market report also includes key purchase criteria and drivers of price sensitivity to help companies evaluate and develop their market growth analysis strategies.
Customer Landscape of Tidal Turbines Industry
Competitive Landscape
Companies are implementing various strategies, such as strategic alliances, tidal turbines market forecast, partnerships, mergers and acquisitions, geographical expansion, and product/service launches, to enhance their presence in the industry.
Andritz AG - Key offerings include advanced hydrokinetic devices for utility-scale power, engineered for high predictability to enhance grid stability and deliver reliable, clean energy from oceanic tides.
The industry research and growth report includes detailed analyses of the competitive landscape of the market and information about key companies, including:
- Andritz AG
- Aquantis Inc
- Guinard Energies Nouvelles
- Hyundai Heavy Industries Group
- Instream Energy Systems Corp.
- Jupiter Hydro Inc
- Lockheed Martin Corp.
- MAKO ENERGY
- Oceana Energy Co.
- OpenHydro Group Ltd
- Orbital Marine Power Ltd
- SABELLA SA
- SAS HYDROQUEST
- Simec Atlantis Energy Ltd.
- TOCARDO BV
- TPGen24
Qualitative and quantitative analysis of companies has been conducted to help clients understand the wider business environment as well as the strengths and weaknesses of key industry players. Data is qualitatively analyzed to categorize companies as pure play, category-focused, industry-focused, and diversified; it is quantitatively analyzed to categorize companies as dominant, leading, strong, tentative, and weak.
Recent Development and News in Tidal turbines market
- In September 2024, Simec Atlantis Energy Ltd. announced it awarded a major contract to Andritz AG for the manufacturing and supply of three next-generation 1.5-megawatt seabed-mounted tidal turbines for the next phase of the MeyGen tidal array.
- In October 2024, Kyuden Mirai Energy successfully concluded a year-long, grid-connected demonstration of a 500-kilowatt tidal stream turbine in the Naru Strait, Japan, providing critical operational data and proving technology resilience in typhoon-prone waters.
- In February 2025, Orbital Marine Power Ltd. received governmental approval for its first North American project, a 9-megawatt floating tidal energy array in the Bay of Fundy, Canada, marking a significant international expansion for the floating turbine pioneer.
- In April 2025, Hyundai Heavy Industries Group entered a strategic partnership with a major APAC utility to co-develop a 10-megawatt tidal array, aiming to leverage its direct-drive turbine technology for commercial-scale deployment in the region.
Dive into Technavio’s robust research methodology, blending expert interviews, extensive data synthesis, and validated models for unparalleled Tidal Turbines Market insights. See full methodology.
| Market Scope | |
|---|---|
| Page number | 291 |
| Base year | 2025 |
| Historic period | 2020-2024 |
| Forecast period | 2026-2030 |
| Growth momentum & CAGR | Accelerate at a CAGR of 5.5% |
| Market growth 2026-2030 | USD 49318.6 thousand |
| Market structure | Fragmented |
| YoY growth 2025-2026(%) | 5.1% |
| Key countries | Germany, UK, France, Italy, Spain, The Netherlands, China, Japan, India, South Korea, Australia, Indonesia, US, Canada, Mexico, Saudi Arabia, UAE, South Africa, Israel, Turkey, Brazil, Argentina and Colombia |
| Competitive landscape | Leading Companies, Market Positioning of Companies, Competitive Strategies, and Industry Risks |
Research Analyst Overview
- The tidal turbines market is at a pivotal point where boardroom decisions are increasingly focused on long-term asset reliability and the value of predictable energy. The industry's evolution is marked by a shift towards multi-megawatt power ratings and the adoption of technologies like direct-drive permanent magnet generators to enhance durability.
- Innovations such as floating tidal platforms and tow-to-port maintenance strategies are direct responses to the high costs of subsea export cables and gravity base structures. For project developers, securing a power purchase agreement or benefiting from mechanisms like contracts for difference is essential for financial viability.
- A key decision area is budgeting for the high costs of environmental impact assessments and navigating complex permitting for tidal stream projects.
- Companies that leverage advanced hydrodynamic modeling and power conversion electronics demonstrate a significant advantage, with some achieving a 10% lower levelized cost of energy compared to earlier projects, directly influencing investment in hydrokinetic energy systems and tidal resource assessment.
What are the Key Data Covered in this Tidal Turbines Market Research and Growth Report?
-
What is the expected growth of the Tidal Turbines Market between 2026 and 2030?
-
USD 49.32 million, at a CAGR of 5.5%
-
-
What segmentation does the market report cover?
-
The report is segmented by Type (In stream, and Floating), Capacity (Large scale, Medium scale, and Small scale), End-user (Utility sector, Commercial sector, Government sector, and Others) and Geography (Europe, APAC, North America, Middle East and Africa, South America)
-
-
Which regions are analyzed in the report?
-
Europe, APAC, North America, Middle East and Africa and South America
-
-
What are the key growth drivers and market challenges?
-
Unmatched predictability enhancing grid stability and energy security, Prohibitively high levelized cost of energy and capital intensity
-
-
Who are the major players in the Tidal Turbines Market?
-
Andritz AG, Aquantis Inc, Guinard Energies Nouvelles, Hyundai Heavy Industries Group, Instream Energy Systems Corp., Jupiter Hydro Inc, Lockheed Martin Corp., MAKO ENERGY, Oceana Energy Co., OpenHydro Group Ltd, Orbital Marine Power Ltd, SABELLA SA, SAS HYDROQUEST, Simec Atlantis Energy Ltd., TOCARDO BV and TPGen24
-
Market Research Insights
- The tidal turbines market is shaped by a dynamic interplay between technological innovation and economic imperatives. A key focus is on achieving commercial-scale tidal arrays through strategies like offshore wind hybridization, which reduces infrastructure costs by over 25% by sharing grid connections.
- The integration with battery energy storage integration is another critical development, creating firm renewable generation capable of energy dispatch scheduling, enhancing its value to grid operators. Progress is evident in the development of a specialized marine energy supply chain and the use of advanced hydrodynamic modeling.
- These advancements are crucial for de-risking capital-intensive energy projects and attracting investment, especially as firms demonstrate a 15% improvement in energy conversion efficiency with next-generation designs, paving the way for wider deployment in high-velocity tidal resources.
We can help! Our analysts can customize this tidal turbines market research report to meet your requirements.
 RIA -
RIA - 
