Transparent Digital Signage Market Analysis North America, APAC, Europe, South America, Middle East and Africa - US, China, Canada, Germany, UK - Size and Forecast 2024-2028

Transparent Digital Signage Market Analysis North America, APAC, Europe, South America, Middle East and Africa - US, China, Canada, Germany, UK - Size and Forecast 2024-2028

Published: May 2024 171 Pages SKU: IRTNTR70560

Market Overview at a Glance

$23.70 B
Market Opportunity
47.74%
CAGR
34.78
YoY growth 2023-2024(%)

Transparent Digital Signage Market Size 2024-2028

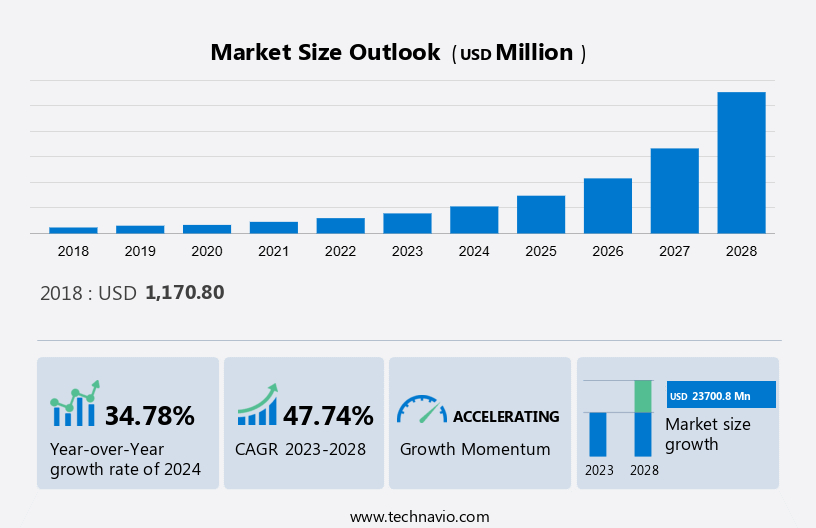
The transparent digital signage market size is forecast to increase by USD 23.70 billion, at a CAGR of 47.74% between 2023 and 2028. The expansion of the market is contingent upon several factors, notably the rising demand for digital signage and digital-out-of-home (DOOH) solutions. With an increasing preference for energy-efficient and do-it-yourself (DIY) designs, low power consumption and DIY capabilities are becoming key drivers of market growth. Additionally, the market benefits from the escalating demand for high-resolution and interactive content, catering to evolving consumer preferences for engaging visual experiences. These factors collectively contribute to the burgeoning growth and adoption of digital signage solutions across various sectors, including retail, hospitality, transportation, and advertising. As businesses seek to enhance their brand presence and communication strategies, the demand for versatile and innovative digital signage solutions is expected to continue driving market expansion in the foreseeable future.

What will be the Size of the Market During the Forecast Period?

Transparent Digital Signage Market Size

To learn more about this report, View Report Sample

Market Dynamic and Customer Landscape

The market is driven by various factors, including the increasing demand for innovative technologies in communications equipment and consumer electronics. Display designers are incorporating transparent digital signage into various sectors like retail, automotive, and healthcare, leveraging its ability to blend seamlessly into surroundings. With advancements in technology hardware and electronic components, transparent digital signage offers minimal power consumption, making it suitable for mobile devices and wearable computers. However, challenges such as manufacturing costs and the complexity of electronic circuits hinder market growth. Advertisement companies are exploring immersive advertising experiences, while the military and aerospace sectors are leveraging it for HUDs and HMDs. Overall, the market is witnessing a trend towards adoption across diverse industries, despite challenges in manufacturing and implementation costs. Our researchers analyzed the market research and growth data with 2023 as the base year, along with the key drivers, trends, and challenges. A holistic analysis of drivers will help companies refine their marketing strategies to gain a competitive advantage.

Key Market Driver

The demand for high-resolution and interactive content is notably driving market growth. Vendors are designing industry-specific products to cater to the requirements of enterprises. For instance, Nike Inc. used MMT GmbH & Co. KG.'s transparent display solution called HYPEBOX. HYPEBOX enables visitors to see products inside the box through an interactive transparent screen feature. Designed for retail stores, the product has low operating costs and power consumption. Also, it is easy to use. The demand for high-resolution, interactive transparent digital signage is expected to grow during the forecast period as it offers entertainment content through a touchscreen, provides product information while engaging the customer, and has low operating costs and easy-to-use features.

Moreover, data analytics platforms aid enterprises in using digital signage solutions, such as audience measurement solutions, to track customer interaction data through touchscreens. Data analytics enables enterprises to understand the targeted customer based on the data collected. Such factors will influence the demand during the forecast period.

Significant Market Trends

The emergence of transparent organic light-emitting devices (OLEDs) is the key trend in the market. OLEDs have significant benefits compared with LEDs and LCDs. The company's products are integrating OLEDs in their products to offer enhanced features to customers. The major benefits of OLEDs include lightweight, better picture quality, high power efficiency, and better response time than LEDs and LCDs.

Furthermore, OLEDs have a self-emitting transparent display and do not require a background light. OLEDs can have plastic substrates instead of glass. Furthermore, the substrate of OLEDs is not rigid because of its lighter layers. The demand for OLEDs is expected to increase significantly during the forecast period, and vendors will launch newproducts based on OLEDs. Vendors have started introducing OLED-enabled transparent digital signage displays recently.

Major Market Challenge

Cyberattacks on digital signage networks is the major challenge impeding market growth. The e-commerce market has grown substantially during the past few years, and this has impacted local retail stores throughout the world. E-commerce giants such as Amazon, Alibaba, and eBay are expanding their operations worldwide. The growing popularity of e-commerce platforms is having a significant impact on local retail vendors' revenue. Therefore, the growth of the e-commerce market can limit enterprises spending on transparent digital signage products during the forecast period, considering the relatively higher price of transparent digital signage products. 

Furthermore, the increase in the number of internet users and the pay-per-click advertising model adopted by online giants such as Google LLC are attracting enterprises to adopt online advertising models. Therefore, the growth of e-commerce platforms and online advertising models can be a hindrance to products during the forecast period.

Customer Landscape

The market forecasting report includes the adoption lifecycle of the market, covering from the innovator’s stage to the laggard’s stage. It focuses on adoption rates in different regions based on penetration. Furthermore, the report also includes key purchase criteria and drivers of price sensitivity to help companies evaluate and develop their market growth and forecasting strategies.

Transparent Digital Signage Market Share by Geography

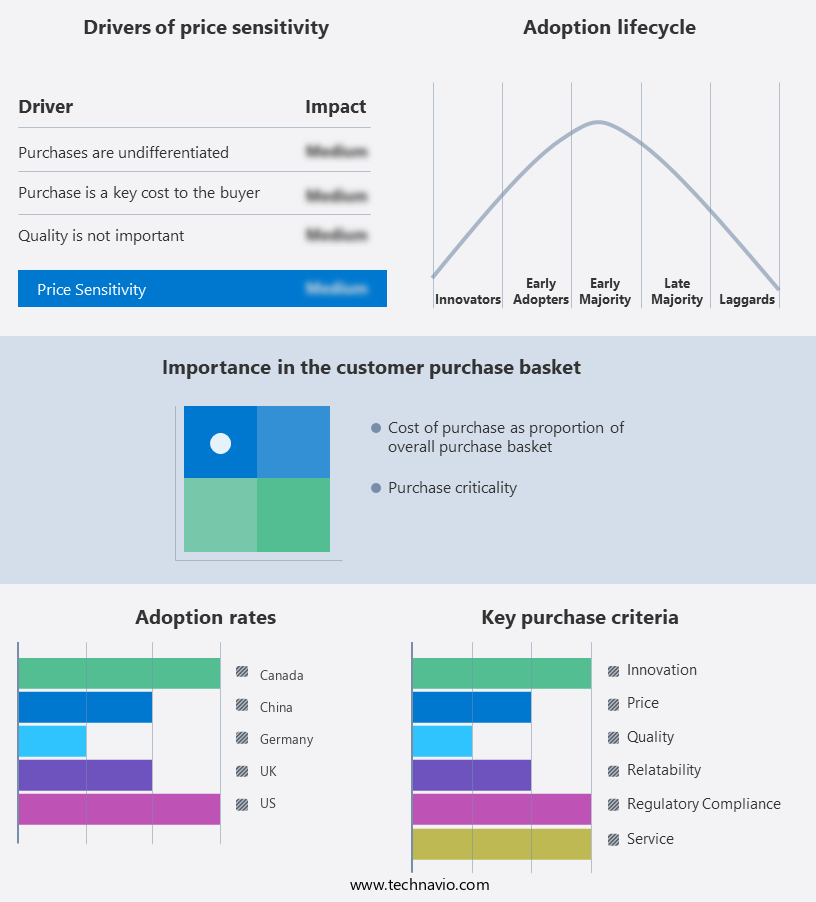
Market Customer Landscape

Key Companies & Market Insights

Companies are implementing various strategies, such as strategic alliances, partnerships, mergers and acquisitions, geographical expansion, and product/service launches, to enhance their presence in the market.

Shenzhen AuroLED Technology Co. Ltd. - The company offers digital signage such as outdoor transparent LED displays, indoor transparent LED displays, and creative transparent LED displays. The company offers indoor transparent LED displays, outdoor transparent LED displays, and creative LED displays.

The research report also includes detailed analyses of the competitive landscape of the market and information about 12 market companies, including:

  • AUO Corp.
  • Barco NV
  • Leyard Group
  • LG Corp.
  • Panasonic Holdings Corp.
  • PixelFLEX LLC
  • Pro Display
  • Samsung Electronics Co. Ltd.
  • Shenzhen Huake Light Electronics Co. Ltd.
  • SHENZHEN NEXNOVO TECHNOLOGY Co. Ltd.
  • Sony Group Corp.

Qualitative and quantitative analysis of companies has been conducted to help clients understand the wider business environment as well as the strengths and weaknesses of key market players. Data is qualitatively analyzed to categorize companies as pure play, category-focused, industry-focused, and diversified; it is quantitatively analyzed to categorize companies as dominant, leading, strong, tentative, and weak.

Market Segmentation 

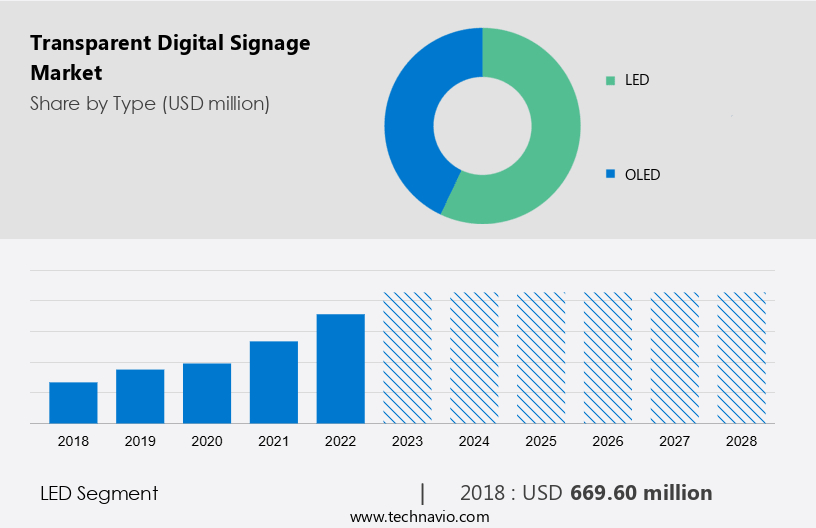
The LED segment is estimated to witness significant growth during the forecast period. The transparent LED modular displays come in a variety of module sizes that can be combined to achieve nearly any size needed. From displaying product features to colourful graphics, transparent LED screens are highly effective in enhancing the brand image in the retail industry.

Transparent Digital Signage Market Size

Get a glance at the market contribution of various segments View the PDF Sample

The LED segment was valued at USD 669.60 million in 2018The market's growth is attributed to an increase in high demand for transparent digital signage solutions. The demand for such products is expected to increase during the forecast period as most enterprises are adopting new technologies such as AR to enhance the customer experience. Furthermore, digital signage providers in North America have been successful in introducing new digital signage solutions. These factors are expected to drive the growth of the LED segment of the market during the forecast period.

Regional Analysis

Transparent Digital Signage Market Share by Geography

For more insights on the market share of various regions Download PDF Sample now!

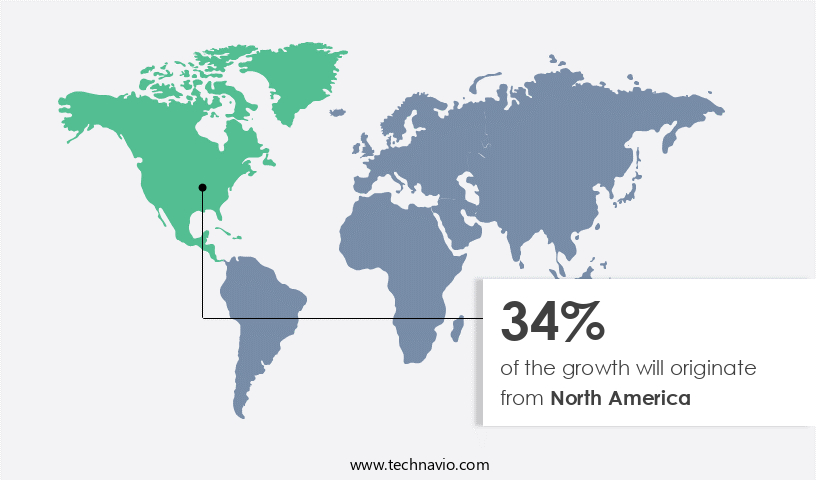
North America is estimated to contribute 34% to the growth of the global market during the forecast period. Technavio’s analysts have elaborately explained the regional trends and drivers that shape the market during the forecast period. The market in North America has been primarily driven by the high demand for transparent digital signage solutions. Enterprises across industries are implementing digital signage solutions to attract customers, increase customer engagement, and derive actionable insights based on audience measurement.

Also, enterprises in North America are looking for high-picture-quality digital signage displays and trying to provide a unique experience to their customers. Digital signage solution providers are introducing new products to cater to this demand from enterprises. The demand for transparent digital signage products is expected to increase during the forecast period as most enterprises are adopting new technologies such as AR to enhance the customer experience. 

Segment Overview

The market research report provides comprehensive data (region wise segment analysis), with forecasts and estimates in "USD Million" for the period 2024-2028, as well as historical data from 2018 - 2022 for the following segments.

  • Type Outlook 
    • LED
    • OLED
  • End-user Outlook 
    • Retail
    • Automotive
    • Media and entertainment
  • Region Outlook  
    • North America
      • The U.S.
      • Canada
    • South America
      • Argentina
      • Chile
      • Brazil
    • Europe
      • The U.K.
      • Germany
      • France
      • Rest of Europe
    • APAC
      • China
      • India
    • Middle East & Africa
      • Saudi Arabia
      • South Africa
      • Rest of the Middle East & Africa

You may also interested in below market reports:

  • Display for Retail Applications MarketDisplay for Retail Applications Market Analysis Asia, Australia : US, China, Japan, India, Germany - Size and Forecast
  • Smart Led Indoor Signage Market - Smart Led Indoor Signage Market by End-user, Screen Size and Geography - Forecast and Analysis
  • LED Display Market - LED Display Market Analysis APAC, North America, Europe, South America, Middle East and Africa - US, China, Japan, South Korea, Germany - Size and Forecast

Market Analyst Overview

The market is witnessing rapid growth driven by advancements in industrial electronics and the increasing affordability of transparent displays. With the adoption of 3D displays and gaze tracking technology like Google Glass, transparent digital signage finds applications in diverse sectors such as retail, automotive, and the military. Nanoparticles and specialized materials enable advanced products with enhanced content visibility and resolution. However, security concerns persist, necessitating awareness and education initiatives. Flexible and touchless solutions, coupled with 5G technology and the Internet of Things, are revolutionizing home monitoring and transportation sectors. As the market evolves, the adoption of transparent digital signage is expected to surge, propelled by innovations in LED technology, LCD technology, and OLED display technologies.

Additionally, the market is influenced by various factors, including manufacturing costs and demands from key sectors like retail, automotive, and the military. With advancements like backlight elimination and ultra HD digital displays, transparent digital signage offers enhanced resolution and visibility across different signage and broadcast content categories. Innovations in biometric technology and artificial intelligence facilitate remote access and personalized experiences. Machine learning algorithms optimize content delivery, while 3PL solutions streamline logistics in the transportation sector. From LED to OLED displays, transparent digital signage caters to diverse resolution and signage size segments. Moreover, applications such as leak detection and forex card transactions underscore its versatility, driving continued growth and adoption in various industries.

Market Scope

Report Coverage

Details

Page number

171

Base year

2023

Historic period

2018-2022

Forecast period

2024-2028

Growth momentum & CAGR

Accelerate at a CAGR of 47.74%

Market Growth 2024-2028

USD 23.70 billion

Market structure

Concentrated

YoY growth 2023-2024(%)

34.78

Regional analysis

North America, APAC, Europe, South America, and Middle East and Africa

Performing market contribution

North America at 34%

Key countries

US, China, Canada, Germany, and UK

Competitive landscape

Leading Companies, Market Positioning of Companies, Competitive Strategies, and Industry Risks

Key companies profiled

AUO Corp., Barco NV, Leyard Group, LG Corp., Panasonic Holdings Corp., PixelFLEX LLC, Pro Display, Samsung Electronics Co. Ltd., Shenzhen AuroLED Technology Co. Ltd., Shenzhen Huake Light Electronics Co. Ltd., SHENZHEN NEXNOVO TECHNOLOGY Co. Ltd., and Sony Group Corp.

Market dynamics

Parent market growth analysis, Market forecast, Market growth inducers and obstacles, Fast-growing and slow-growing segment analysis, COVID-19 impact and recovery analysis and future consumer dynamics, Market condition analysis for forecast period

Customization purview

If our market report has not included the data that you are looking for, you can reach out to our analysts and get segments customized.

View PDF Sample

What are the Key Data Covered in this Market Research and Growth Report?

  • CAGR of the market report during the forecast period
  • Detailed information of market analysis and report on factors that will drive the growth of the market between 2024 and 2028
  • Precise estimation of the size of the market and its contribution in focus to the parent market
  • Accurate predictions about upcoming trends and changes in consumer behavior
  • Growth of the market across North America, APAC, Europe, South America, and Middle East and Africa
  • Thorough analysis of the market’s competitive landscape and detailed information about companies
  • Comprehensive analysis of factors that will challenge the growth of market companies

We can help! Our analysts can customize this market research report to meet your requirements. 

Get in touch

1 Executive Summary

  • 1.1 Market overview
    • Executive Summary - Chart on Market Overview
    • Executive Summary - Data Table on Market Overview
    • Executive Summary - Chart on Global Market Characteristics
    • Executive Summary - Chart on Market by Geography
    • Executive Summary - Chart on Market Segmentation by Type
    • Executive Summary - Chart on Market Segmentation by End-user
    • Executive Summary - Chart on Incremental Growth
    • Executive Summary - Data Table on Incremental Growth
    • Executive Summary - Chart on Company Market Positioning

2 Market Landscape

  • 2.1 Market ecosystem
    • Parent Market
    • Data Table on - Parent Market
  • 2.2 Market characteristics
    • Market characteristics analysis
  • 2.3 Value chain analysis
    • Value Chain Analysis

3 Market Sizing

  • 3.1 Market definition
    • Offerings of companies included in the market definition
  • 3.2 Market segment analysis
    • Market segments
  • 3.3 Market size 2023
    • 3.4 Market outlook: Forecast for 2023-2028
      • Chart on Global - Market size and forecast 2023-2028 ($ million)
      • Data Table on Global - Market size and forecast 2023-2028 ($ million)
      • Chart on Global Market: Year-over-year growth 2023-2028 (%)
      • Data Table on Global Market: Year-over-year growth 2023-2028 (%)

    4 Historic Market Size

    • 4.1 Global Transparent Digital Signage Market 2018 - 2022
      • Historic Market Size - Data Table on Global Transparent Digital Signage Market 2018 - 2022 ($ million)
    • 4.2 Type segment analysis 2018 - 2022
      • Historic Market Size - Type Segment 2018 - 2022 ($ million)
    • 4.3 End-user segment analysis 2018 - 2022
      • Historic Market Size - End-user Segment 2018 - 2022 ($ million)
    • 4.4 Geography segment analysis 2018 - 2022
      • Historic Market Size - Geography Segment 2018 - 2022 ($ million)
    • 4.5 Country segment analysis 2018 - 2022
      • Historic Market Size - Country Segment 2018 - 2022 ($ million)

    5 Five Forces Analysis

    • 5.1 Five forces summary
      • Five forces analysis - Comparison between 2023 and 2028
    • 5.2 Bargaining power of buyers
      • Bargaining power of buyers - Impact of key factors 2023 and 2028
    • 5.3 Bargaining power of suppliers
      • Bargaining power of suppliers - Impact of key factors in 2023 and 2028
    • 5.4 Threat of new entrants
      • Threat of new entrants - Impact of key factors in 2023 and 2028
    • 5.5 Threat of substitutes
      • Threat of substitutes - Impact of key factors in 2023 and 2028
    • 5.6 Threat of rivalry
      • Threat of rivalry - Impact of key factors in 2023 and 2028
    • 5.7 Market condition
      • Chart on Market condition - Five forces 2023 and 2028

    6 Market Segmentation by Type

    • 6.1 Market segments
      • Chart on Type - Market share 2023-2028 (%)
      • Data Table on Type - Market share 2023-2028 (%)
    • 6.2 Comparison by Type
      • Chart on Comparison by Type
      • Data Table on Comparison by Type
    • 6.3 LED - Market size and forecast 2023-2028
      • Chart on LED - Market size and forecast 2023-2028 ($ million)
      • Data Table on LED - Market size and forecast 2023-2028 ($ million)
      • Chart on LED - Year-over-year growth 2023-2028 (%)
      • Data Table on LED - Year-over-year growth 2023-2028 (%)
    • 6.4 OLED - Market size and forecast 2023-2028
      • Chart on OLED - Market size and forecast 2023-2028 ($ million)
      • Data Table on OLED - Market size and forecast 2023-2028 ($ million)
      • Chart on OLED - Year-over-year growth 2023-2028 (%)
      • Data Table on OLED - Year-over-year growth 2023-2028 (%)
    • 6.5 Market opportunity by Type
      • Market opportunity by Type ($ million)
      • Data Table on Market opportunity by Type ($ million)

    7 Market Segmentation by End-user

    • 7.1 Market segments
      • Chart on End-user - Market share 2023-2028 (%)
      • Data Table on End-user - Market share 2023-2028 (%)
    • 7.2 Comparison by End-user
      • Chart on Comparison by End-user
      • Data Table on Comparison by End-user
    • 7.3 Retail - Market size and forecast 2023-2028
      • Chart on Retail - Market size and forecast 2023-2028 ($ million)
      • Data Table on Retail - Market size and forecast 2023-2028 ($ million)
      • Chart on Retail - Year-over-year growth 2023-2028 (%)
      • Data Table on Retail - Year-over-year growth 2023-2028 (%)
    • 7.4 Automotive - Market size and forecast 2023-2028
      • Chart on Automotive - Market size and forecast 2023-2028 ($ million)
      • Data Table on Automotive - Market size and forecast 2023-2028 ($ million)
      • Chart on Automotive - Year-over-year growth 2023-2028 (%)
      • Data Table on Automotive - Year-over-year growth 2023-2028 (%)
    • 7.5 Media and Entertainment - Market size and forecast 2023-2028
      • Chart on Media and Entertainment - Market size and forecast 2023-2028 ($ million)
      • Data Table on Media and Entertainment - Market size and forecast 2023-2028 ($ million)
      • Chart on Media and Entertainment - Year-over-year growth 2023-2028 (%)
      • Data Table on Media and Entertainment - Year-over-year growth 2023-2028 (%)
    • 7.6 Market opportunity by End-user
      • Market opportunity by End-user ($ million)
      • Data Table on Market opportunity by End-user ($ million)

    8 Customer Landscape

    • 8.1 Customer landscape overview
      • Analysis of price sensitivity, lifecycle, customer purchase basket, adoption rates, and purchase criteria

    9 Geographic Landscape

    • 9.1 Geographic segmentation
      • Chart on Market share by geography 2023-2028 (%)
      • Data Table on Market share by geography 2023-2028 (%)
    • 9.2 Geographic comparison
      • Chart on Geographic comparison
      • Data Table on Geographic comparison
    • 9.3 North America - Market size and forecast 2023-2028
      • Chart on North America - Market size and forecast 2023-2028 ($ million)
      • Data Table on North America - Market size and forecast 2023-2028 ($ million)
      • Chart on North America - Year-over-year growth 2023-2028 (%)
      • Data Table on North America - Year-over-year growth 2023-2028 (%)
    • 9.4 APAC - Market size and forecast 2023-2028
      • Chart on APAC - Market size and forecast 2023-2028 ($ million)
      • Data Table on APAC - Market size and forecast 2023-2028 ($ million)
      • Chart on APAC - Year-over-year growth 2023-2028 (%)
      • Data Table on APAC - Year-over-year growth 2023-2028 (%)
    • 9.5 Europe - Market size and forecast 2023-2028
      • Chart on Europe - Market size and forecast 2023-2028 ($ million)
      • Data Table on Europe - Market size and forecast 2023-2028 ($ million)
      • Chart on Europe - Year-over-year growth 2023-2028 (%)
      • Data Table on Europe - Year-over-year growth 2023-2028 (%)
    • 9.6 South America - Market size and forecast 2023-2028
      • Chart on South America - Market size and forecast 2023-2028 ($ million)
      • Data Table on South America - Market size and forecast 2023-2028 ($ million)
      • Chart on South America - Year-over-year growth 2023-2028 (%)
      • Data Table on South America - Year-over-year growth 2023-2028 (%)
    • 9.7 Middle East and Africa - Market size and forecast 2023-2028
      • Chart on Middle East and Africa - Market size and forecast 2023-2028 ($ million)
      • Data Table on Middle East and Africa - Market size and forecast 2023-2028 ($ million)
      • Chart on Middle East and Africa - Year-over-year growth 2023-2028 (%)
      • Data Table on Middle East and Africa - Year-over-year growth 2023-2028 (%)
    • 9.8 US - Market size and forecast 2023-2028
      • Chart on US - Market size and forecast 2023-2028 ($ million)
      • Data Table on US - Market size and forecast 2023-2028 ($ million)
      • Chart on US - Year-over-year growth 2023-2028 (%)
      • Data Table on US - Year-over-year growth 2023-2028 (%)
    • 9.9 China - Market size and forecast 2023-2028
      • Chart on China - Market size and forecast 2023-2028 ($ million)
      • Data Table on China - Market size and forecast 2023-2028 ($ million)
      • Chart on China - Year-over-year growth 2023-2028 (%)
      • Data Table on China - Year-over-year growth 2023-2028 (%)
    • 9.10 Canada - Market size and forecast 2023-2028
      • Chart on Canada - Market size and forecast 2023-2028 ($ million)
      • Data Table on Canada - Market size and forecast 2023-2028 ($ million)
      • Chart on Canada - Year-over-year growth 2023-2028 (%)
      • Data Table on Canada - Year-over-year growth 2023-2028 (%)
    • 9.11 Germany - Market size and forecast 2023-2028
      • Chart on Germany - Market size and forecast 2023-2028 ($ million)
      • Data Table on Germany - Market size and forecast 2023-2028 ($ million)
      • Chart on Germany - Year-over-year growth 2023-2028 (%)
      • Data Table on Germany - Year-over-year growth 2023-2028 (%)
    • 9.12 UK - Market size and forecast 2023-2028
      • Chart on UK - Market size and forecast 2023-2028 ($ million)
      • Data Table on UK - Market size and forecast 2023-2028 ($ million)
      • Chart on UK - Year-over-year growth 2023-2028 (%)
      • Data Table on UK - Year-over-year growth 2023-2028 (%)
    • 9.13 Market opportunity by geography
      • Market opportunity by geography ($ million)
      • Data Tables on Market opportunity by geography ($ million)

    10 Drivers, Challenges, and Opportunity/Restraints

    • 10.1 Market drivers
      • 10.2 Market challenges
        • 10.3 Impact of drivers and challenges
          • Impact of drivers and challenges in 2023 and 2028
        • 10.4 Market opportunities/restraints

          11 Competitive Landscape

          • 11.1 Overview
            • 11.2 Competitive Landscape
              • Overview on criticality of inputs and factors of differentiation
            • 11.3 Landscape disruption
              • Overview on factors of disruption
            • 11.4 Industry risks
              • Impact of key risks on business

            12 Competitive Analysis

            • 12.1 Companies profiled
              • Companies covered
            • 12.2 Market positioning of companies
              • Matrix on companies position and classification
            • 12.3 AUO Corp.
              • AUO Corp. - Overview
              • AUO Corp. - Business segments
              • AUO Corp. - Key news
              • AUO Corp. - Key offerings
              • AUO Corp. - Segment focus
            • 12.4 Barco NV
              • Barco NV - Overview
              • Barco NV - Business segments
              • Barco NV - Key news
              • Barco NV - Key offerings
              • Barco NV - Segment focus
            • 12.5 Leyard Group
              • Leyard Group - Overview
              • Leyard Group - Product / Service
              • Leyard Group - Key offerings
            • 12.6 LG Corp.
              • LG Corp. - Overview
              • LG Corp. - Business segments
              • LG Corp. - Key news
              • LG Corp. - Key offerings
              • LG Corp. - Segment focus
            • 12.7 Panasonic Holdings Corp.
              • Panasonic Holdings Corp. - Overview
              • Panasonic Holdings Corp. - Product / Service
              • Panasonic Holdings Corp. - Key news
              • Panasonic Holdings Corp. - Key offerings
            • 12.8 PixelFLEX LLC
              • PixelFLEX LLC - Overview
              • PixelFLEX LLC - Product / Service
              • PixelFLEX LLC - Key offerings
            • 12.9 Pro Display
              • Pro Display - Overview
              • Pro Display - Product / Service
              • Pro Display - Key offerings
            • 12.10 Samsung Electronics Co. Ltd.
              • Samsung Electronics Co. Ltd. - Overview
              • Samsung Electronics Co. Ltd. - Business segments
              • Samsung Electronics Co. Ltd. - Key news
              • Samsung Electronics Co. Ltd. - Key offerings
              • Samsung Electronics Co. Ltd. - Segment focus
            • 12.11 Shenzhen AuroLED Technology Co. Ltd.
              • Shenzhen AuroLED Technology Co. Ltd. - Overview
              • Shenzhen AuroLED Technology Co. Ltd. - Product / Service
              • Shenzhen AuroLED Technology Co. Ltd. - Key offerings
            • 12.12 Shenzhen Huake Light Electronics Co. Ltd.
              • Shenzhen Huake Light Electronics Co. Ltd. - Overview
              • Shenzhen Huake Light Electronics Co. Ltd. - Product / Service
              • Shenzhen Huake Light Electronics Co. Ltd. - Key offerings
            • 12.13 SHENZHEN NEXNOVO TECHNOLOGY Co. Ltd.
              • SHENZHEN NEXNOVO TECHNOLOGY Co. Ltd. - Overview
              • SHENZHEN NEXNOVO TECHNOLOGY Co. Ltd. - Product / Service
              • SHENZHEN NEXNOVO TECHNOLOGY Co. Ltd. - Key offerings
            • 12.14 Sony Group Corp.
              • Sony Group Corp. - Overview
              • Sony Group Corp. - Business segments
              • Sony Group Corp. - Key news
              • Sony Group Corp. - Key offerings
              • Sony Group Corp. - Segment focus

            13 Appendix

            • 13.1 Scope of the report
              • 13.2 Inclusions and exclusions checklist
                • Inclusions checklist
                • Exclusions checklist
              • 13.3 Currency conversion rates for US$
                • Currency conversion rates for US$
              • 13.4 Research methodology
                • Research methodology
              • 13.5 Data procurement
                • Information sources
              • 13.6 Data validation
                • Data validation
              • 13.7 Validation techniques employed for market sizing
                • Validation techniques employed for market sizing
              • 13.8 Data synthesis
                • Data synthesis
              • 13.9 360 degree market analysis
                • 360 degree market analysis
              • 13.10 List of abbreviations
                • List of abbreviations

              Research Methodology

              Technavio presents a detailed picture of the market by way of study, synthesis, and summation of data from multiple sources. The analysts have presented the various facets of the market with a particular focus on identifying the key industry influencers. The data thus presented is comprehensive, reliable, and the result of extensive research, both primary and secondary.

              INFORMATION SOURCES

              Primary sources

              • Manufacturers and suppliers
              • Channel partners
              • Industry experts
              • Strategic decision makers

              Secondary sources

              • Industry journals and periodicals
              • Government data
              • Financial reports of key industry players
              • Historical data
              • Press releases

              DATA ANALYSIS

              Data Synthesis

              • Collation of data
              • Estimation of key figures
              • Analysis of derived insights

              Data Validation

              • Triangulation with data models
              • Reference against proprietary databases
              • Corroboration with industry experts

              REPORT WRITING

              Qualitative

              • Market drivers
              • Market challenges
              • Market trends
              • Five forces analysis

              Quantitative

              • Market size and forecast
              • Market segmentation
              • Geographical insights
              • Competitive landscape

              Interested in this report?

              Get your sample now to see our research methodology and insights!

              Download Now

              Frequently Asked Questions

              Transparent Digital Signage market growth will increase by $ 23700.8 mn during 2024-2028 .

              The Transparent Digital Signage market is expected to grow at a CAGR of 47.74% during 2024-2028 .

              Transparent Digital Signage market is segmented by Type( LED, OLED) End-user( Retail, Automotive, Media and Entertainment, Others)

              AUO Corp., Barco NV, Leyard Group, LG Corp., Panasonic Holdings Corp., PixelFLEX LLC, Pro Display, Samsung Electronics Co. Ltd., Shenzhen AuroLED Technology Co. Ltd., Shenzhen Huake Light Electronics Co. Ltd., SHENZHEN NEXNOVO TECHNOLOGY Co. Ltd., Sony Group Corp. are a few of the key vendors in the Transparent Digital Signage market.

              North America will register the highest growth rate of 34% among the other regions. Therefore, the Transparent Digital Signage market in North America is expected to garner significant business opportunities for the vendors during the forecast period.

              US, China, Canada, Germany, UK

              • Growing demand for digital signage and digital-out-of-home (DOOH)DOOH is defined as the display of dynamic advertising content in public areas is the driving factor this market.
              • which is intended to reach consumers when they are out of their homes. DOOH solutions offer an efficient and cost-effective advertising platform for all enterprises. Digital signage is a group of digital displays with centralized management designed for applications such as information display is the driving factor this market.
              • entertainment is the driving factor this market.
              • advertisement is the driving factor this market.
              • and merchandising. The demand for digital signage has been growing significantly during the past few years.Some of the recent developments in the digital signage and DOOH market are listed below:National Center for Missing and Exploited Children (NCMEC) is the driving factor this market.
              • in partnership with M/H VCCP is the driving factor this market.
              • launched Runaway Train 25. It is an initiative aimed at searching for missing people. Digital billboards will be placed in more than 40 US states to promote this initiative.JCDecaux Out of Home Advertising Pte. Ltd. (JCDecaux) announced a partnership with Funan is the driving factor this market.
              • a retail mall in Singapore is the driving factor this market.
              • to manage Funan eLevate Digital Billboard. This billboard shows innovative shopping offers to customers in the mall. Furthermore is the driving factor this market.
              • JCDecaux is planning to incorporate augmented reality (AR) in the digital billboard.The demand for digital signage can be attributed to the increase in the number of retail outlets across the world is the driving factor this market.
              • the surge in the adoption of digital signage in sectors such as transportation is the driving factor this market.
              • healthcare is the driving factor this market.
              • education is the driving factor this market.
              • and automobile is the driving factor this market.
              • as well as banking is the driving factor this market.
              • financial services is the driving factor this market.
              • and insurance (BFSI). Furthermore is the driving factor this market.
              • the increase in the number of international air travelers has significantly driven the need for upgraded digital billboards at airports across the world. For instance is the driving factor this market.
              • London Luton Airport Operations Ltd. (London Luton Airport) partnered with Signagelive and LG Electronics to upgrade its existing digital signage. One of the key benefits of the upgrade included a color code system for flight information. The airport has increased the number of digital advertising screens.Vendors in the digital signage market have started introducing transparent digital signage products to cater to the growing demand for transparent displays from enterprises. The demand for transparent digital signage is expected to grow simultaneously with the surge in the DOOH and digital signage market during the forecast period. This is mainly because of its major benefits is the driving factor this market.
              • including viability is the driving factor this market.
              • to fit perfectly in in-store and out-of-store advertising. Such factors will influence the demand for transparent digital signage during the forecast period. is the driving factor this market.

              The Transparent Digital Signage market vendors should focus on grabbing business opportunities from the LED segment as it accounted for the largest market share in the base year.