LED Display Market Size 2025-2029
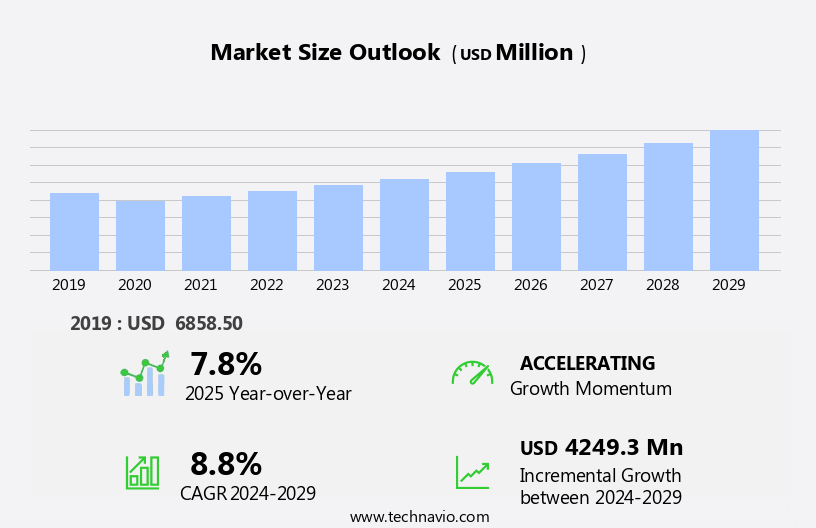
The led display market size is forecast to increase by USD 4.25 billion, at a CAGR of 8.8% between 2024 and 2029.
- The market is experiencing significant growth, driven by the increasing demand for fine-pitch LED displays. These displays offer superior image quality and are increasingly being adopted for various applications, including digital signage, advertising, and broadcasting. Energy efficiency is another key trend in the market, as businesses seek to reduce their carbon footprint and operating costs. LED displays consume less power than traditional lighting solutions, making them an attractive option for businesses looking to save on energy costs. However, the high cost of manufacturing LED displays remains a significant challenge for market growth. The complex production process and high raw material costs make LED displays more expensive than other display technologies.
- This price barrier may limit the adoption of LED displays in some markets, particularly in developing countries or small businesses with limited budgets. To overcome this challenge, manufacturers are exploring ways to optimize production processes and reduce costs, such as automating production lines and sourcing raw materials more efficiently. Companies that can effectively address this challenge and offer competitive pricing will be well-positioned to capitalize on the growing demand for LED displays.
What will be the Size of the LED Display Market during the forecast period?
Explore in-depth regional segment analysis with market size data - historical 2019-2023 and forecasts 2025-2029 - in the full report.
Request Free Sample
The market continues to evolve, driven by advancements in technology and expanding applications across various sectors. Inorganic LEDs, a key component of LED displays, have revolutionized the industry with their superior brightness, longevity, and energy efficiency. Liquid crystal displays (LCDs), another prominent display technology, have also undergone significant improvements, with increasing display resolution, faster response times, and advanced image processing capabilities. Heat dissipation remains a critical factor in the market, with innovative cooling solutions and advanced backlighting technologies, such as direct lighting and optical bonding, enabling larger, more powerful displays. Interactive displays, smart displays, and wireless technology are also gaining traction, enabling new applications in digital signage, video walls, and other sectors.
Frame rates, power consumption, and color depth are essential considerations for high-end applications, with active matrix and local dimming technologies offering improved image quality and energy efficiency. Manufacturing processes, such as surface treatment and projection mapping, are also evolving to meet the demands of the market. The market dynamics are shaped by ongoing research and development in areas such as pixel density, image enhancement, and color calibration. Display controllers, quantum dots, and other advanced technologies are pushing the boundaries of what is possible in LED and LCD displays. The market's continuous evolution reflects the industry's commitment to innovation and its ability to adapt to the changing needs of consumers and businesses alike.
How is this LED Display Industry segmented?
The led display industry research report provides comprehensive data (region-wise segment analysis), with forecasts and estimates in "USD million" for the period 2025-2029, as well as historical data from 2019-2023 for the following segments.
- Type
- Conventional LED displays
- Surface mounted LED displays
- Application
- Indoor
- Outdoor
- Display Type
- 4K
- Full HD
- 8K
- HD
- Technology
- Conventional LED
- OLED
- Micro-LED
- Geography
- North America
- US
- Canada
- Europe
- France
- Germany
- Italy
- UK
- Middle East and Africa
- UAE
- APAC
- China
- India
- Japan
- South Korea
- South America
- Brazil
- Rest of World (ROW)
- North America
By Type Insights
The conventional led displays segment is estimated to witness significant growth during the forecast period.
LED displays, a key component of digital signage and various other applications, are constructed using modular LED modules or panels. These modules, available in square or rectangular shapes, come in various sizes and resolutions. The pixel pitch of LED displays plays a crucial role in determining the resolution and image quality, with smaller pitches offering higher resolution for closer viewing distances and larger pitches suitable for longer distances. LED displays employ edge lighting, backlighting technology, and organic light-emitting diodes (OLED) for enhanced brightness and energy efficiency. Refresh rates, image processing, and signal processing ensure smooth visuals, while contrast ratios and color calibration provide improved image quality.
Smart displays and wireless technology enable remote control and content management, while touchscreen technology and interactive displays add user interactivity. Video walls, projection mapping, and local dimming offer larger display surfaces and enhanced visual experiences. Manufacturing processes include surface treatment, gamma correction, and color depth adjustments to ensure consistent quality. Active matrix and passive matrix technologies cater to different display requirements, while inorganic LEDs and liquid crystals offer alternative solutions. LED displays provide impressive color gamuts, screen sizes, and aspect ratios, with audio output and response time catering to diverse applications. Heat dissipation and power consumption are essential considerations for maintaining optimal performance.
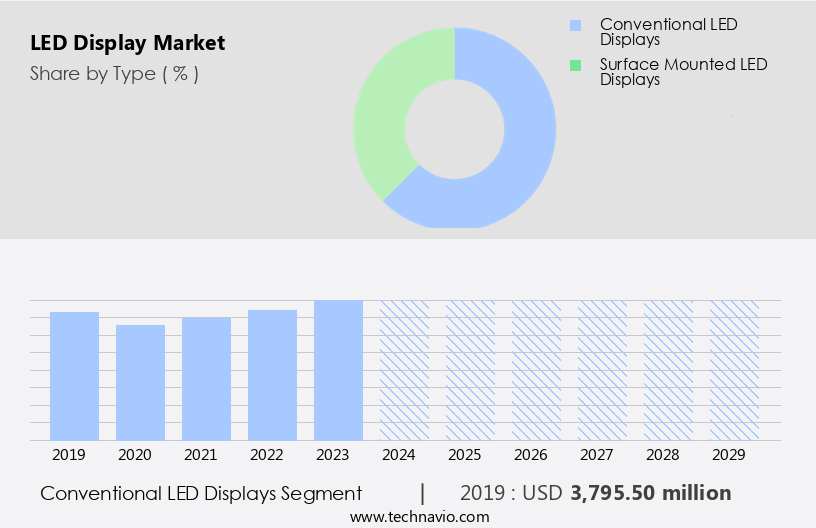
The Conventional LED displays segment was valued at USD 3.8 billion in 2019 and showed a gradual increase during the forecast period.
Regional Analysis
APAC is estimated to contribute 43% to the growth of the global market during the forecast period.Technavio's analysts have elaborately explained the regional trends and drivers that shape the market during the forecast period.
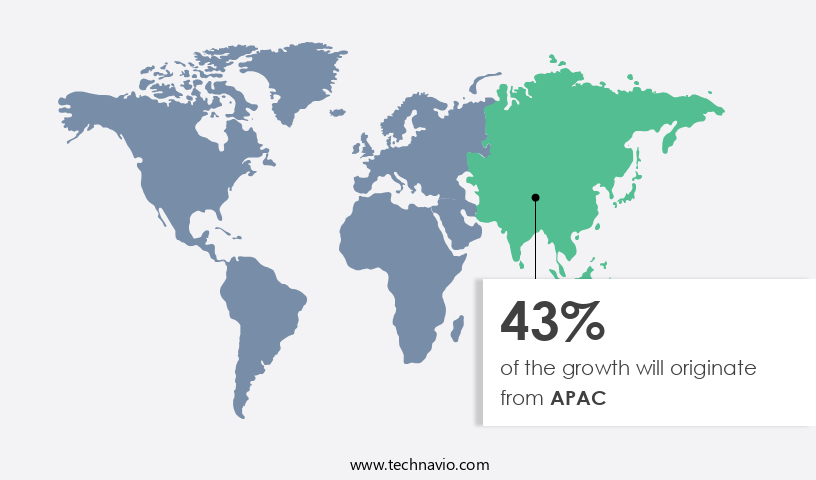
LED displays are experiencing significant growth in APAC markets due to urbanization, population expansion, and infrastructure development. Digital signage, transportation hubs, and retail outlets are key applications driving this demand. China, India, and Southeast Asian countries are leading the charge, fueled by their rapid economic growth. Governments and municipalities are investing in smart city initiatives, using LED displays to provide real-time information and support traffic management, environmental monitoring, and public safety. Major events, such as sports competitions, entertainment festivals, and cultural celebrations, further boost demand for LED displays in stadiums, arenas, and concert venues across the region. LED modules come in various panel types, including edge-lit and direct-lit, with backlighting technology and image processing capabilities.
Smart displays incorporate wireless technology and color calibration, while interactive displays offer touchscreen technology and image enhancement. Manufacturing processes involve organic light-emitting diodes (OLED) and inorganic LEDs, with contrast ratios and pixel structures varying based on the application. In the realm of backlighting technology, local dimming and gamma correction are essential features. Surface treatments and projection mapping enhance the viewing experience, while display controllers manage signal processing and power consumption. Quantum dots offer color gamut expansion, and pixel density and resolution are crucial factors in determining image quality. Heat dissipation is a critical concern in LED display manufacturing, with heat sinks and fans used to maintain optimal operating temperatures.
Frame rates, refresh rates, and response times are essential for smooth visual experiences, particularly in high-motion applications. Mounting hardware ensures secure installation, and video walls offer expansive display surfaces for large-scale projects. In conclusion, the market in APAC is thriving due to the region's economic growth and urban development. The technology's versatility, with features such as edge lighting, smart displays, and touchscreen capabilities, makes it an indispensable component of modern infrastructure and entertainment industries.
Market Dynamics
Our researchers analyzed the data with 2024 as the base year, along with the key drivers, trends, and challenges. A holistic analysis of drivers will help companies refine their marketing strategies to gain a competitive advantage.
The global LED display market size and forecast projects growth, driven by LED display market trends 2025-2029. B2B LED display solutions leverage advanced LED display technologies for high resolution. LED display market growth opportunities 2025 include LED displays for digital signage and LED screens for events, meeting demand. LED display management software optimizes operations, while LED display market competitive analysis highlights key manufacturers. Sustainable LED display practices align with eco-friendly display trends. LED display regulations 2025-2029 shapes LED display demand in Asia 2025. High-brightness LED solutions and premium LED display insights boost adoption. LED displays for retail and customized LED screen designs target niches. LED display market challenges and solutions address energy costs, with direct procurement strategies for LED displays and LED display pricing optimization enhancing profitability. Data-driven LED display analytics and 4K LED display trends drive innovation.
What are the key market drivers leading to the rise in the adoption of LED Display Industry?
- The surge in demand for fine-pitch LED displays serves as the primary catalyst for market growth in this sector. Fine-pitch LED displays, characterized by pixel pitches of 2mm or less, are experiencing significant demand, particularly in indoor applications that necessitate high-resolution visuals. These displays provide superior image quality and seamless viewing experiences, making them suitable for control rooms, broadcast studios, command centers, and corporate boardrooms. The minimal pixel pitch of fine-pitch LED displays ensures seamless visuals without pixelation, even at close viewing distances, making them ideal for creating immersive experiences in museums, theaters, and retail stores. Customizable to fit various architectural spaces and design requirements, these displays offer numerous advantages. Key features include bezel designs that minimize distractions, local dimming for enhanced contrast, gamma correction for accurate color representation, and surface treatment for improved durability.
- Additionally, fine-pitch LED displays employ advanced technologies such as quantum dot for increased pixel density, image enhancement, and digital signage applications. The displays' performance is controlled through sophisticated LED drivers and display controllers, ensuring optimal functionality and longevity.
What are the market trends shaping the LED Display Industry?
- The trend in the market is shifting towards energy-efficient display solutions, which are becoming increasingly popular. These solutions offer significant energy savings and are a must-have for businesses and consumers prioritizing sustainability and cost-effectiveness.
- LED displays, specifically those utilizing inorganic LED technology, are gaining popularity due to their energy efficiency and advanced features. Compared to liquid crystal displays, LEDs offer higher display resolution, faster frame rates, and improved color depth. These features create more immersive and harmonious visual experiences for consumers and businesses. Heat dissipation is a critical consideration in display technology, and LEDs excel in this area. Active matrix technology and direct lighting enable efficient heat management, preventing overheating and extending the lifespan of the display. Optical bonding further enhances energy efficiency by eliminating the air gap between the display panels, reducing power consumption.
- Interactive displays, which allow users to engage directly with the content, are becoming increasingly prevalent. LED displays' fast response times and high frame rates make them ideal for this application, offering a seamless and responsive user experience. As businesses and consumers prioritize energy efficiency and sustainability, the demand for energy-saving LED displays continues to grow. Their lower power consumption and cost savings over their lifespan make them an attractive investment for businesses seeking to minimize operational expenses and enhance their corporate image. By adopting energy-efficient LED displays, businesses demonstrate their commitment to reducing their carbon footprint and contributing to a more sustainable future.
What challenges does the LED Display Industry face during its growth?
- The high cost of manufacturing LED displays poses a significant challenge to the industry's growth trajectory. With increasing demand for advanced visual technology, finding cost-effective solutions to produce high-quality LED displays is crucial for industry expansion.
- LED display manufacturing entails intricate processes, including LED chip fabrication, PCB assembly, module integration, and panel assembly. The advanced technologies utilized in LED displays, such as high-resolution video input, fine pixel pitch, and flexible panels, add complexity and cost to the manufacturing process. The cost of raw materials, including LED modules, ICs, PCBs, and other electronic components, significantly impacts manufacturing expenses. The prices of these materials can be influenced by market demand, supply chain disruptions, and geopolitical factors. To remain competitive, LED display manufacturers must continually invest in research and development, focusing on enhancing product performance, features, and efficiency through technologies like edge lighting, backlighting, image processing, smart displays, wireless technology, and color calibration.
- These innovations contribute to the overall cost and complexity of manufacturing LED displays.
Exclusive Customer Landscape
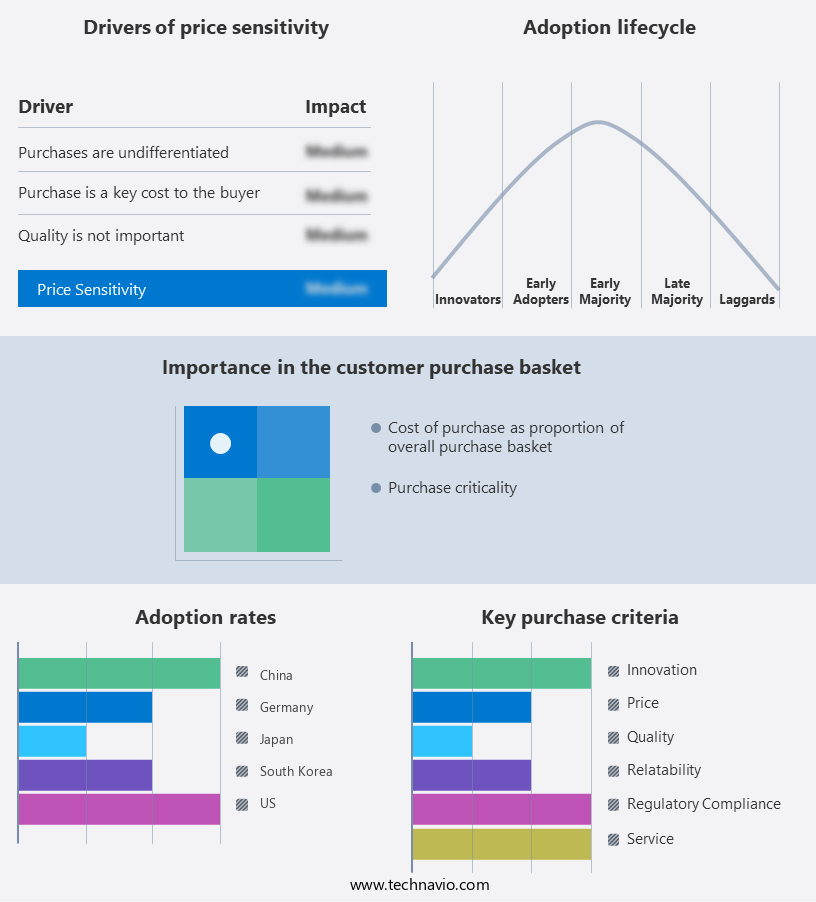
The led display market forecasting report includes the adoption lifecycle of the market, covering from the innovator's stage to the laggard's stage. It focuses on adoption rates in different regions based on penetration. Furthermore, the led display market report also includes key purchase criteria and drivers of price sensitivity to help companies evaluate and develop their market growth analysis strategies.
Customer Landscape
Key Companies & Market Insights
Companies are implementing various strategies, such as strategic alliances, led display market forecast, partnerships, mergers and acquisitions, geographical expansion, and product/service launches, to enhance their presence in the industry.
Dakco Technologies Co., Ltd. - The company specializes in LED display solutions, featuring innovative models such as Genesis II, March II, Mobile LED Trailer Display, The March Series, X28 Series, and Gem Series. These displays offer advanced technology and versatility for various applications, enhancing visual communication and engagement.
The industry research and growth report includes detailed analyses of the competitive landscape of the market and information about key companies, including:
- Dakco Technologies Co., Ltd.
- Expromo Europe A/S.
- HSC LED Co., Ltd.
- Ledman Optoelectronic Co.,ltd.
- Ledtop Visual Ltd.
- Leyard Optoelectronic
- LG Corp.
- LIANTRONICS CO.,LTD.
- Neoti LLC
- Samsung Electronics Co. Ltd.
- Sansi North America (SNA) Displays
- Shenzhen Absen Optoelectronic Co. Ltd.
- SHENZHEN JIE YU INDUSTRIAL CO., LTD
- SHENZHEN NEXNOVO TECHNOLOGY Co. Ltd.
- SHENZHEN UNIVIEW LED CO.,LTD
- Shenzhen Vision Pro Electronic Co., Ltd.
- Shenzhen Yuchip Lighting Co., Ltd.
- Vanguard LED Displays
- Viewpointec Technology Co., Ltd.
- ViewSonic Corp.
Qualitative and quantitative analysis of companies has been conducted to help clients understand the wider business environment as well as the strengths and weaknesses of key industry players. Data is qualitatively analyzed to categorize companies as pure play, category-focused, industry-focused, and diversified; it is quantitatively analyzed to categorize companies as dominant, leading, strong, tentative, and weak.
Recent Development and News in LED Display Market
- In January 2024, Samsung Electronics, a leading player in the market, unveiled its new Micro LED product line, The Wall Lux, at the Consumer Electronics Show (CES) 2024. This innovative product line offers customizable sizes and high resolution, marking Samsung's entry into the premium large-format display segment (Business Wire, 2024).
- In March 2024, LG Display and Foxconn Technology Group announced a strategic partnership to jointly develop and manufacture OLED and QD-OLED displays. This collaboration aims to strengthen LG Display's position in the premium display market and expand Foxconn's offerings (Reuters, 2024).
- In May 2024, Signify Holding, a global lighting company, completed the acquisition of Interlight, a leading European LED lighting manufacturer. This acquisition significantly expanded Signify's presence in the European LED lighting market and increased its production capacity (Wall Street Journal, 2024).
- In January 2025, the European Union passed the new Energy Labeling Regulation, which includes stricter energy efficiency requirements for LED displays. This regulation is expected to drive demand for energy-efficient LED displays and boost market growth (European Commission, 2025).
Research Analyst Overview
- The market encompasses various applications, including medical displays, interactive whiteboards, automotive displays, and commercial displays. One notable trend is the integration of advanced technologies, such as high refresh rate, 3D display, augmented reality, and virtual reality, into these displays. Supply chain management is crucial in ensuring the timely delivery of high-quality components, including thin bezel design, fast response time, and high contrast ratio displays. Holographic and curved displays, as well as transparent and flexible displays, are gaining popularity due to their unique features. Industrial displays require high brightness and long lifespan, making them suitable for outdoor applications and monitoring systems.
- Billboard displays and digital menu boards benefit from low power consumption and wide color gamut. Calibration tools and maintenance services ensure optimal performance and longevity. Military displays prioritize high dynamic range and rugged design. Regardless of the application, the demand for LED displays continues to grow, driven by their energy efficiency, versatility, and ability to deliver stunning visual experiences.
Dive into Technavio's robust research methodology, blending expert interviews, extensive data synthesis, and validated models for unparalleled LED Display Market insights. See full methodology.
|
Market Scope |
|
|
Report Coverage |
Details |
|
Page number |
232 |
|
Base year |
2024 |
|
Historic period |
2019-2023 |
|
Forecast period |
2025-2029 |
|
Growth momentum & CAGR |
Accelerate at a CAGR of 8.8% |
|
Market growth 2025-2029 |
USD 4249.3 million |
|
Market structure |
Fragmented |
|
YoY growth 2024-2025(%) |
7.8 |
|
Key countries |
US, China, India, Germany, Japan, UK, South Korea, Canada, Brazil, France, UAE, and Italy |
|
Competitive landscape |
Leading Companies, Market Positioning of Companies, Competitive Strategies, and Industry Risks |
What are the Key Data Covered in this LED Display Market Research and Growth Report?
- CAGR of the LED Display industry during the forecast period
- Detailed information on factors that will drive the growth and forecasting between 2025 and 2029
- Precise estimation of the size of the market and its contribution of the industry in focus to the parent market
- Accurate predictions about upcoming growth and trends and changes in consumer behaviour
- Growth of the market across APAC, North America, Europe, South America, and Middle East and Africa
- Thorough analysis of the market's competitive landscape and detailed information about companies
- Comprehensive analysis of factors that will challenge the led display market growth of industry companies
We can help! Our analysts can customize this led display market research report to meet your requirements.
 RIA -
RIA - 
