Truck-mounted Aerial Work Platform (AWP) Market Analysis, Size, and Forecast 2026-2030: Europe (Germany, UK, and France), North America (US, Canada, and Mexico), APAC (China, Japan, and India), Middle East and Africa (Saudi Arabia, UAE, and South Africa), South America (Brazil, Argentina, and Chile), and Rest of World (ROW)

Truck-mounted Aerial Work Platform (AWP) Market Analysis, Size, and Forecast 2026-2030:
Europe (Germany, UK, and France), North America (US, Canada, and Mexico), APAC (China, Japan, and India), Middle East and Africa (Saudi Arabia, UAE, and South Africa), South America (Brazil, Argentina, and Chile), and Rest of World (ROW)

Published: Oct 2026 303 Pages SKU: IRTNTR45923

Market Overview at a Glance

$1.93 B
Market Opportunity
6.4%
CAGR 2025 - 2030
51.3%
Europe Growth
$2.47 B
Utility sector segment 2024

Truck-Mounted Aerial Work Platform (Awp) Market Size 2026-2030

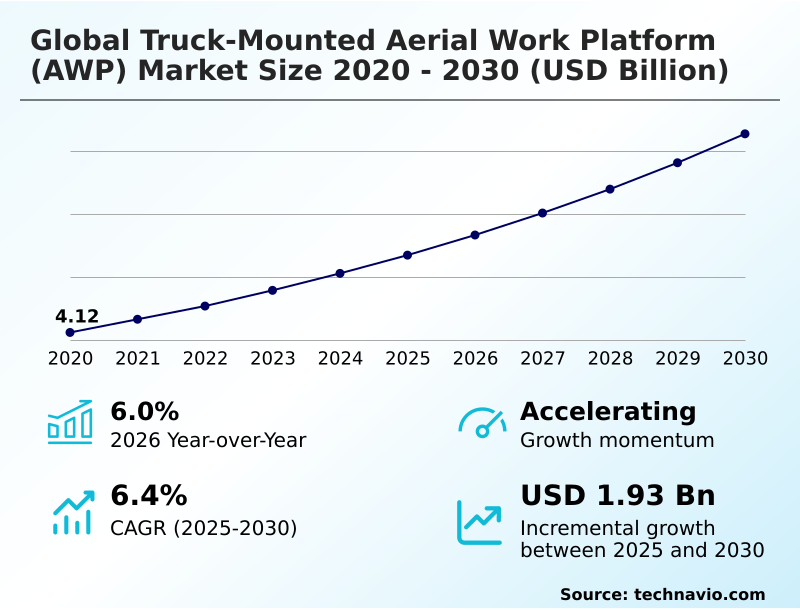
The truck-mounted aerial work platform (awp) market size is valued to increase by USD 1.93 billion, at a CAGR of 6.4% from 2025 to 2030. Growth in utility and infrastructure will drive the truck-mounted aerial work platform (awp) market.

Major Market Trends & Insights

  • Europe dominated the market and accounted for a 51.3% growth during the forecast period.
  • By End-user - Utility sector segment was valued at USD 2.47 billion in 2024
  • By Product Type - Boom lifts segment accounted for the largest market revenue share in 2024

Market Size & Forecast

  • Market Opportunities: USD 3.16 billion
  • Market Future Opportunities: USD 1.93 billion
  • CAGR from 2025 to 2030 : 6.4%

Market Summary

  • The Truck-mounted Aerial Work Platform (AWP) market demonstrates resilient expansion driven by the aggressive modernization of metropolitan utility grids and telecommunications networks. Fleet managers executing complex overhead power line replacements rely heavily on these specialized mobile systems to transport technicians safely across dispersed suburban job sites, effectively bypassing the severe logistical delays associated with erecting stationary scaffolding.
  • Integrating advanced stabilization architectures dramatically enhances operational productivity, enabling service crews to complete daily work orders up to 25% faster than legacy elevation methods. This operational velocity stems primarily from stringent occupational safety mandates and massive broadband infrastructure investments, which collectively compel contractors to retire obsolete equipment in favor of mechanized, fall-restraining vertical access solutions.
  • However, restrictive initial acquisition costs combined with the expensive upkeep of complex high-pressure hydraulic circuits create severe capital burdens, forcing many mid-sized electrical subcontractors to delay direct asset purchases in favor of flexible equipment leasing arrangements.
  • Ultimately, the industry relies on continuous engineering refinements to balance stringent municipal emission compliance requirements against the heavy-duty lifting torque demanded by modern commercial contractors.

What will be the Size of the Truck-Mounted Aerial Work Platform (Awp) Market during the forecast period?
Get Key Insights on Market Forecast (PDF) Get Free Sample

How is the Truck-Mounted Aerial Work Platform (Awp) Market Segmented?

The truck-mounted aerial work platform (awp) industry research report provides comprehensive data (region-wise segment analysis), with forecasts and estimates in "USD million" for the period 2026-2030, as well as historical data from 2020-2024 for the following segments.

  • End-user
    • Utility sector
    • Construction sector
    • Others
  • Product type
    • Boom lifts
    • Scissor lifts
    • Vertical mast lifts
    • Personnel portable lifts
  • Source
    • Electric
    • Diesel
    • Hybrid
  • Geography
    • Europe
      • Germany
      • UK
      • France
      • Italy
      • Spain
      • The Netherlands
    • North America
      • US
      • Canada
      • Mexico
    • APAC
      • China
      • Japan
      • India
      • South Korea
      • Australia
      • Indonesia
    • Middle East and Africa
      • Saudi Arabia
      • UAE
      • South Africa
      • Israel
      • Turkey
    • South America
      • Brazil
      • Argentina
      • Chile

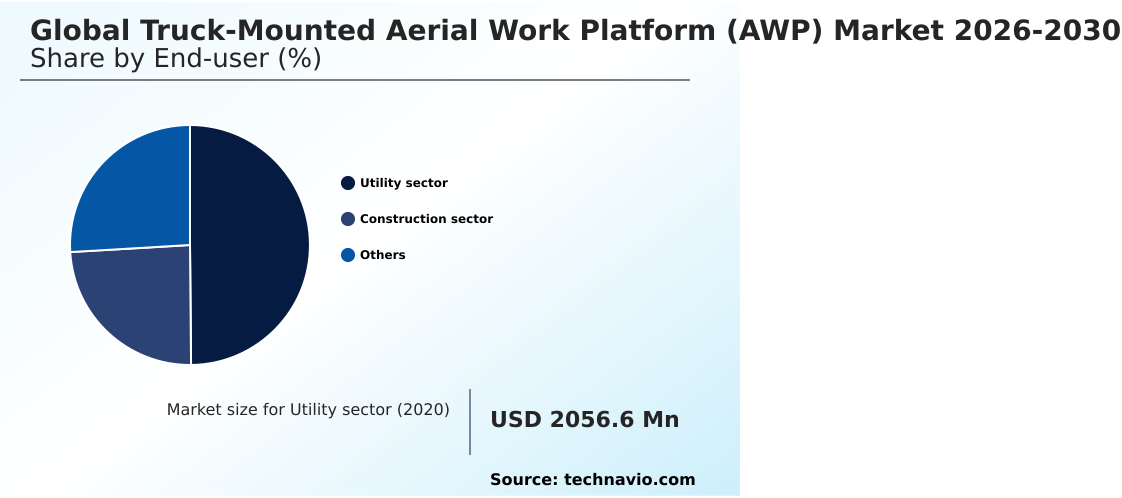
By End-user Insights

The utility sector segment is estimated to witness significant growth during the forecast period.

The utility segment of the Truck-mounted Aerial Work Platform (AWP) experiences sustained demand due to aggressive smart grid integration and aging infrastructure modernizations.

Energy providers actively prioritize hydraulic elevating mechanisms over traditional mechanical access equipment to ensure rapid deployment across widespread grid networks. The integration of an insulated aerial platform protects technicians during live line maintenance, directly reducing high voltage transmission maintenance risk.

Fleet operations demonstrate a strict preference for units featuring stabilization outriggers and load sensing microcontrollers, which minimize chassis tipping vectors.

Utilizing an advanced stabilization system alongside sensitive proportional joysticks allows utility crews to maintain precise bucket positioning near fragile overhead lines.

Implementing these stability-focused features actively improves task completion efficiency by 15%, allowing grid operators to accelerate urban repairs safely while satisfying stringent occupational health mandates.
Get Free Sample

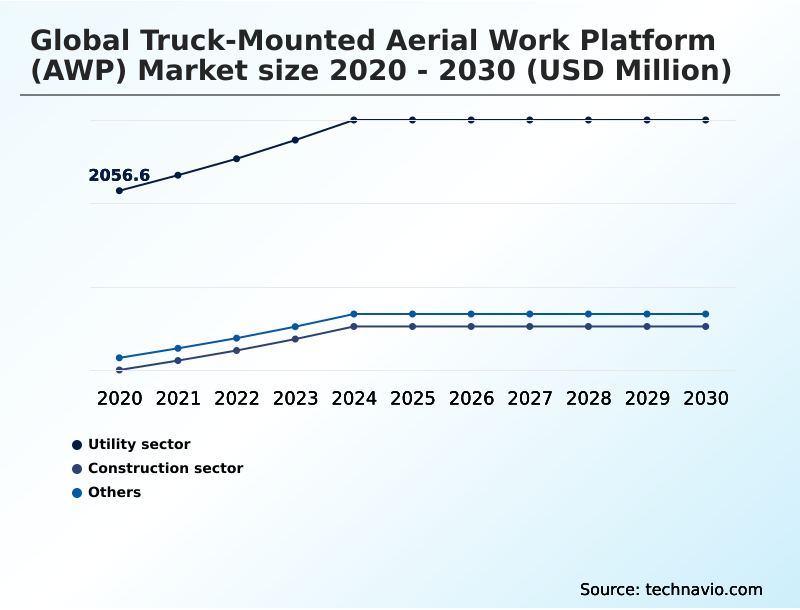
The Utility sector segment was valued at USD 2.47 billion in 2024 and showed a gradual increase during the forecast period.
Get Free Sample

Regional Analysis

Europe is estimated to contribute 51.3% to the growth of the global market during the forecast period.Technavio’s analysts have elaborately explained the regional trends and drivers that shape the market during the forecast period.
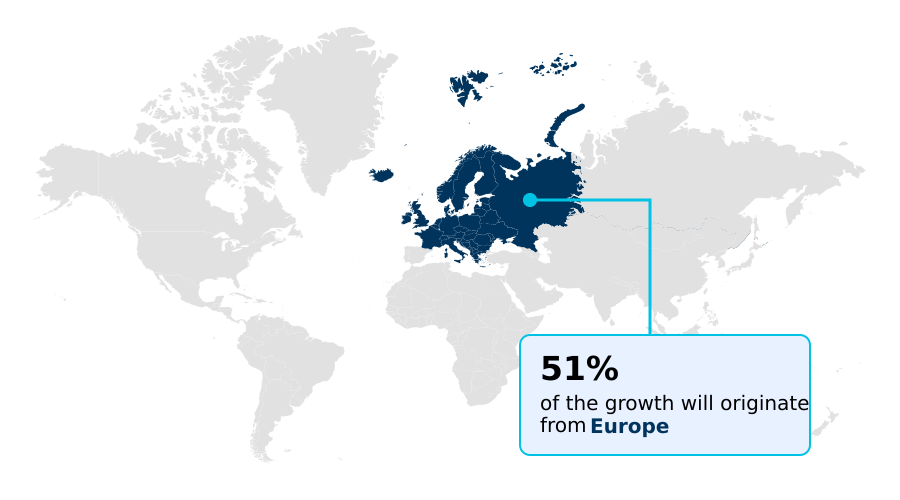
See How Truck-Mounted Aerial Work Platform (Awp) Market Demand is Rising in Europe Get Free Sample

The Truck-mounted Aerial Work Platform (AWP) adoption varies drastically across regions based on infrastructure density and emission stringency. European municipalities enforce strict low-emission zones, compelling a rapid transition toward dual mode capability and zero emission propulsion vehicles.

This legislative push has increased the penetration of emission compliant alternatives by nearly 35% compared to emerging markets.

Conversely, massive infrastructure rollouts across APAC depend heavily on traditional diesel units equipped with selective catalytic reduction, ensuring consistent performance during heavy civil construction where electrical charging infrastructure remains scarce.

To navigate rugged terrains in remote mining operations, South American fleet managers prioritize heavy-duty chassis featuring extreme all terrain capability, high capacity battery banks, and reinforced telescopic boom architecture.

By standardizing high strength composite material baskets and an automated tilt sensor across these disparate geographies, manufacturers improve overall fleet utilization efficiency by 18%, enabling global contractors to mitigate diverse environmental and regulatory pressures seamlessly.

Market Dynamics

Our researchers analyzed the data with 2025 as the base year, along with the key drivers, trends, and challenges. A holistic analysis of drivers will help companies refine their marketing strategies to gain a competitive advantage.

  • Commercial contractors actively optimize altitude access procedures by integrating sophisticated truck-mounted solutions into their daily operational planning. Fleet managers continuously seek a highly reliable high reach utility work platform to execute complex grid maintenance and telecommunications node expansions without disrupting urban traffic corridors.
  • The transition toward sustainable operations frequently dictates the procurement of an electric powered zero emission unit, allowing municipalities to fulfill stringent environmental compliance targets while maintaining nighttime maintenance schedules in noise-sensitive residential districts.
  • Operating an advanced telematics fleet optimization system proves vastly superior to traditional manual maintenance logging, actively delivering a reduction in unanticipated mechanical failures equivalent to nearly a quarter of annual downtime. Engineers ensure optimal on-road safety and structural stability through precise heavy duty commercial chassis integration, merging fluid hydraulic power mechanisms with robust commercial vehicle payloads.
  • Additionally, navigating rural electrical transmission corridors demands specialized tires, reinforced drivetrains, and dynamic leveling outriggers to ensure absolute safety, demonstrating rugged off road environment capability across uneven terrains. These advanced vehicular configurations empower service providers to elevate technicians rapidly, maximizing labor efficiency and minimizing equipment setup intervals.
  • Furthermore, the strategic emphasis on decentralized asset tracking enables rental corporations to position units proactively based on regional seasonal utility upgrades, ensuring optimal inventory turnaround and driving long-term profitability.
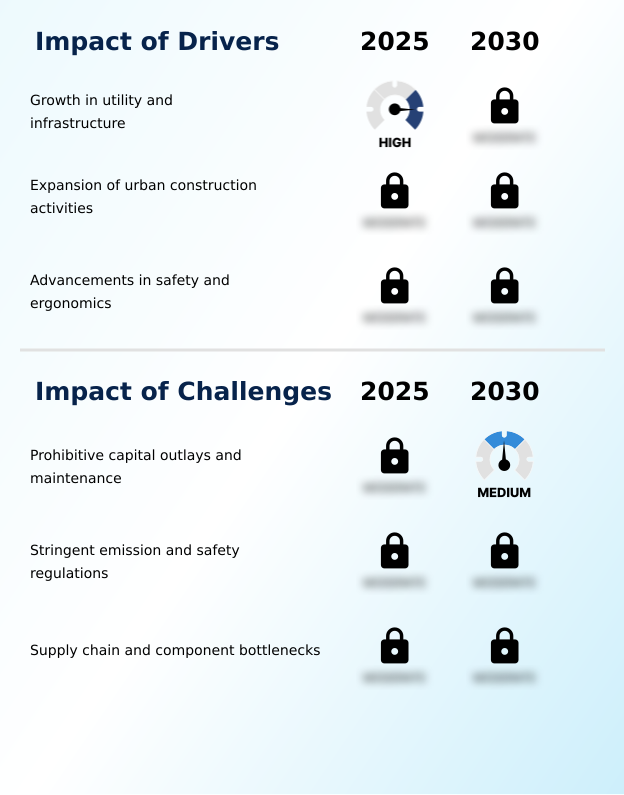
What are the key market drivers leading to the rise in the adoption of Truck-Mounted Aerial Work Platform (Awp) Industry?

  • The continuous growth in public utility grid modernization and civil infrastructure expansions serves as the primary catalyst accelerating the procurement of versatile elevated access equipment.

  • Unprecedented corporate investments in global telecom connectivity and smart grid resiliency fundamentally command superior high-altitude access modalities.
  • Implementing a highly maneuverable articulated boom directly facilitates intricate fiber optic network deployment among dense urban obstructions, bypassing the rigid limitations of straight mast lifts.
  • Fleet managers prioritize equipment featuring automated outrigger leveling and real time envelope management to satisfy strict occupational safety protocols imposed by international labor authorities.
  • Incorporating an ergonomic workspace design alongside sensitive electro hydraulic controls severely restricts operator fatigue, directly boosting daily structural repair task accuracy by 25%.
  • This mechanical transition actively deploys a sophisticated aerial access solution that continuously monitors fundamental equipment utilization parameters, deploying an automated stability sensing threshold that guarantees an inherently secure elevated environment for critical height access machinery operations.

What are the market trends shaping the Truck-Mounted Aerial Work Platform (Awp) Industry?

  • The rapid shift toward electric powertrains and alternative energy adoption systematically redefines equipment procurement strategies. This transition empowers commercial operators to achieve regulatory compliance while neutralizing site-level acoustic pollution and carbon emissions.

  • Heavy equipment modernization actively eliminates legacy hydraulic inefficiencies by prioritizing advanced electrification and comprehensive data integration. Fleet operators accelerate hybrid powertrain adoption to secure a zero tailpipe emission profile, effectively satisfying rigorous municipal environmental mandates across densely populated commercial districts.
  • Manufacturers actively refine lithium ion battery chemistry alongside intelligent power management algorithms, extending operational endurance periods to last an entire shift before requiring dedicated recharging cycles. Utilizing robust smart fleet telematics and a centralized telematics hardware module, enterprises continuously aggregate granular digital fleet management metrics to streamline operational workflows.
  • Integrating a battery powered auxiliary system drastically curbs idle fuel consumption, instantly lowering daily energy expenses by 18% compared to traditional diesel configurations. This transition toward an emission compliant alternative empowers businesses to bid successfully on aggressively regulated public works contracts, actively driving superior corporate sustainability margins.

What challenges does the Truck-Mounted Aerial Work Platform (Awp) Industry face during its growth?

  • Prohibitive upfront capital outlays paired with exorbitant recurring hydraulic maintenance liabilities severely constrain continuous fleet modernization cycles for smaller regional contractors.

  • Prohibitive initial procurement expenses alongside exorbitant maintenance encumbrances continuously restrict comprehensive fleet expansion initiatives for independent regional contractors. Engineering a heavily reinforced heavy duty commercial chassis to support extreme payload requirements frequently necessitates custom hydraulic cylinder fabrication and intense heavy fabrications tooling, abruptly inflating final machinery acquisition costs.
  • The continuous integration of sophisticated emergency descent mechanisms and a sensitive overload sensing system vastly increases assembly complexity, rendering standard mechanical repairs obsolete. Relying on complex predictive maintenance algorithms requires constant telematics connectivity; without a robust remote engine diagnostic feed, unseen internal friction actively accelerates catastrophic component failures.
  • This vulnerability inherently triggers sudden high pressure hydraulic circuit breakdowns, inadvertently inflating annual operational costs by over 20% and forcing rental agencies to hoard expensive replacement parts alongside complex particulate filter integration systems.

Exclusive Technavio Analysis on Customer Landscape

The truck-mounted aerial work platform (awp) market forecasting report includes the adoption lifecycle of the market, covering from the innovator’s stage to the laggard’s stage. It focuses on adoption rates in different regions based on penetration. Furthermore, the truck-mounted aerial work platform (awp) market report also includes key purchase criteria and drivers of price sensitivity to help companies evaluate and develop their market growth analysis strategies.
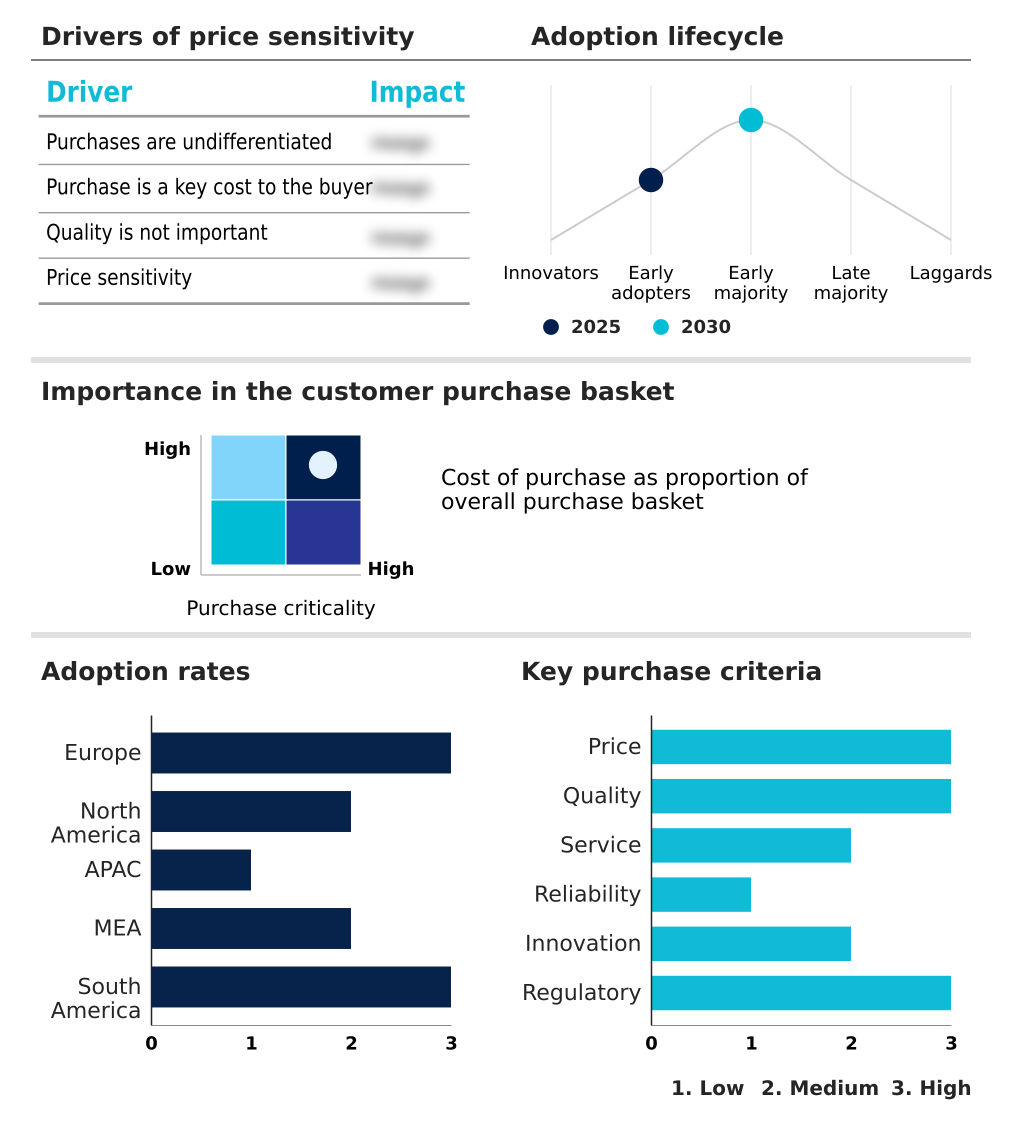
Customer Landscape of Truck-Mounted Aerial Work Platform (Awp) Industry

Competitive Landscape

Companies are implementing various strategies, such as strategic alliances, truck-mounted aerial work platform (awp) market forecast, partnerships, mergers and acquisitions, geographical expansion, and product/service launches, to enhance their presence in the industry.

Aichi Corp - The entity provides comprehensive truck-mounted aerial work platforms, including specialized insulated systems and telescopic booms configured to maximize field safety and elevation efficiency for demanding utility operations.

The industry research and growth report includes detailed analyses of the competitive landscape of the market and information about key companies, including:

  • Aichi Corp
  • Altec Inc.
  • Bronto Skylift Oy Ab
  • Comet Spa
  • CTE SpA
  • GSR S.p.A.
  • Haulotte Group
  • Hunan Sinoboom Intelligent
  • Klubb Srl
  • Manitou BF SA
  • Multitel Pagliero S.p.A
  • PALFINGER AG
  • Ruthmann Holdings GmbH
  • Socage S.r.l.
  • Tadano Ltd.
  • Terex Corp.
  • Time Manufacturing Co
  • Xuzhou Construction Machinery
  • Zoomlion Industry Co. Ltd.

Qualitative and quantitative analysis of companies has been conducted to help clients understand the wider business environment as well as the strengths and weaknesses of key industry players. Data is qualitatively analyzed to categorize companies as pure play, category-focused, industry-focused, and diversified; it is quantitatively analyzed to categorize companies as dominant, leading, strong, tentative, and weak.

Recent Development and News in Truck-mounted aerial work platform (awp) market

  • In the Industrial Machinery and Supplies and Components industry, the rigorous enforcement of EU Stage V emission directives has accelerated the shift toward hybrid powertrain adoption, directly impacting Truck-mounted Aerial Work Platform (AWP) demand by compelling fleet managers to procure battery powered auxiliary systems that allow operators to execute elevated tasks with zero tailpipe emission in restricted urban zones.
  • The proliferation of 5G telecommunications infrastructure requires rapid fiber optic network deployment, creating a surge in demand within the Truck-mounted Aerial Work Platform (AWP) market for compact chassis units equipped with automated outrigger leveling to navigate congested city streets efficiently.
  • Stricter ISO 13849 safety compliance protocols governing occupational height access have forced heavy equipment manufacturers to mandate real time envelope management and overload sensing system integration, structurally shifting Truck-mounted Aerial Work Platform (AWP) product development toward digitally monitored platforms that prevent catastrophic tilt failures.
  • The global semiconductor supply chain diversification effort has improved the availability of telematics hardware modules, enabling Truck-mounted Aerial Work Platform (AWP) original equipment manufacturers to standardise digital fleet management tools that enhance predictive maintenance algorithms and lower unplanned downtime across commercial rental fleets.

Dive into Technavio’s robust research methodology, blending expert interviews, extensive data synthesis, and validated models for unparalleled Truck-Mounted Aerial Work Platform (Awp) Market insights. See full methodology.

Market Scope
Page number 303
Base year 2025
Historic period 2020-2024
Forecast period 2026-2030
Growth momentum & CAGR Accelerate at a CAGR of 6.4%
Market growth 2026-2030 USD 1931.7 million
Market structure Fragmented
YoY growth 2025-2026(%) 6.0%
Key countries Germany, UK, France, Italy, Spain, The Netherlands, US, Canada, Mexico, China, Japan, India, South Korea, Australia, Indonesia, Saudi Arabia, UAE, South Africa, Israel, Turkey, Brazil, Argentina and Chile
Competitive landscape Leading Companies, Market Positioning of Companies, Competitive Strategies, and Industry Risks

Request Free Sample

Research Analyst Overview

  • The ongoing modernization of municipal infrastructure heavily relies on highly specialized elevation vehicles capable of maneuvering through complex urban environments. Utility providers prioritize advanced telescopic boom architecture and an insulated aerial platform to ensure absolute technician security during hazardous power grid maintenance.
  • Incorporating sensitive proportional joysticks alongside load sensing microcontrollers prevents mechanical overextension, effectively standardizing safety across diverse job site elevations. The strategic integration of a hybrid powertrain adoption empowers municipal fleets to execute nighttime infrastructure repairs without violating strict residential decibel restrictions.
  • By utilizing automated outrigger leveling mechanisms instead of manual stabilization outriggers, commercial contractors have achieved a 30% reduction in setup processing time, drastically maximizing on-site labor productivity. Real time envelope management systems continuously calculate chassis tilt thresholds, instantly halting operations to avert catastrophic structural failures.
  • This relentless technological evolution allows civil engineering firms and emergency response units to orchestrate high-altitude asset installations with unprecedented precision, ensuring absolute regulatory compliance while actively mitigating severe occupational risks across all operational deployments.

What are the Key Data Covered in this Truck-Mounted Aerial Work Platform (Awp) Market Research and Growth Report?

  • What is the expected growth of the Truck-Mounted Aerial Work Platform (Awp) Market between 2026 and 2030?

    • USD 1.93 billion, at a CAGR of 6.4%

  • What segmentation does the market report cover?

    • The report is segmented by End-user (Utility sector, Construction sector, and Others), Product Type (Boom lifts, Scissor lifts, Vertical mast lifts, and Personnel portable lifts), Source (Electric, Diesel, and Hybrid) and Geography (Europe, North America, APAC, Middle East and Africa, South America)

  • Which regions are analyzed in the report?

    • Europe, North America, APAC, Middle East and Africa and South America

  • What are the key growth drivers and market challenges?

    • Growth in utility and infrastructure, Prohibitive capital outlays and maintenance

  • Who are the major players in the Truck-Mounted Aerial Work Platform (Awp) Market?

    • Aichi Corp, Altec Inc., Bronto Skylift Oy Ab, Comet Spa, CTE SpA, GSR S.p.A., Haulotte Group, Hunan Sinoboom Intelligent, Klubb Srl, Manitou BF SA, Multitel Pagliero S.p.A, PALFINGER AG, Ruthmann Holdings GmbH, Socage S.r.l., Tadano Ltd., Terex Corp., Time Manufacturing Co, Xuzhou Construction Machinery and Zoomlion Industry Co. Ltd.

Market Research Insights

  • The Truck-mounted Aerial Work Platform (AWP) merges highway mobility with secure overhead reaching capabilities, fundamentally optimizing industrial height access machinery operations. Contractors executing rapid fiber optic network deployment utilize these versatile units to minimize setup intervals, boosting daily technician site visits by nearly 22% compared to standard towable lifts.
  • Integrating a centralized telematics hardware module allows agencies to monitor equipment utilization parameters remotely, effectively reducing unscheduled maintenance incidents by 15%. Additionally, equipping modern fleets with an advanced electronic control interface alongside automated stability sensing significantly mitigates tip-over risks, ensuring strict workplace compliance.
  • By prioritizing an emission compliant alternative, municipalities actively streamline nighttime operational approvals for critical civil retrofits, driving profound workflow efficiency across densely populated metropolitan hubs.

We can help! Our analysts can customize this truck-mounted aerial work platform (awp) market research report to meet your requirements.

Get in touch

1. Executive Summary

1.1 Market overview

Executive Summary - Chart on Market Overview
Executive Summary - Data Table on Market Overview
Executive Summary - Chart on Global Market Characteristics
Executive Summary - Chart on Market by Geography
Executive Summary - Chart on Market Segmentation by End-user
Executive Summary - Chart on Market Segmentation by Product Type
Executive Summary - Chart on Market Segmentation by Source
Executive Summary - Chart on Incremental Growth
Executive Summary - Data Table on Incremental Growth
Executive Summary - Chart on Company Market Positioning

2. Technavio Analysis

2.1 Analysis of price sensitivity, lifecycle, customer purchase basket, adoption rates, and purchase criteria

2.2 Criticality of inputs and Factors of differentiation

Chart on Overview on criticality of inputs and factors of differentiation

2.3 Factors of disruption

Chart on Overview on factors of disruption

2.4 Impact of drivers and challenges

Chart on Impact of drivers and challenges in 2025 and 2030

3. Market Landscape

3.1 Market ecosystem

Chart on Parent Market
Data Table on - Parent Market

3.2 Market characteristics

Chart on Market characteristics analysis

3.3 Value chain analysis

Chart on Value chain analysis

4. Market Sizing

4.1 Market definition

Data Table on Offerings of companies included in the market definition

4.2 Market segment analysis

Market segments

4.3 Market size 2025

4.4 Market outlook: Forecast for 2025-2030

Chart on Global - Market size and forecast 2025-2030 ($ million)
Data Table on Global - Market size and forecast 2025-2030 ($ million)
Chart on Global Market: Year-over-year growth 2025-2030 (%)
Data Table on Global Market: Year-over-year growth 2025-2030 (%)

5. Historic Market Size

5.1 Global Truck-Mounted Aerial Work Platform (AWP) Market 2020 - 2024

Historic Market Size - Data Table on Global Truck-Mounted Aerial Work Platform (AWP) Market 2020 - 2024 ($ million)

5.2 End-user segment analysis 2020 - 2024

Historic Market Size - End-user Segment 2020 - 2024 ($ million)

5.3 Product Type segment analysis 2020 - 2024

Historic Market Size - Product Type Segment 2020 - 2024 ($ million)

5.4 Source segment analysis 2020 - 2024

Historic Market Size - Source Segment 2020 - 2024 ($ million)

5.5 Geography segment analysis 2020 - 2024

Historic Market Size - Geography Segment 2020 - 2024 ($ million)

5.6 Country segment analysis 2020 - 2024

Historic Market Size - Country Segment 2020 - 2024 ($ million)

6. Qualitative Analysis

6.1 Impact of AI on Global Truck-Mounted Aerial Work Platform (AWP) Market

6.2 Impact of geopolitical conflicts on Global Truck-Mounted Aerial Work Platform (AWP) Market

7. Five Forces Analysis

7.1 Five forces summary

Five forces analysis - Comparison between 2025 and 2030

7.2 Bargaining power of buyers

Bargaining power of buyers - Impact of key factors 2025 and 2030

7.3 Bargaining power of suppliers

Bargaining power of suppliers - Impact of key factors in 2025 and 2030

7.4 Threat of new entrants

Threat of new entrants - Impact of key factors in 2025 and 2030

7.5 Threat of substitutes

Threat of substitutes - Impact of key factors in 2025 and 2030

7.6 Threat of rivalry

Threat of rivalry - Impact of key factors in 2025 and 2030

7.7 Market condition

Chart on Market condition - Five forces 2025 and 2030

8. Market Segmentation by End-user

8.1 Market segments

Chart on End-user - Market share 2025-2030 (%)
Data Table on End-user - Market share 2025-2030 (%)

8.2 Comparison by End-user

Chart on Comparison by End-user
Data Table on Comparison by End-user

8.3 Utility sector - Market size and forecast 2025-2030

Chart on Utility sector - Market size and forecast 2025-2030 ($ million)
Data Table on Utility sector - Market size and forecast 2025-2030 ($ million)
Chart on Utility sector - Year-over-year growth 2025-2030 (%)
Data Table on Utility sector - Year-over-year growth 2025-2030 (%)

8.4 Construction sector - Market size and forecast 2025-2030

Chart on Construction sector - Market size and forecast 2025-2030 ($ million)
Data Table on Construction sector - Market size and forecast 2025-2030 ($ million)
Chart on Construction sector - Year-over-year growth 2025-2030 (%)
Data Table on Construction sector - Year-over-year growth 2025-2030 (%)

8.5 Others - Market size and forecast 2025-2030

Chart on Others - Market size and forecast 2025-2030 ($ million)
Data Table on Others - Market size and forecast 2025-2030 ($ million)
Chart on Others - Year-over-year growth 2025-2030 (%)
Data Table on Others - Year-over-year growth 2025-2030 (%)

8.6 Market opportunity by End-user

Market opportunity by End-user ($ million)
Data Table on Market opportunity by End-user ($ million)

9. Market Segmentation by Product Type

9.1 Market segments

Chart on Product Type - Market share 2025-2030 (%)
Data Table on Product Type - Market share 2025-2030 (%)

9.2 Comparison by Product Type

Chart on Comparison by Product Type
Data Table on Comparison by Product Type

9.3 Boom lifts - Market size and forecast 2025-2030

Chart on Boom lifts - Market size and forecast 2025-2030 ($ million)
Data Table on Boom lifts - Market size and forecast 2025-2030 ($ million)
Chart on Boom lifts - Year-over-year growth 2025-2030 (%)
Data Table on Boom lifts - Year-over-year growth 2025-2030 (%)

9.4 Scissor lifts - Market size and forecast 2025-2030

Chart on Scissor lifts - Market size and forecast 2025-2030 ($ million)
Data Table on Scissor lifts - Market size and forecast 2025-2030 ($ million)
Chart on Scissor lifts - Year-over-year growth 2025-2030 (%)
Data Table on Scissor lifts - Year-over-year growth 2025-2030 (%)

9.5 Vertical mast lifts - Market size and forecast 2025-2030

Chart on Vertical mast lifts - Market size and forecast 2025-2030 ($ million)
Data Table on Vertical mast lifts - Market size and forecast 2025-2030 ($ million)
Chart on Vertical mast lifts - Year-over-year growth 2025-2030 (%)
Data Table on Vertical mast lifts - Year-over-year growth 2025-2030 (%)

9.6 Personnel portable lifts - Market size and forecast 2025-2030

Chart on Personnel portable lifts - Market size and forecast 2025-2030 ($ million)
Data Table on Personnel portable lifts - Market size and forecast 2025-2030 ($ million)
Chart on Personnel portable lifts - Year-over-year growth 2025-2030 (%)
Data Table on Personnel portable lifts - Year-over-year growth 2025-2030 (%)

9.7 Market opportunity by Product Type

Market opportunity by Product Type ($ million)
Data Table on Market opportunity by Product Type ($ million)

10. Market Segmentation by Source

10.1 Market segments

Chart on Source - Market share 2025-2030 (%)
Data Table on Source - Market share 2025-2030 (%)

10.2 Comparison by Source

Chart on Comparison by Source
Data Table on Comparison by Source

10.3 Electric - Market size and forecast 2025-2030

Chart on Electric - Market size and forecast 2025-2030 ($ million)
Data Table on Electric - Market size and forecast 2025-2030 ($ million)
Chart on Electric - Year-over-year growth 2025-2030 (%)
Data Table on Electric - Year-over-year growth 2025-2030 (%)

10.4 Diesel - Market size and forecast 2025-2030

Chart on Diesel - Market size and forecast 2025-2030 ($ million)
Data Table on Diesel - Market size and forecast 2025-2030 ($ million)
Chart on Diesel - Year-over-year growth 2025-2030 (%)
Data Table on Diesel - Year-over-year growth 2025-2030 (%)

10.5 Hybrid - Market size and forecast 2025-2030

Chart on Hybrid - Market size and forecast 2025-2030 ($ million)
Data Table on Hybrid - Market size and forecast 2025-2030 ($ million)
Chart on Hybrid - Year-over-year growth 2025-2030 (%)
Data Table on Hybrid - Year-over-year growth 2025-2030 (%)

10.6 Market opportunity by Source

Market opportunity by Source ($ million)
Data Table on Market opportunity by Source ($ million)

11. Customer Landscape

11.1 Customer landscape overview

Analysis of price sensitivity, lifecycle, customer purchase basket, adoption rates, and purchase criteria

12. Geographic Landscape

12.1 Geographic segmentation

Chart on Market share by geography 2025-2030 (%)
Data Table on Market share by geography 2025-2030 (%)

12.2 Geographic comparison

Chart on Geographic comparison
Data Table on Geographic comparison

12.3 Europe - Market size and forecast 2025-2030

Chart on Europe - Market size and forecast 2025-2030 ($ million)
Data Table on Europe - Market size and forecast 2025-2030 ($ million)
Chart on Europe - Year-over-year growth 2025-2030 (%)
Data Table on Europe - Year-over-year growth 2025-2030 (%)
Chart on Regional Comparison - Europe
Data Table on Regional Comparison - Europe

12.3.1 Germany - Market size and forecast 2025-2030

Chart on Germany - Market size and forecast 2025-2030 ($ million)
Data Table on Germany - Market size and forecast 2025-2030 ($ million)
Chart on Germany - Year-over-year growth 2025-2030 (%)
Data Table on Germany - Year-over-year growth 2025-2030 (%)

12.3.2 UK - Market size and forecast 2025-2030

Chart on UK - Market size and forecast 2025-2030 ($ million)
Data Table on UK - Market size and forecast 2025-2030 ($ million)
Chart on UK - Year-over-year growth 2025-2030 (%)
Data Table on UK - Year-over-year growth 2025-2030 (%)

12.3.3 France - Market size and forecast 2025-2030

Chart on France - Market size and forecast 2025-2030 ($ million)
Data Table on France - Market size and forecast 2025-2030 ($ million)
Chart on France - Year-over-year growth 2025-2030 (%)
Data Table on France - Year-over-year growth 2025-2030 (%)

12.3.4 Italy - Market size and forecast 2025-2030

Chart on Italy - Market size and forecast 2025-2030 ($ million)
Data Table on Italy - Market size and forecast 2025-2030 ($ million)
Chart on Italy - Year-over-year growth 2025-2030 (%)
Data Table on Italy - Year-over-year growth 2025-2030 (%)

12.3.5 Spain - Market size and forecast 2025-2030

Chart on Spain - Market size and forecast 2025-2030 ($ million)
Data Table on Spain - Market size and forecast 2025-2030 ($ million)
Chart on Spain - Year-over-year growth 2025-2030 (%)
Data Table on Spain - Year-over-year growth 2025-2030 (%)

12.3.6 The Netherlands - Market size and forecast 2025-2030

Chart on The Netherlands - Market size and forecast 2025-2030 ($ million)
Data Table on The Netherlands - Market size and forecast 2025-2030 ($ million)
Chart on The Netherlands - Year-over-year growth 2025-2030 (%)
Data Table on The Netherlands - Year-over-year growth 2025-2030 (%)

12.4 North America - Market size and forecast 2025-2030

Chart on North America - Market size and forecast 2025-2030 ($ million)
Data Table on North America - Market size and forecast 2025-2030 ($ million)
Chart on North America - Year-over-year growth 2025-2030 (%)
Data Table on North America - Year-over-year growth 2025-2030 (%)
Chart on Regional Comparison - North America
Data Table on Regional Comparison - North America

12.4.1 US - Market size and forecast 2025-2030

Chart on US - Market size and forecast 2025-2030 ($ million)
Data Table on US - Market size and forecast 2025-2030 ($ million)
Chart on US - Year-over-year growth 2025-2030 (%)
Data Table on US - Year-over-year growth 2025-2030 (%)

12.4.2 Canada - Market size and forecast 2025-2030

Chart on Canada - Market size and forecast 2025-2030 ($ million)
Data Table on Canada - Market size and forecast 2025-2030 ($ million)
Chart on Canada - Year-over-year growth 2025-2030 (%)
Data Table on Canada - Year-over-year growth 2025-2030 (%)

12.4.3 Mexico - Market size and forecast 2025-2030

Chart on Mexico - Market size and forecast 2025-2030 ($ million)
Data Table on Mexico - Market size and forecast 2025-2030 ($ million)
Chart on Mexico - Year-over-year growth 2025-2030 (%)
Data Table on Mexico - Year-over-year growth 2025-2030 (%)

12.5 APAC - Market size and forecast 2025-2030

Chart on APAC - Market size and forecast 2025-2030 ($ million)
Data Table on APAC - Market size and forecast 2025-2030 ($ million)
Chart on APAC - Year-over-year growth 2025-2030 (%)
Data Table on APAC - Year-over-year growth 2025-2030 (%)
Chart on Regional Comparison - APAC
Data Table on Regional Comparison - APAC

12.5.1 China - Market size and forecast 2025-2030

Chart on China - Market size and forecast 2025-2030 ($ million)
Data Table on China - Market size and forecast 2025-2030 ($ million)
Chart on China - Year-over-year growth 2025-2030 (%)
Data Table on China - Year-over-year growth 2025-2030 (%)

12.5.2 Japan - Market size and forecast 2025-2030

Chart on Japan - Market size and forecast 2025-2030 ($ million)
Data Table on Japan - Market size and forecast 2025-2030 ($ million)
Chart on Japan - Year-over-year growth 2025-2030 (%)
Data Table on Japan - Year-over-year growth 2025-2030 (%)

12.5.3 India - Market size and forecast 2025-2030

Chart on India - Market size and forecast 2025-2030 ($ million)
Data Table on India - Market size and forecast 2025-2030 ($ million)
Chart on India - Year-over-year growth 2025-2030 (%)
Data Table on India - Year-over-year growth 2025-2030 (%)

12.5.4 South Korea - Market size and forecast 2025-2030

Chart on South Korea - Market size and forecast 2025-2030 ($ million)
Data Table on South Korea - Market size and forecast 2025-2030 ($ million)
Chart on South Korea - Year-over-year growth 2025-2030 (%)
Data Table on South Korea - Year-over-year growth 2025-2030 (%)

12.5.5 Australia - Market size and forecast 2025-2030

Chart on Australia - Market size and forecast 2025-2030 ($ million)
Data Table on Australia - Market size and forecast 2025-2030 ($ million)
Chart on Australia - Year-over-year growth 2025-2030 (%)
Data Table on Australia - Year-over-year growth 2025-2030 (%)

12.5.6 Indonesia - Market size and forecast 2025-2030

Chart on Indonesia - Market size and forecast 2025-2030 ($ million)
Data Table on Indonesia - Market size and forecast 2025-2030 ($ million)
Chart on Indonesia - Year-over-year growth 2025-2030 (%)
Data Table on Indonesia - Year-over-year growth 2025-2030 (%)

12.6 Middle East and Africa - Market size and forecast 2025-2030

Chart on Middle East and Africa - Market size and forecast 2025-2030 ($ million)
Data Table on Middle East and Africa - Market size and forecast 2025-2030 ($ million)
Chart on Middle East and Africa - Year-over-year growth 2025-2030 (%)
Data Table on Middle East and Africa - Year-over-year growth 2025-2030 (%)
Chart on Regional Comparison - Middle East and Africa
Data Table on Regional Comparison - Middle East and Africa

12.6.1 Saudi Arabia - Market size and forecast 2025-2030

Chart on Saudi Arabia - Market size and forecast 2025-2030 ($ million)
Data Table on Saudi Arabia - Market size and forecast 2025-2030 ($ million)
Chart on Saudi Arabia - Year-over-year growth 2025-2030 (%)
Data Table on Saudi Arabia - Year-over-year growth 2025-2030 (%)

12.6.2 UAE - Market size and forecast 2025-2030

Chart on UAE - Market size and forecast 2025-2030 ($ million)
Data Table on UAE - Market size and forecast 2025-2030 ($ million)
Chart on UAE - Year-over-year growth 2025-2030 (%)
Data Table on UAE - Year-over-year growth 2025-2030 (%)

12.6.3 South Africa - Market size and forecast 2025-2030

Chart on South Africa - Market size and forecast 2025-2030 ($ million)
Data Table on South Africa - Market size and forecast 2025-2030 ($ million)
Chart on South Africa - Year-over-year growth 2025-2030 (%)
Data Table on South Africa - Year-over-year growth 2025-2030 (%)

12.6.4 Israel - Market size and forecast 2025-2030

Chart on Israel - Market size and forecast 2025-2030 ($ million)
Data Table on Israel - Market size and forecast 2025-2030 ($ million)
Chart on Israel - Year-over-year growth 2025-2030 (%)
Data Table on Israel - Year-over-year growth 2025-2030 (%)

12.6.5 Turkey - Market size and forecast 2025-2030

Chart on Turkey - Market size and forecast 2025-2030 ($ million)
Data Table on Turkey - Market size and forecast 2025-2030 ($ million)
Chart on Turkey - Year-over-year growth 2025-2030 (%)
Data Table on Turkey - Year-over-year growth 2025-2030 (%)

12.7 South America - Market size and forecast 2025-2030

Chart on South America - Market size and forecast 2025-2030 ($ million)
Data Table on South America - Market size and forecast 2025-2030 ($ million)
Chart on South America - Year-over-year growth 2025-2030 (%)
Data Table on South America - Year-over-year growth 2025-2030 (%)
Chart on Regional Comparison - South America
Data Table on Regional Comparison - South America

12.7.1 Brazil - Market size and forecast 2025-2030

Chart on Brazil - Market size and forecast 2025-2030 ($ million)
Data Table on Brazil - Market size and forecast 2025-2030 ($ million)
Chart on Brazil - Year-over-year growth 2025-2030 (%)
Data Table on Brazil - Year-over-year growth 2025-2030 (%)

12.7.2 Argentina - Market size and forecast 2025-2030

Chart on Argentina - Market size and forecast 2025-2030 ($ million)
Data Table on Argentina - Market size and forecast 2025-2030 ($ million)
Chart on Argentina - Year-over-year growth 2025-2030 (%)
Data Table on Argentina - Year-over-year growth 2025-2030 (%)

12.7.3 Chile - Market size and forecast 2025-2030

Chart on Chile - Market size and forecast 2025-2030 ($ million)
Data Table on Chile - Market size and forecast 2025-2030 ($ million)
Chart on Chile - Year-over-year growth 2025-2030 (%)
Data Table on Chile - Year-over-year growth 2025-2030 (%)

12.8 Market opportunity by geography

Market opportunity by geography ($ million)
Data Tables on Market opportunity by geography ($ million)

13. Drivers, Challenges, and Opportunity

13.1 Market drivers

Growth in utility and infrastructure
Expansion of urban construction activities
Advancements in safety and ergonomics

13.2 Market challenges

Prohibitive capital outlays and maintenance
Stringent emission and safety regulations
Supply chain and component bottlenecks

13.3 Impact of drivers and challenges

Impact of drivers and challenges in 2025 and 2030

13.4 Market opportunities

Shift toward electric powertrains and alternative energy
Integration of smart fleet telematics
Proliferation of equipment rental models

14. Competitive Landscape

14.1 Overview

14.2

Overview on criticality of inputs and factors of differentiation

14.3 Landscape disruption

Overview on factors of disruption

14.4 Industry risks

Impact of key risks on business

15. Competitive Analysis

15.1 Companies profiled

Companies covered

15.2 Company ranking index

15.3 Market positioning of companies

Matrix on companies position and classification

15.4 Aichi Corp

Aichi Corp - Overview
Aichi Corp - Business segments
Aichi Corp - Key offerings
Aichi Corp - Segment focus
SWOT

15.5 Altec Inc.

Altec Inc. - Overview
Altec Inc. - Product / Service
Altec Inc. - Key offerings
SWOT

15.6 Bronto Skylift Oy Ab

Bronto Skylift Oy Ab - Overview
Bronto Skylift Oy Ab - Product / Service
Bronto Skylift Oy Ab - Key offerings
SWOT

15.7 Comet Spa

Comet Spa - Overview
Comet Spa - Product / Service
Comet Spa - Key offerings
SWOT

15.8 GSR S.p.A.

GSR S.p.A. - Overview
GSR S.p.A. - Product / Service
GSR S.p.A. - Key offerings
SWOT

15.9 Haulotte Group

Haulotte Group - Overview
Haulotte Group - Business segments
Haulotte Group - Key offerings
Haulotte Group - Segment focus
SWOT

15.10 Hunan Sinoboom Intelligent

Hunan Sinoboom Intelligent - Overview
Hunan Sinoboom Intelligent - Product / Service
Hunan Sinoboom Intelligent - Key offerings
SWOT

15.11 Klubb Srl

Klubb Srl - Overview
Klubb Srl - Product / Service
Klubb Srl - Key offerings
SWOT

15.12 Manitou BF SA

Manitou BF SA - Overview
Manitou BF SA - Product / Service
Manitou BF SA - Key offerings
SWOT

15.13 PALFINGER AG

PALFINGER AG - Overview
PALFINGER AG - Business segments
PALFINGER AG - Key offerings
PALFINGER AG - Segment focus
SWOT

15.14 Tadano Ltd.

Tadano Ltd. - Overview
Tadano Ltd. - Business segments
Tadano Ltd. - Key offerings
Tadano Ltd. - Segment focus
SWOT

15.15 Terex Corp.

Terex Corp. - Overview
Terex Corp. - Business segments
Terex Corp. - Key offerings
Terex Corp. - Segment focus
SWOT

15.16 Time Manufacturing Co

Time Manufacturing Co - Overview
Time Manufacturing Co - Product / Service
Time Manufacturing Co - Key offerings
SWOT

15.17 Xuzhou Construction Machinery

Xuzhou Construction Machinery - Overview
Xuzhou Construction Machinery - Business segments
Xuzhou Construction Machinery - Key offerings
Xuzhou Construction Machinery - Segment focus
SWOT

15.18 Zoomlion Industry Co. Ltd.

Zoomlion Industry Co. Ltd. - Overview
Zoomlion Industry Co. Ltd. - Business segments
Zoomlion Industry Co. Ltd. - Key offerings
Zoomlion Industry Co. Ltd. - Segment focus
SWOT

16. Appendix

16.1 Scope of the report

Market definition
Objectives
Notes and caveats

16.2 Inclusions and exclusions checklist

Inclusions checklist
Exclusions checklist

16.3 Currency conversion rates for US$

16.4 Research methodology

16.5 Data procurement

Information sources

16.6 Data validation

16.7 Validation techniques employed for market sizing

16.8 Data synthesis

16.9 360 degree market analysis

16.10 List of abbreviations

Research Methodology

Technavio presents a detailed picture of the market by way of study, synthesis, and summation of data from multiple sources. The analysts have presented the various facets of the market with a particular focus on identifying the key industry influencers. The data thus presented is comprehensive, reliable, and the result of extensive research, both primary and secondary.

INFORMATION SOURCES

Primary sources

  • Manufacturers and suppliers
  • Channel partners
  • Industry experts
  • Strategic decision makers

Secondary sources

  • Industry journals and periodicals
  • Government data
  • Financial reports of key industry players
  • Historical data
  • Press releases

DATA ANALYSIS

Data Synthesis

  • Collation of data
  • Estimation of key figures
  • Analysis of derived insights

Data Validation

  • Triangulation with data models
  • Reference against proprietary databases
  • Corroboration with industry experts

REPORT WRITING

Qualitative

  • Market drivers
  • Market challenges
  • Market trends
  • Five forces analysis

Quantitative

  • Market size and forecast
  • Market segmentation
  • Geographical insights
  • Competitive landscape

Interested in this report?

Get your sample now to see our research methodology and insights!

Download Now

Frequently Asked Questions

Truck-Mounted Aerial Work Platform (Awp) market growth will increase by USD 1931.7 million during 2026-2030.

The Truck-Mounted Aerial Work Platform (Awp) market is expected to grow at a CAGR of 6.4% during 2026-2030.

Truck-Mounted Aerial Work Platform (Awp) market is segmented by End-user (Utility sector, Construction sector, Others) Product type (Boom lifts, Scissor lifts, Vertical mast lifts, Personnel portable lifts) Source (Electric, Diesel, Hybrid)

Aichi Corp, Altec Inc., Bronto Skylift Oy Ab, Comet Spa, CTE SpA, GSR S.p.A., Haulotte Group, Hunan Sinoboom Intelligent, Klubb Srl, Manitou BF SA, Multitel Pagliero S.p.A, PALFINGER AG, Ruthmann Holdings GmbH, Socage S.r.l., Tadano Ltd., Terex Corp., Time Manufacturing Co, Xuzhou Construction Machinery, Zoomlion Industry Co. Ltd. are a few of the key vendors in the Truck-Mounted Aerial Work Platform (Awp) market.

Europe will register the highest growth rate of 51.3% among the other regions. Therefore, the Truck-Mounted Aerial Work Platform (Awp) market in Europe is expected to garner significant business opportunities for the vendors during the forecast period.

Germany, UK, France, Italy, Spain, The Netherlands, US, Canada, Mexico, China, Japan, India, South Korea, Australia, Indonesia, Saudi Arabia, UAE, South Africa, Israel, Turkey, Brazil, Argentina, Chile

  • Growth in utility and infrastructure is the driving factor this market.

The Truck-Mounted Aerial Work Platform (Awp) market vendors should focus on grabbing business opportunities from the End-user segment as it accounted for the largest market share in the base year.
RIA - Research AI Assistant
Ask RIA
