Ureteroscopy Devices Market Analysis, Size, and Forecast 2026-2030: North America (US, Canada, and Mexico), Europe (Germany, UK, and France), APAC (China, India, and Japan), South America (Brazil, Colombia, and Argentina), Middle East and Africa (Saudi Arabia, Turkey, and South Africa), Asia, Rest of World (ROW)

Ureteroscopy Devices Market Analysis, Size, and Forecast 2026-2030:
North America (US, Canada, and Mexico), Europe (Germany, UK, and France), APAC (China, India, and Japan), South America (Brazil, Colombia, and Argentina), Middle East and Africa (Saudi Arabia, Turkey, and South Africa), Asia, Rest of World (ROW)

Published: Dec 2025 295 Pages SKU: IRTNTR70293

Market Overview at a Glance

$331.5 Mn
Market Opportunity
5.4%
CAGR 2025 - 2030
34.3%
North America Growth
$606.3 Mn
Hospitals segment 2024

Ureteroscopy Devices Market Size 2026-2030

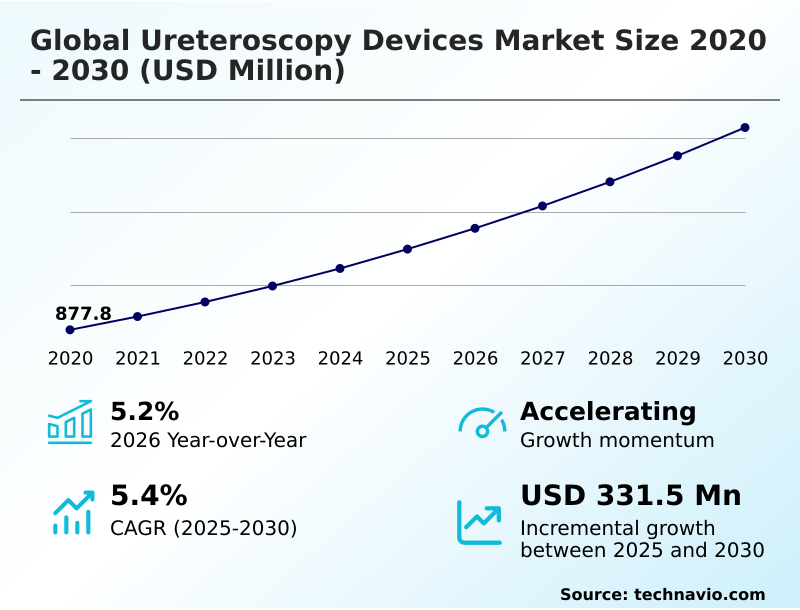
The ureteroscopy devices market size is valued to increase by USD 331.5 million, at a CAGR of 5.4% from 2025 to 2030. Growing prevalence of kidney stones and ureteral cancer will drive the ureteroscopy devices market.

Major Market Trends & Insights

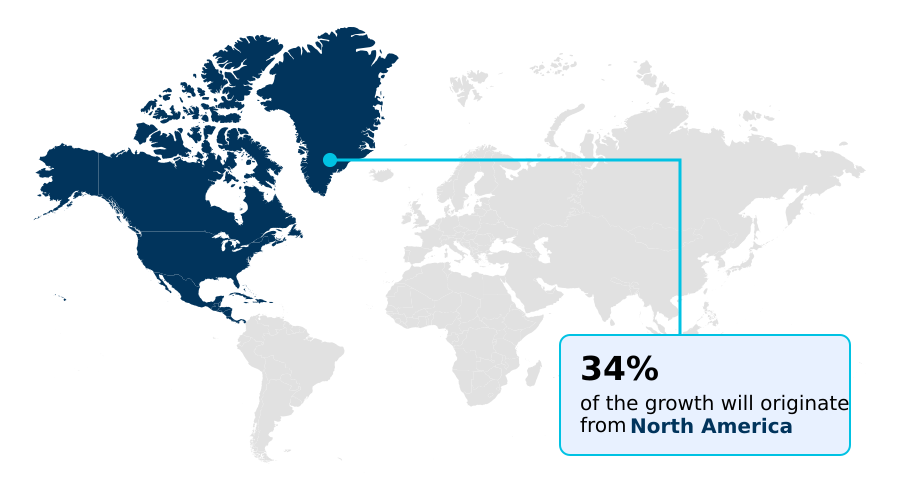
  • North America dominated the market and accounted for a 34.3% growth during the forecast period.
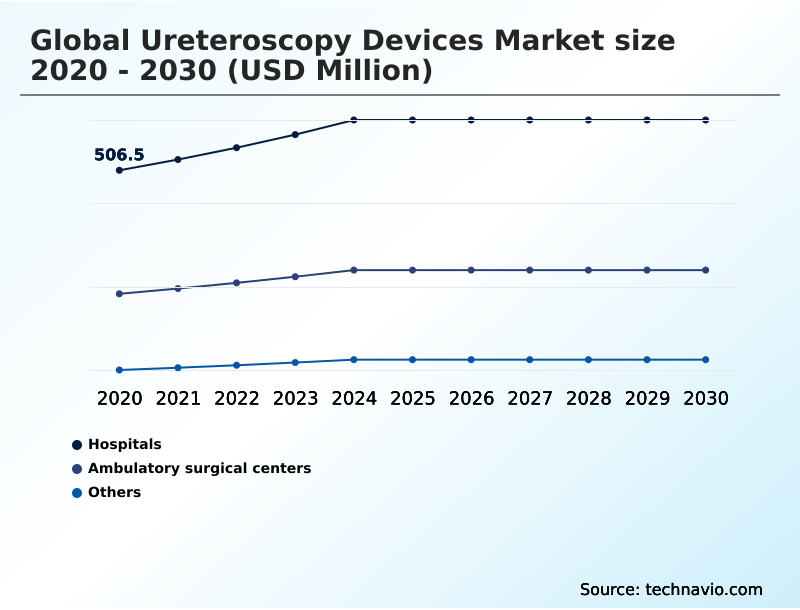
  • By End-user - Hospitals segment was valued at USD 606.3 million in 2024
  • By Product - Flexible ureteroscopes segment accounted for the largest market revenue share in 2024

Market Size & Forecast

  • Market Opportunities: USD 551.6 million
  • Market Future Opportunities: USD 331.5 million
  • CAGR from 2025 to 2030 : 5.4%

Market Summary

  • The ureteroscopy devices market is shaped by the rising global incidence of urological disorders, including kidney stones and upper tract urothelial carcinoma, which fuels demand for effective diagnostic and therapeutic interventions. A significant driver is the clinical shift toward minimally invasive urology, favoring procedures that reduce patient morbidity and shorten recovery times.
  • Technological innovation remains a powerful force, with advancements in digital flexible ureteroscope design, such as chip-on-the-tip technology and superior active deflection capability, enabling surgeons to navigate complex anatomy with greater precision. The growing adoption of single-use flexible ureteroscope models addresses critical concerns around sterile reprocessing and cross-contamination risks.
  • However, the high capital investment and repair costs associated with reusable systems, along with the per-procedure cost of disposables, present significant budget challenges for healthcare facilities.
  • A key business scenario involves hospitals implementing hybrid procurement strategies; for instance, a facility might use durable reusable scopes for scheduled, low-risk cases while reserving single-use devices for emergency procedures or high-risk patients to optimize both instrument durability and infection control, thereby balancing operational costs with clinical imperatives. This strategic asset management is becoming crucial for sustainable endourology service delivery.

What will be the Size of the Ureteroscopy Devices Market during the forecast period?

Get Key Insights on Market Forecast (PDF) Request Free Sample

How is the Ureteroscopy Devices Market Segmented?

The ureteroscopy devices industry research report provides comprehensive data (region-wise segment analysis), with forecasts and estimates in "USD million" for the period 2026-2030, as well as historical data from 2020-2024 for the following segments.

  • End-user
    • Hospitals
    • Ambulatory surgical centers
    • Others
  • Product
    • Flexible ureteroscopes
    • Semi-rigid ureteroscopes
  • Application
    • Urolithiasis
    • Urinary stricture
    • Kidney cancer
    • Others
  • Geography
    • North America
      • US
      • Canada
      • Mexico
    • Europe
      • Germany
      • UK
      • France
    • Asia
    • Rest of World (ROW)

By End-user Insights

The hospitals segment is estimated to witness significant growth during the forecast period.

Hospitals represent the primary end-user segment, driven by the need to manage a wide spectrum of urological cases, from routine diagnostic ureteroscopy to complex interventions.

Purchasing decisions are complex, balancing clinical demands for superior performance with administrative pressures for cost control. The debate over the cost-effectiveness of disposable scopes versus the total cost of ownership for a reusable flexible ureteroscope remains central.

Facilities are optimizing procedural ergonomics and urology procedure efficiency in urology hybrid operating rooms, with some achieving a 15% reduction in turnaround times by refining ureteroscope maintenance cycles and sterilization workflows.

Strict ureteroscope reprocessing protocols are critical, influencing the choice between devices based on instrument durability, working channel diameter, and compatibility with advanced systems like robotic-assisted ureteroscopy.

Request Free Sample

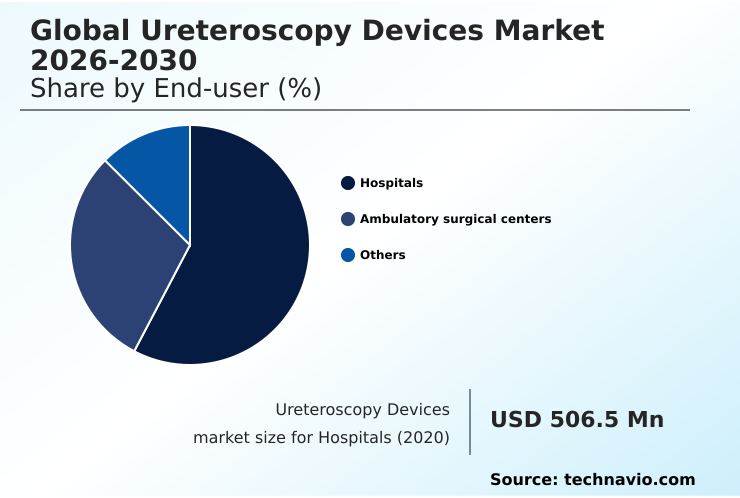
The Hospitals segment was valued at USD 606.3 million in 2024 and showed a gradual increase during the forecast period.

Request Free Sample

Regional Analysis

North America is estimated to contribute 34.3% to the growth of the global market during the forecast period.Technavio’s analysts have elaborately explained the regional trends and drivers that shape the market during the forecast period.

See How Ureteroscopy Devices Market Demand is Rising in North America Request Free Sample

The geographic landscape is characterized by varied technology adoption rates.

North America leads due to high healthcare spending and rapid adoption of advanced laser lithotripsy, whereas parts of Asia Pacific represent the fastest-growing market, with a 34% share of the incremental growth.

In Europe, mature markets focus on optimizing kidney stone management through updated ureteroscopy guidelines, balancing the use of semi-rigid ureteroscope devices with flexible models for navigating tortuous ureters.

Emerging economies are improving access to urology clinic equipment but often prioritize durable, lower-cost options over disposables. Investments in pediatric ureteroscopy devices are also increasing globally.

Strategies for ureteroscope damage prevention and efficient use of electrosurgical instruments are universal concerns, impacting purchasing decisions. In some regions, ureteroscopy is gaining ground over percutaneous nephrolithotomy for specific indications, driven by improved stone fragmentation efficiency.

Market Dynamics

Our researchers analyzed the data with 2025 as the base year, along with the key drivers, trends, and challenges. A holistic analysis of drivers will help companies refine their marketing strategies to gain a competitive advantage.

  • Strategic decision-making in the ureteroscopy devices market requires a deep understanding of nuanced procedural factors. A critical consideration is the impact of ureteroscope diameter on patient outcomes, where smaller instruments are often preferred for less traumatic procedures. This is closely linked to innovations in portable ureteroscopy systems, which are expanding the viability of office-based procedures.
  • Healthcare providers are intensely comparing reusable vs single-use ureteroscope costs, with analysis showing that high-volume centers can mitigate the higher per-case cost of disposables through operational efficiencies that improve throughput by over 10% compared to facilities reliant on reprocessing. The ureteroscopic management of ureteral strictures and ureteroscopy for upper tract tumor biopsy are growing applications demanding superior technology.
  • Key technical debates include digital imaging versus fiber-optic ureteroscopy for improving visualization in ureteroscopy procedures and the cost-benefit analysis of thulium fiber lasers for stone treatment. Advancements in flexible ureteroscope deflection are crucial, as are best practices for ureteral access sheath use and optimizing irrigation flow in ureteroscopy.
  • A focus on reducing ureteroscope damage during surgery, managing intrarenal pressure in ureteroscopy, and addressing infection risks with reprocessed ureteroscopes are vital for patient safety.
  • Furthermore, ergonomic improvements in ureteroscope design, alongside better training methods for advanced flexible ureteroscopy, are essential for addressing challenges in semi-rigid ureteroscope navigation and enhancing performance in specialized areas like ureteroscopy in pediatric urology patients, while also considering the single-use ureteroscope environmental impact. The role of robotics in complex ureteroscopy continues to expand, promising to redefine standards of care.

What are the key market drivers leading to the rise in the adoption of Ureteroscopy Devices Industry?

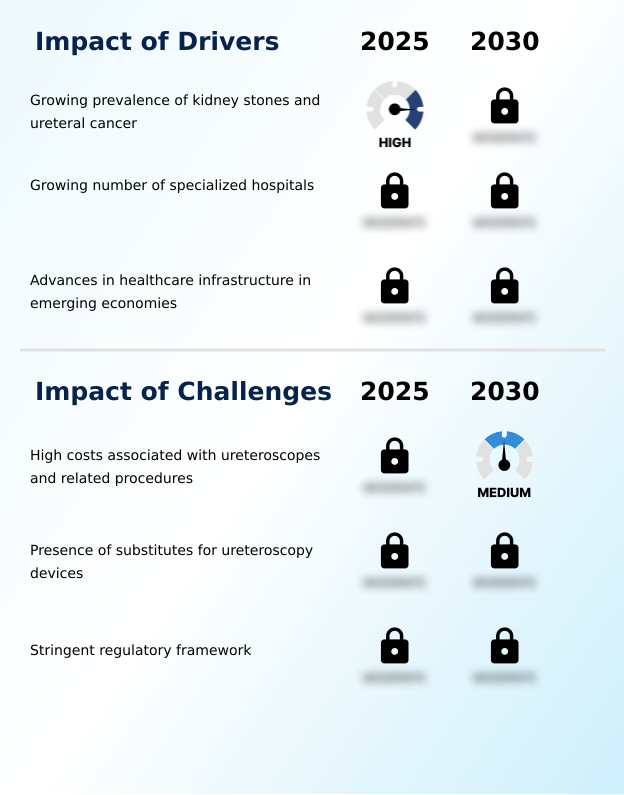
  • The growing prevalence of kidney stones and ureteral cancer is a key driver fueling the demand for ureteroscopy devices.

  • Market growth is driven by the increasing preference for minimally invasive urology and technological advancements that improve outcomes. The adoption of a digital flexible ureteroscope with chip-on-the-tip technology enhances visualization for therapeutic ureteroscopy.
  • Innovations in kidney stone fragmentation techniques, especially advanced laser lithotripsy using the thulium fiber laser, have increased stone-free rates by over 15% in complex cases. This supports the trend toward endoscopic stone treatment and minimally invasive stone removal.
  • A focus on patient safety in endourology has also spurred the use of better procedural tools like the ureteral access sheath and stone retrieval basket.
  • Furthermore, the high costs associated with flexible ureteroscope repair are pushing many institutions toward disposable options, with facilities noting a 40% reduction in their annual endoscope maintenance budgets.

What are the market trends shaping the Ureteroscopy Devices Industry?

  • A notable upcoming market trend is the continuous stream of technological advancements in ureteroscopy devices. These innovations are enhancing procedural efficacy and expanding clinical applications.

  • Key trends are centered on urology device innovation, particularly the shift toward single-use flexible ureteroscope models to enhance safety and efficiency. The advancement of endoscope camera technology, with CMOS imaging sensors replacing older fiber-optic ureteroscopes, has improved diagnostic accuracy in endoscopy by up to 25% in certain studies.
  • Advanced visualization modalities such as narrow-band imaging are becoming standard for detecting upper tract urothelial carcinoma. The adoption of a robotic urology surgery platform is also accelerating, promising greater precision in complex endourology procedures.
  • To support this technological shift, ureteroscopy training simulators are being integrated into residency programs, improving surgeon proficiency on new devices by 30% before they enter the operating room.

What challenges does the Ureteroscopy Devices Industry face during its growth?

  • The high costs associated with ureteroscopes and their related procedures present a key challenge that affects the industry's growth trajectory.

  • Primary market challenges revolve around single-use endoscope economics and the high cost of advanced systems. While high-definition imaging and superior active deflection capability are desirable, justifying the expense remains difficult for budget-constrained facilities, where adoption of new technology lags by up to three years compared to well-funded centers.
  • The cost-effectiveness of disposable scopes is a complex calculation, as the per-procedure expense must be weighed against eliminating ureteroscope maintenance cycles and complex reprocessing protocols. Stringent urological device sterilization rules add to the operational burden of reusables. Furthermore, the availability of lower-cost alternatives like shock wave lithotripsy for certain stone types can limit procedural volume.
  • The high price of a portable visualization system, for example, can be a significant barrier for smaller clinics aiming to establish in-office procedures.

Exclusive Technavio Analysis on Customer Landscape

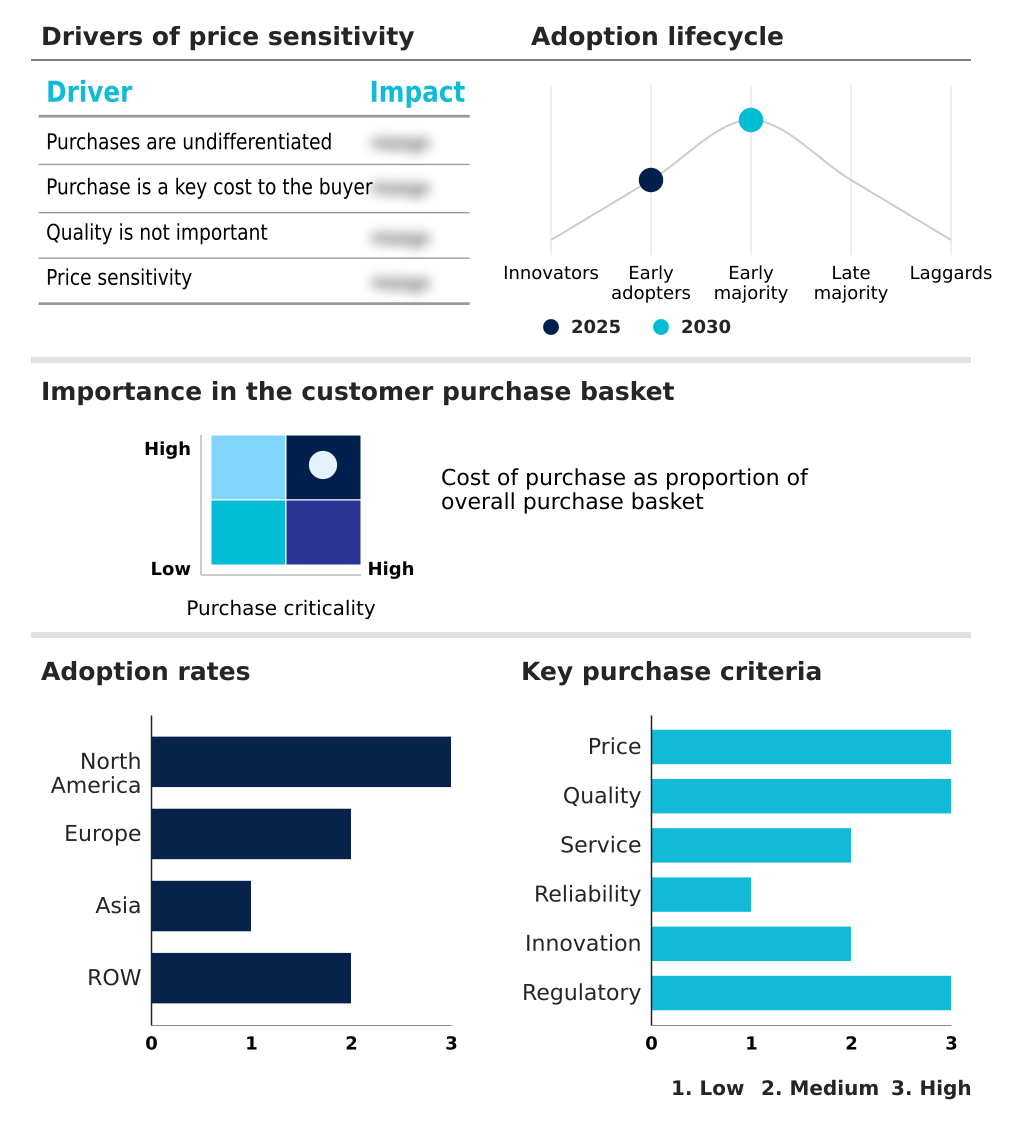
The ureteroscopy devices market forecasting report includes the adoption lifecycle of the market, covering from the innovator’s stage to the laggard’s stage. It focuses on adoption rates in different regions based on penetration. Furthermore, the ureteroscopy devices market report also includes key purchase criteria and drivers of price sensitivity to help companies evaluate and develop their market growth analysis strategies.

Customer Landscape of Ureteroscopy Devices Industry

Competitive Landscape

Companies are implementing various strategies, such as strategic alliances, ureteroscopy devices market forecast, partnerships, mergers and acquisitions, geographical expansion, and product/service launches, to enhance their presence in the industry.

AdvaMed - The organization provides advocacy and policy support for innovative ureteroscopes and imaging technologies, fostering advancements in urological diagnostics and stone management within the industry.

The industry research and growth report includes detailed analyses of the competitive landscape of the market and information about key companies, including:

  • AdvaMed
  • Advin Health Care
  • B.Braun SE
  • Becton Dickinson and Co.
  • Boston Scientific Corp.
  • Coloplast AS
  • Cook Group Inc.
  • Erbe Elektromedizin GmbH
  • HOYA CORP.
  • KARL STORZ SE and Co. KG
  • Olympus Corp.
  • OPCOM Medical Inc.
  • PENTAX Medical Co.
  • ProSurg Inc.
  • Richard Wolf GmbH
  • Stryker Corp.

Qualitative and quantitative analysis of companies has been conducted to help clients understand the wider business environment as well as the strengths and weaknesses of key industry players. Data is qualitatively analyzed to categorize companies as pure play, category-focused, industry-focused, and diversified; it is quantitatively analyzed to categorize companies as dominant, leading, strong, tentative, and weak.

Recent Development and News in Ureteroscopy devices market

  • In May 2025, OPCOM Medical Inc. announced it had received U.S. FDA approval for its single-use flexible ureteroscope system, marking its entry into this competitive market segment.
  • In September 2025, Olympus announced an exclusive global distribution agreement with MacroLux Medical Technology to distribute a range of single-use urology products, including ureteroscopes.
  • In April 2025, Medtronic is slated to present late-breaking data from its Expand URO clinical trial for the Hugo robotic-assisted surgery (RAS) system, following its submission to the U.S. Food and Drug Administration (FDA).
  • In October 2025, Johnson and Johnson is expected to highlight advancements in its MONARCH Platform for Urology, which leverages AI-driven simulation to enhance robotic-assisted procedures.

Dive into Technavio’s robust research methodology, blending expert interviews, extensive data synthesis, and validated models for unparalleled Ureteroscopy Devices Market insights. See full methodology.

Market Scope
Page number 295
Base year 2025
Historic period 2020-2024
Forecast period 2026-2030
Growth momentum & CAGR Accelerate at a CAGR of 5.4%
Market growth 2026-2030 USD 331.5 million
Market structure Fragmented
YoY growth 2025-2026(%) 5.2%
Key countries US, Canada, Mexico, Germany, UK, France, Italy, Spain, The Netherlands, China, India, Japan, South Korea, Thailand, Malaysia, Brazil, Saudi Arabia, Turkey, South Africa, UAE, Colombia, Argentina and Israel
Competitive landscape Leading Companies, Market Positioning of Companies, Competitive Strategies, and Industry Risks

Request Free Sample

Research Analyst Overview

  • The ureteroscopy devices market is defined by a dynamic interplay between technological innovation and clinical necessity. The evolution from reusable flexible ureteroscope models to single-use flexible ureteroscope options is reshaping purchasing decisions, driven by concerns over sterile reprocessing and instrument durability.
  • Core technologies like chip-on-the-tip technology and CMOS imaging sensors have revolutionized endoscopic visualization, providing high-definition imaging that surpasses traditional fiber-optic ureteroscopes. This improved clarity is critical for both diagnostic ureteroscopy and therapeutic ureteroscopy, particularly in procedures like laser lithotripsy. The choice between a holmium laser and a thulium fiber laser is now a key consideration, impacting stone fragmentation efficiency.
  • For complex cases, robotic-assisted ureteroscopy is gaining traction, offering enhanced procedural ergonomics. Devices are further specialized with features like narrow-band imaging for detecting upper tract urothelial carcinoma and intrarenal pressure monitoring for safety.
  • The performance of a digital flexible ureteroscope is judged by its active deflection capability and working channel diameter, which determines compatibility with tools like stone retrieval baskets and electrosurgical instruments for tissue coagulation.
  • In minimally invasive urology, these advancements are pivotal for effective kidney stone management, with some facilities reporting a 20% reduction in difficult cases requiring conversion to more invasive procedures like percutaneous nephrolithotomy, a testament to the enhanced capabilities of modern endourology procedures.

What are the Key Data Covered in this Ureteroscopy Devices Market Research and Growth Report?

  • What is the expected growth of the Ureteroscopy Devices Market between 2026 and 2030?

    • USD 331.5 million, at a CAGR of 5.4%

  • What segmentation does the market report cover?

    • The report is segmented by End-user (Hospitals, Ambulatory surgical centers, and Others), Product (Flexible ureteroscopes, and Semi-rigid ureteroscopes), Application (Urolithiasis, Urinary stricture, Kidney cancer, and Others) and Geography (North America, Europe, Asia, Rest of World (ROW))

  • Which regions are analyzed in the report?

    • North America, Europe, Asia and Rest of World (ROW)

  • What are the key growth drivers and market challenges?

    • Growing prevalence of kidney stones and ureteral cancer, High costs associated with ureteroscopes and related procedures

  • Who are the major players in the Ureteroscopy Devices Market?

    • AdvaMed, Advin Health Care, B.Braun SE, Becton Dickinson and Co., Boston Scientific Corp., Coloplast AS, Cook Group Inc., Erbe Elektromedizin GmbH, HOYA CORP., KARL STORZ SE and Co. KG, Olympus Corp., OPCOM Medical Inc., PENTAX Medical Co., ProSurg Inc., Richard Wolf GmbH and Stryker Corp.

Market Research Insights

  • Market dynamics are heavily influenced by the compelling economics of single-use endoscopes and a focus on patient safety in endourology. Institutions are scrutinizing flexible ureteroscope repair costs, which can account for up to 25% of a device's initial purchase price annually.
  • The shift towards disposable models is driven by enhanced ureteroscopy infection control, with facilities reporting a near-total elimination of cross-contamination incidents. This transition directly impacts the urological surgical workflow, with some ambulatory centers achieving a 15% improvement in case turnover times by eliminating reprocessing delays.
  • The economic models demonstrate that while per-procedure costs are higher, the avoidance of repair expenses and potential infection-related litigation makes the total cost of ownership favorable in high-volume settings.

We can help! Our analysts can customize this ureteroscopy devices market research report to meet your requirements.

Get in touch

1. Executive Summary

1.1 Market overview

Executive Summary - Chart on Market Overview
Executive Summary - Data Table on Market Overview
Executive Summary - Chart on Global Market Characteristics
Executive Summary - Chart on Market by Geography
Executive Summary - Chart on Market Segmentation by End-user
Executive Summary - Chart on Market Segmentation by Product
Executive Summary - Chart on Market Segmentation by Application
Executive Summary - Chart on Incremental Growth
Executive Summary - Data Table on Incremental Growth
Executive Summary - Chart on Company Market Positioning

2. Technavio Analysis

2.1 Analysis of price sensitivity, lifecycle, customer purchase basket, adoption rates, and purchase criteria

2.2 Criticality of inputs and Factors of differentiation

Chart on Overview on criticality of inputs and factors of differentiation

2.3 Factors of disruption

Chart on Overview on factors of disruption

2.4 Impact of drivers and challenges

Chart on Impact of drivers and challenges in 2025 and 2030

3. Market Landscape

3.1 Market ecosystem

Chart on Parent Market
Data Table on - Parent Market

3.2 Market characteristics

Chart on Market characteristics analysis

3.3 Value chain analysis

Chart on Value chain analysis

4. Market Sizing

4.1 Market definition

Data Table on Offerings of companies included in the market definition

4.2 Market segment analysis

Market segments

4.3 Market size 2025

4.4 Market outlook: Forecast for 2025-2030

Chart on Global - Market size and forecast 2025-2030 ($ million)
Data Table on Global - Market size and forecast 2025-2030 ($ million)
Chart on Global Market: Year-over-year growth 2025-2030 (%)
Data Table on Global Market: Year-over-year growth 2025-2030 (%)

5. Historic Market Size

5.1 Global Ureteroscopy Devices Market 2020 - 2024

Historic Market Size - Data Table on Global Ureteroscopy Devices Market 2020 - 2024 ($ million)

5.2 End-user segment analysis 2020 - 2024

Historic Market Size - End-user Segment 2020 - 2024 ($ million)

5.3 Product segment analysis 2020 - 2024

Historic Market Size - Product Segment 2020 - 2024 ($ million)

5.4 Application segment analysis 2020 - 2024

Historic Market Size - Application Segment 2020 - 2024 ($ million)

5.5 Geography segment analysis 2020 - 2024

Historic Market Size - Geography Segment 2020 - 2024 ($ million)

5.6 Country segment analysis 2020 - 2024

Historic Market Size - Country Segment 2020 - 2024 ($ million)

6. Qualitative Analysis

6.1 The AI impact on global ureteroscopy devices market

7. Five Forces Analysis

7.1 Five forces summary

Five forces analysis - Comparison between 2025 and 2030

7.2 Bargaining power of buyers

Bargaining power of buyers - Impact of key factors 2025 and 2030

7.3 Bargaining power of suppliers

Bargaining power of suppliers - Impact of key factors in 2025 and 2030

7.4 Threat of new entrants

Threat of new entrants - Impact of key factors in 2025 and 2030

7.5 Threat of substitutes

Threat of substitutes - Impact of key factors in 2025 and 2030

7.6 Threat of rivalry

Threat of rivalry - Impact of key factors in 2025 and 2030

7.7 Market condition

Chart on Market condition - Five forces 2025 and 2030

8. Market Segmentation by End-user

8.1 Market segments

Chart on End-user - Market share 2025-2030 (%)
Data Table on End-user - Market share 2025-2030 (%)

8.2 Comparison by End-user

Chart on Comparison by End-user
Data Table on Comparison by End-user

8.3 Hospitals - Market size and forecast 2025-2030

Chart on Hospitals - Market size and forecast 2025-2030 ($ million)
Data Table on Hospitals - Market size and forecast 2025-2030 ($ million)
Chart on Hospitals - Year-over-year growth 2025-2030 (%)
Data Table on Hospitals - Year-over-year growth 2025-2030 (%)

8.4 Ambulatory surgical centers - Market size and forecast 2025-2030

Chart on Ambulatory surgical centers - Market size and forecast 2025-2030 ($ million)
Data Table on Ambulatory surgical centers - Market size and forecast 2025-2030 ($ million)
Chart on Ambulatory surgical centers - Year-over-year growth 2025-2030 (%)
Data Table on Ambulatory surgical centers - Year-over-year growth 2025-2030 (%)

8.5 Others - Market size and forecast 2025-2030

Chart on Others - Market size and forecast 2025-2030 ($ million)
Data Table on Others - Market size and forecast 2025-2030 ($ million)
Chart on Others - Year-over-year growth 2025-2030 (%)
Data Table on Others - Year-over-year growth 2025-2030 (%)

8.6 Market opportunity by End-user

Market opportunity by End-user ($ million)
Data Table on Market opportunity by End-user ($ million)

9. Market Segmentation by Product

9.1 Market segments

Chart on Product - Market share 2025-2030 (%)
Data Table on Product - Market share 2025-2030 (%)

9.2 Comparison by Product

Chart on Comparison by Product
Data Table on Comparison by Product

9.3 Flexible ureteroscopes - Market size and forecast 2025-2030

Chart on Flexible ureteroscopes - Market size and forecast 2025-2030 ($ million)
Data Table on Flexible ureteroscopes - Market size and forecast 2025-2030 ($ million)
Chart on Flexible ureteroscopes - Year-over-year growth 2025-2030 (%)
Data Table on Flexible ureteroscopes - Year-over-year growth 2025-2030 (%)

9.4 Semi-rigid ureteroscopes - Market size and forecast 2025-2030

Chart on Semi-rigid ureteroscopes - Market size and forecast 2025-2030 ($ million)
Data Table on Semi-rigid ureteroscopes - Market size and forecast 2025-2030 ($ million)
Chart on Semi-rigid ureteroscopes - Year-over-year growth 2025-2030 (%)
Data Table on Semi-rigid ureteroscopes - Year-over-year growth 2025-2030 (%)

9.5 Market opportunity by Product

Market opportunity by Product ($ million)
Data Table on Market opportunity by Product ($ million)

10. Market Segmentation by Application

10.1 Market segments

Chart on Application - Market share 2025-2030 (%)
Data Table on Application - Market share 2025-2030 (%)

10.2 Comparison by Application

Chart on Comparison by Application
Data Table on Comparison by Application

10.3 Urolithiasis - Market size and forecast 2025-2030

Chart on Urolithiasis - Market size and forecast 2025-2030 ($ million)
Data Table on Urolithiasis - Market size and forecast 2025-2030 ($ million)
Chart on Urolithiasis - Year-over-year growth 2025-2030 (%)
Data Table on Urolithiasis - Year-over-year growth 2025-2030 (%)

10.4 Urinary stricture - Market size and forecast 2025-2030

Chart on Urinary stricture - Market size and forecast 2025-2030 ($ million)
Data Table on Urinary stricture - Market size and forecast 2025-2030 ($ million)
Chart on Urinary stricture - Year-over-year growth 2025-2030 (%)
Data Table on Urinary stricture - Year-over-year growth 2025-2030 (%)

10.5 Kidney cancer - Market size and forecast 2025-2030

Chart on Kidney cancer - Market size and forecast 2025-2030 ($ million)
Data Table on Kidney cancer - Market size and forecast 2025-2030 ($ million)
Chart on Kidney cancer - Year-over-year growth 2025-2030 (%)
Data Table on Kidney cancer - Year-over-year growth 2025-2030 (%)

10.6 Others - Market size and forecast 2025-2030

Chart on Others - Market size and forecast 2025-2030 ($ million)
Data Table on Others - Market size and forecast 2025-2030 ($ million)
Chart on Others - Year-over-year growth 2025-2030 (%)
Data Table on Others - Year-over-year growth 2025-2030 (%)

10.7 Market opportunity by Application

Market opportunity by Application ($ million)
Data Table on Market opportunity by Application ($ million)

11. Customer Landscape

11.1 Customer landscape overview

Analysis of price sensitivity, lifecycle, customer purchase basket, adoption rates, and purchase criteria

12. Geographic Landscape

12.1 Geographic segmentation

Chart on Market share by geography 2025-2030 (%)
Data Table on Market share by geography 2025-2030 (%)

12.2 Geographic comparison

Chart on Geographic comparison
Data Table on Geographic comparison

12.3 North America - Market size and forecast 2025-2030

Chart on North America - Market size and forecast 2025-2030 ($ million)
Data Table on North America - Market size and forecast 2025-2030 ($ million)
Chart on North America - Year-over-year growth 2025-2030 (%)
Data Table on North America - Year-over-year growth 2025-2030 (%)
Chart on Regional Comparison - North America
Data Table on Regional Comparison - North America

12.3.1 US - Market size and forecast 2025-2030

Chart on US - Market size and forecast 2025-2030 ($ million)
Data Table on US - Market size and forecast 2025-2030 ($ million)
Chart on US - Year-over-year growth 2025-2030 (%)
Data Table on US - Year-over-year growth 2025-2030 (%)

12.3.2 Canada - Market size and forecast 2025-2030

Chart on Canada - Market size and forecast 2025-2030 ($ million)
Data Table on Canada - Market size and forecast 2025-2030 ($ million)
Chart on Canada - Year-over-year growth 2025-2030 (%)
Data Table on Canada - Year-over-year growth 2025-2030 (%)

12.3.3 Mexico - Market size and forecast 2025-2030

Chart on Mexico - Market size and forecast 2025-2030 ($ million)
Data Table on Mexico - Market size and forecast 2025-2030 ($ million)
Chart on Mexico - Year-over-year growth 2025-2030 (%)
Data Table on Mexico - Year-over-year growth 2025-2030 (%)

12.4 Europe - Market size and forecast 2025-2030

Chart on Europe - Market size and forecast 2025-2030 ($ million)
Data Table on Europe - Market size and forecast 2025-2030 ($ million)
Chart on Europe - Year-over-year growth 2025-2030 (%)
Data Table on Europe - Year-over-year growth 2025-2030 (%)
Chart on Regional Comparison - Europe
Data Table on Regional Comparison - Europe

12.4.1 Germany - Market size and forecast 2025-2030

Chart on Germany - Market size and forecast 2025-2030 ($ million)
Data Table on Germany - Market size and forecast 2025-2030 ($ million)
Chart on Germany - Year-over-year growth 2025-2030 (%)
Data Table on Germany - Year-over-year growth 2025-2030 (%)

12.4.2 UK - Market size and forecast 2025-2030

Chart on UK - Market size and forecast 2025-2030 ($ million)
Data Table on UK - Market size and forecast 2025-2030 ($ million)
Chart on UK - Year-over-year growth 2025-2030 (%)
Data Table on UK - Year-over-year growth 2025-2030 (%)

12.4.3 France - Market size and forecast 2025-2030

Chart on France - Market size and forecast 2025-2030 ($ million)
Data Table on France - Market size and forecast 2025-2030 ($ million)
Chart on France - Year-over-year growth 2025-2030 (%)
Data Table on France - Year-over-year growth 2025-2030 (%)

12.4.4 Italy - Market size and forecast 2025-2030

Chart on Italy - Market size and forecast 2025-2030 ($ million)
Data Table on Italy - Market size and forecast 2025-2030 ($ million)
Chart on Italy - Year-over-year growth 2025-2030 (%)
Data Table on Italy - Year-over-year growth 2025-2030 (%)

12.4.5 Spain - Market size and forecast 2025-2030

Chart on Spain - Market size and forecast 2025-2030 ($ million)
Data Table on Spain - Market size and forecast 2025-2030 ($ million)
Chart on Spain - Year-over-year growth 2025-2030 (%)
Data Table on Spain - Year-over-year growth 2025-2030 (%)

12.4.6 The Netherlands - Market size and forecast 2025-2030

Chart on The Netherlands - Market size and forecast 2025-2030 ($ million)
Data Table on The Netherlands - Market size and forecast 2025-2030 ($ million)
Chart on The Netherlands - Year-over-year growth 2025-2030 (%)
Data Table on The Netherlands - Year-over-year growth 2025-2030 (%)

12.5 Asia - Market size and forecast 2025-2030

Chart on Asia - Market size and forecast 2025-2030 ($ million)
Data Table on Asia - Market size and forecast 2025-2030 ($ million)
Chart on Asia - Year-over-year growth 2025-2030 (%)
Data Table on Asia - Year-over-year growth 2025-2030 (%)
Chart on Regional Comparison - Asia
Data Table on Regional Comparison - Asia

12.5.1 China - Market size and forecast 2025-2030

Chart on China - Market size and forecast 2025-2030 ($ million)
Data Table on China - Market size and forecast 2025-2030 ($ million)
Chart on China - Year-over-year growth 2025-2030 (%)
Data Table on China - Year-over-year growth 2025-2030 (%)

12.5.2 India - Market size and forecast 2025-2030

Chart on India - Market size and forecast 2025-2030 ($ million)
Data Table on India - Market size and forecast 2025-2030 ($ million)
Chart on India - Year-over-year growth 2025-2030 (%)
Data Table on India - Year-over-year growth 2025-2030 (%)

12.5.3 Japan - Market size and forecast 2025-2030

Chart on Japan - Market size and forecast 2025-2030 ($ million)
Data Table on Japan - Market size and forecast 2025-2030 ($ million)
Chart on Japan - Year-over-year growth 2025-2030 (%)
Data Table on Japan - Year-over-year growth 2025-2030 (%)

12.5.4 South Korea - Market size and forecast 2025-2030

Chart on South Korea - Market size and forecast 2025-2030 ($ million)
Data Table on South Korea - Market size and forecast 2025-2030 ($ million)
Chart on South Korea - Year-over-year growth 2025-2030 (%)
Data Table on South Korea - Year-over-year growth 2025-2030 (%)

12.5.5 Thailand - Market size and forecast 2025-2030

Chart on Thailand - Market size and forecast 2025-2030 ($ million)
Data Table on Thailand - Market size and forecast 2025-2030 ($ million)
Chart on Thailand - Year-over-year growth 2025-2030 (%)
Data Table on Thailand - Year-over-year growth 2025-2030 (%)

12.5.6 Malaysia - Market size and forecast 2025-2030

Chart on Malaysia - Market size and forecast 2025-2030 ($ million)
Data Table on Malaysia - Market size and forecast 2025-2030 ($ million)
Chart on Malaysia - Year-over-year growth 2025-2030 (%)
Data Table on Malaysia - Year-over-year growth 2025-2030 (%)

12.6 Rest of World (ROW) - Market size and forecast 2025-2030

Chart on Rest of World (ROW) - Market size and forecast 2025-2030 ($ million)
Data Table on Rest of World (ROW) - Market size and forecast 2025-2030 ($ million)
Chart on Rest of World (ROW) - Year-over-year growth 2025-2030 (%)
Data Table on Rest of World (ROW) - Year-over-year growth 2025-2030 (%)
Chart on Regional Comparison - Rest of World (ROW)
Data Table on Regional Comparison - Rest of World (ROW)

12.6.1 Brazil - Market size and forecast 2025-2030

Chart on Brazil - Market size and forecast 2025-2030 ($ million)
Data Table on Brazil - Market size and forecast 2025-2030 ($ million)
Chart on Brazil - Year-over-year growth 2025-2030 (%)
Data Table on Brazil - Year-over-year growth 2025-2030 (%)

12.6.2 Saudi Arabia - Market size and forecast 2025-2030

Chart on Saudi Arabia - Market size and forecast 2025-2030 ($ million)
Data Table on Saudi Arabia - Market size and forecast 2025-2030 ($ million)
Chart on Saudi Arabia - Year-over-year growth 2025-2030 (%)
Data Table on Saudi Arabia - Year-over-year growth 2025-2030 (%)

12.6.3 Turkey - Market size and forecast 2025-2030

Chart on Turkey - Market size and forecast 2025-2030 ($ million)
Data Table on Turkey - Market size and forecast 2025-2030 ($ million)
Chart on Turkey - Year-over-year growth 2025-2030 (%)
Data Table on Turkey - Year-over-year growth 2025-2030 (%)

12.6.4 South Africa - Market size and forecast 2025-2030

Chart on South Africa - Market size and forecast 2025-2030 ($ million)
Data Table on South Africa - Market size and forecast 2025-2030 ($ million)
Chart on South Africa - Year-over-year growth 2025-2030 (%)
Data Table on South Africa - Year-over-year growth 2025-2030 (%)

12.6.5 UAE - Market size and forecast 2025-2030

Chart on UAE - Market size and forecast 2025-2030 ($ million)
Data Table on UAE - Market size and forecast 2025-2030 ($ million)
Chart on UAE - Year-over-year growth 2025-2030 (%)
Data Table on UAE - Year-over-year growth 2025-2030 (%)

12.6.6 Colombia - Market size and forecast 2025-2030

Chart on Colombia - Market size and forecast 2025-2030 ($ million)
Data Table on Colombia - Market size and forecast 2025-2030 ($ million)
Chart on Colombia - Year-over-year growth 2025-2030 (%)
Data Table on Colombia - Year-over-year growth 2025-2030 (%)

12.6.7 Argentina - Market size and forecast 2025-2030

Chart on Argentina - Market size and forecast 2025-2030 ($ million)
Data Table on Argentina - Market size and forecast 2025-2030 ($ million)
Chart on Argentina - Year-over-year growth 2025-2030 (%)
Data Table on Argentina - Year-over-year growth 2025-2030 (%)

12.6.8 Israel - Market size and forecast 2025-2030

Chart on Israel - Market size and forecast 2025-2030 ($ million)
Data Table on Israel - Market size and forecast 2025-2030 ($ million)
Chart on Israel - Year-over-year growth 2025-2030 (%)
Data Table on Israel - Year-over-year growth 2025-2030 (%)

12.7 Market opportunity by geography

Market opportunity by geography ($ million)
Data Tables on Market opportunity by geography ($ million)

13. Drivers, Challenges, and Opportunity

13.1 Market drivers

Growing prevalence of kidney stones and ureteral cancer
Growing number of specialized hospitals
Advances in healthcare infrastructure in emerging economies

13.2 Market challenges

High costs associated with ureteroscopes and related procedures
Presence of substitutes for ureteroscopy devices
Stringent regulatory framework

13.3 Impact of drivers and challenges

Impact of drivers and challenges in 2025 and 2030

13.4 Market opportunities

Rising technological advances in ureteroscopy devices
Presence of integrated systems in hybrid operating rooms
Increasing online sales of ureteroscopy devices

14. Competitive Landscape

14.1 Overview

14.2

Overview on criticality of inputs and factors of differentiation

14.3 Landscape disruption

Overview on factors of disruption

14.4 Industry risks

Impact of key risks on business

15. Competitive Analysis

15.1 Companies profiled

Companies covered

15.2 Company ranking index

15.3 Market positioning of companies

Matrix on companies position and classification

15.4 AdvaMed

AdvaMed - Overview
AdvaMed - Product / Service
AdvaMed - Key offerings
SWOT

15.5 Advin Health Care

Advin Health Care - Overview
Advin Health Care - Product / Service
Advin Health Care - Key offerings
SWOT

15.6 B.Braun SE

B.Braun SE - Overview
B.Braun SE - Product / Service
B.Braun SE - Key news
B.Braun SE - Key offerings
SWOT

15.7 Becton Dickinson and Co.

Becton Dickinson and Co. - Overview
Becton Dickinson and Co. - Business segments
Becton Dickinson and Co. - Key news
Becton Dickinson and Co. - Key offerings
Becton Dickinson and Co. - Segment focus
SWOT

15.8 Boston Scientific Corp.

Boston Scientific Corp. - Overview
Boston Scientific Corp. - Business segments
Boston Scientific Corp. - Key news
Boston Scientific Corp. - Key offerings
Boston Scientific Corp. - Segment focus
SWOT

15.9 Coloplast AS

Coloplast AS - Overview
Coloplast AS - Business segments
Coloplast AS - Key news
Coloplast AS - Key offerings
Coloplast AS - Segment focus
SWOT

15.10 Cook Group Inc.

Cook Group Inc. - Overview
Cook Group Inc. - Product / Service
Cook Group Inc. - Key offerings
SWOT

15.11 Erbe Elektromedizin GmbH

Erbe Elektromedizin GmbH - Overview
Erbe Elektromedizin GmbH - Product / Service
Erbe Elektromedizin GmbH - Key offerings
SWOT

15.12 HOYA CORP.

HOYA CORP. - Overview
HOYA CORP. - Business segments
HOYA CORP. - Key offerings
HOYA CORP. - Segment focus
SWOT

15.13 KARL STORZ SE and Co. KG

KARL STORZ SE and Co. KG - Overview
KARL STORZ SE and Co. KG - Product / Service
KARL STORZ SE and Co. KG - Key offerings
SWOT

15.14 Olympus Corp.

Olympus Corp. - Overview
Olympus Corp. - Business segments
Olympus Corp. - Key news
Olympus Corp. - Key offerings
Olympus Corp. - Segment focus
SWOT

15.15 OPCOM Medical Inc.

OPCOM Medical Inc. - Overview
OPCOM Medical Inc. - Product / Service
OPCOM Medical Inc. - Key offerings
SWOT

15.16 PENTAX Medical Co.

PENTAX Medical Co. - Overview
PENTAX Medical Co. - Product / Service
PENTAX Medical Co. - Key offerings
SWOT

15.17 ProSurg Inc.

ProSurg Inc. - Overview
ProSurg Inc. - Product / Service
ProSurg Inc. - Key offerings
SWOT

15.18 Richard Wolf GmbH

Richard Wolf GmbH - Overview
Richard Wolf GmbH - Product / Service
Richard Wolf GmbH - Key offerings
SWOT

16. Appendix

16.1 Scope of the report

Market definition
Objectives
Notes and caveats

16.2 Inclusions and exclusions checklist

Inclusions checklist
Exclusions checklist

16.3 Currency conversion rates for US$

16.4 Research methodology

16.5 Data procurement

Information sources

16.6 Data validation

16.7 Validation techniques employed for market sizing

16.8 Data synthesis

16.9 360 degree market analysis

16.10 List of abbreviations

Research Methodology

Technavio presents a detailed picture of the market by way of study, synthesis, and summation of data from multiple sources. The analysts have presented the various facets of the market with a particular focus on identifying the key industry influencers. The data thus presented is comprehensive, reliable, and the result of extensive research, both primary and secondary.

INFORMATION SOURCES

Primary sources

  • Manufacturers and suppliers
  • Channel partners
  • Industry experts
  • Strategic decision makers

Secondary sources

  • Industry journals and periodicals
  • Government data
  • Financial reports of key industry players
  • Historical data
  • Press releases

DATA ANALYSIS

Data Synthesis

  • Collation of data
  • Estimation of key figures
  • Analysis of derived insights

Data Validation

  • Triangulation with data models
  • Reference against proprietary databases
  • Corroboration with industry experts

REPORT WRITING

Qualitative

  • Market drivers
  • Market challenges
  • Market trends
  • Five forces analysis

Quantitative

  • Market size and forecast
  • Market segmentation
  • Geographical insights
  • Competitive landscape

Interested in this report?

Get your sample now to see our research methodology and insights!

Download Now

Frequently Asked Questions

Ureteroscopy Devices market growth will increase by USD 331.5 million during 2026-2030 .

The Ureteroscopy Devices market is expected to grow at a CAGR of 5.4% during 2026-2030 .

Ureteroscopy Devices market is segmented by End-user (Hospitals, Ambulatory surgical centers, Others) Product (Flexible ureteroscopes, Semi-rigid ureteroscopes) Application (Urolithiasis, Urinary stricture, Kidney cancer, Others)

AdvaMed, Advin Health Care, B.Braun SE, Becton Dickinson and Co., Boston Scientific Corp., Coloplast AS, Cook Group Inc., Erbe Elektromedizin GmbH, HOYA CORP., KARL STORZ SE and Co. KG, Olympus Corp., OPCOM Medical Inc., PENTAX Medical Co., ProSurg Inc., Richard Wolf GmbH, Stryker Corp. are a few of the key vendors in the Ureteroscopy Devices market.

North America will register the highest growth rate of 34.3% among the other regions. Therefore, the Ureteroscopy Devices market in North America is expected to garner significant business opportunities for the vendors during the forecast period.

US, Canada, Mexico, Germany, UK, France, Italy, Spain, The Netherlands, China, India, Japan, South Korea, Thailand, Malaysia, Brazil, Saudi Arabia, Turkey, South Africa, UAE, Colombia, Argentina, Israel

  • Growing prevalence of kidney stones and ureteral cancer is the driving factor this market.

The Ureteroscopy Devices market vendors should focus on grabbing business opportunities from the End-user segment as it accounted for the largest market share in the base year.